
Proprietary & confidential to KORE Wireless I n v e s t o r P r e s e n t a t i o n May 28, 2025
Proprietary & confidential to KORE Wireless Proprietary & confidential to KORE Wireless | P R E S E N T AT I O N O U T L I N E KORE Overview 2024 and Q1 2025 Business Update 1 2 2 Value Creation3 Q & A4

Proprietary & confidential to KORE Wireless 3 OVERVIEW
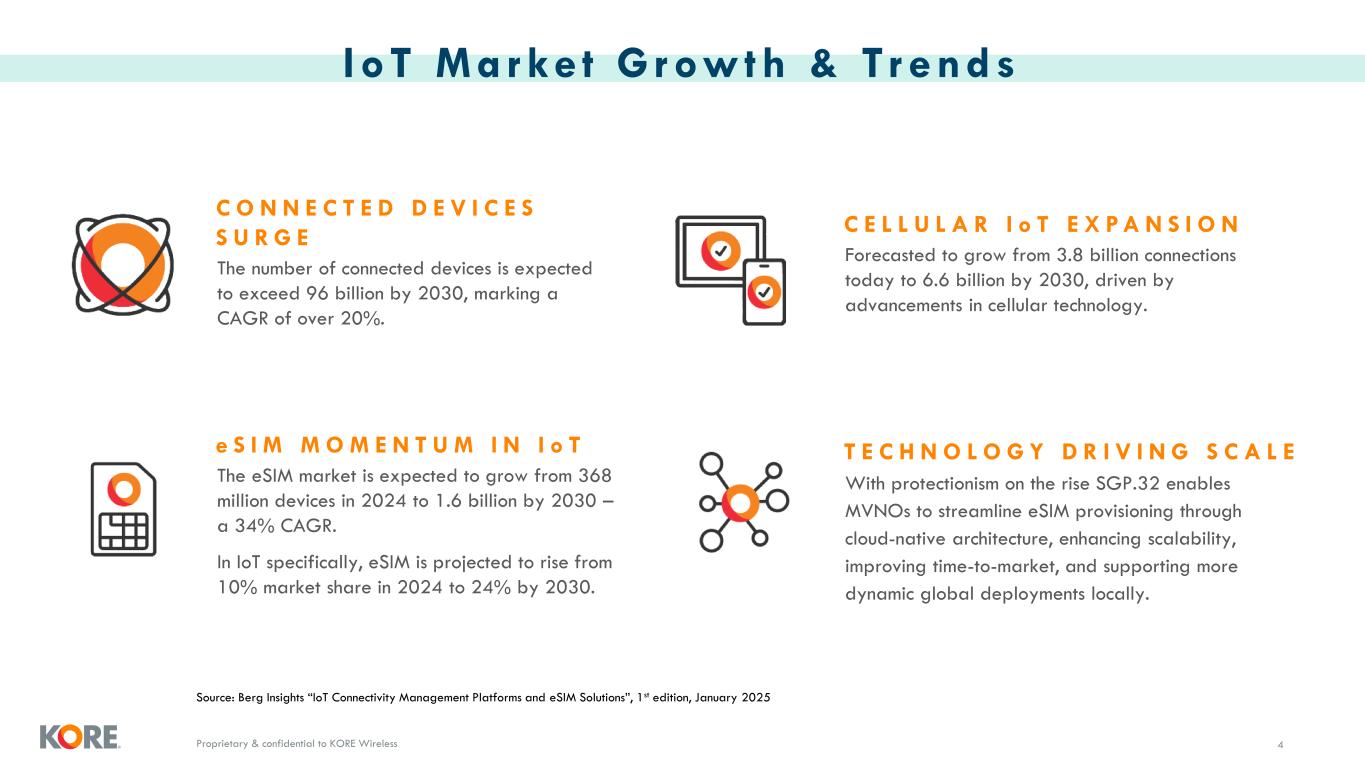
Proprietary & confidential to KORE Wireless I oT Marke t G rowth & Tr ends 4 C O N N E C T E D D E V I C E S S U R G E The number of connected devices is expected to exceed 96 billion by 2030, marking a CAGR of over 20%. C E L L U L A R I o T E X P A N S I O N Forecasted to grow from 3.8 billion connections today to 6.6 billion by 2030, driven by advancements in cellular technology. e S I M M O M E N T U M I N I o T The eSIM market is expected to grow from 368 million devices in 2024 to 1.6 billion by 2030 – a 34% CAGR. In IoT specifically, eSIM is projected to rise from 10% market share in 2024 to 24% by 2030. T E C H N O L O G Y D R I V I N G S C A L E With protectionism on the rise SGP.32 enables MVNOs to streamline eSIM provisioning through cloud-native architecture, enhancing scalability, improving time-to-market, and supporting more dynamic global deployments locally. Source: Berg Insights “IoT Connectivity Management Platforms and eSIM Solutions”, 1st edition, January 2025
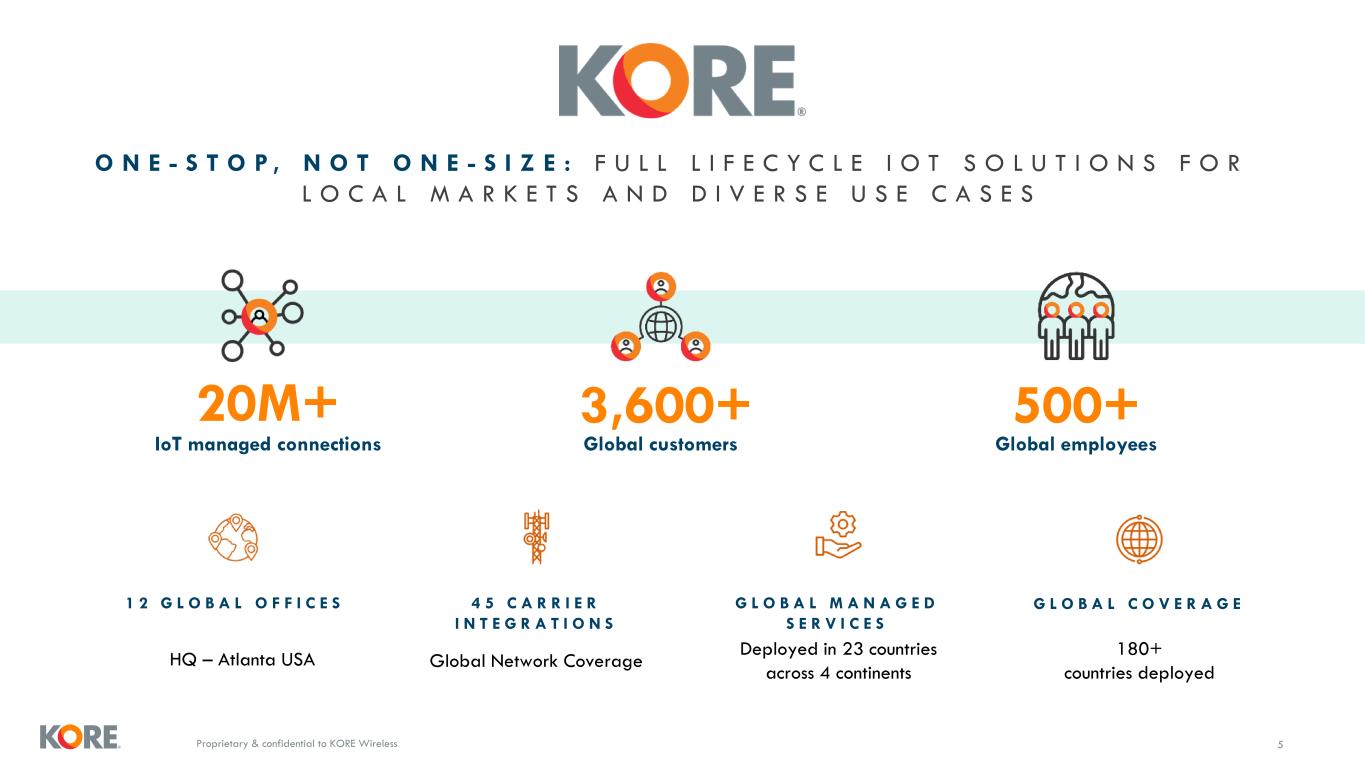
Proprietary & confidential to KORE Wireless 5 O N E - S T O P , N O T O N E - S I Z E : F U L L L I F E C Y C L E I O T S O L U T I O N S F O R L O C A L M A R K E T S A N D D I V E R S E U S E C A S E S 1 2 G L O B A L O F F I C E S HQ – Atlanta USA 4 5 C A R R I E R I N T E G R A T I O N S G L O B A L M A N A G E D S E R V I C E S Deployed in 23 countries across 4 continents G L O B A L C O V E R A G E 180+ countries deployed IoT managed connections 20M+ Global customers 3,600+ Global employees 500+ Global Network Coverage
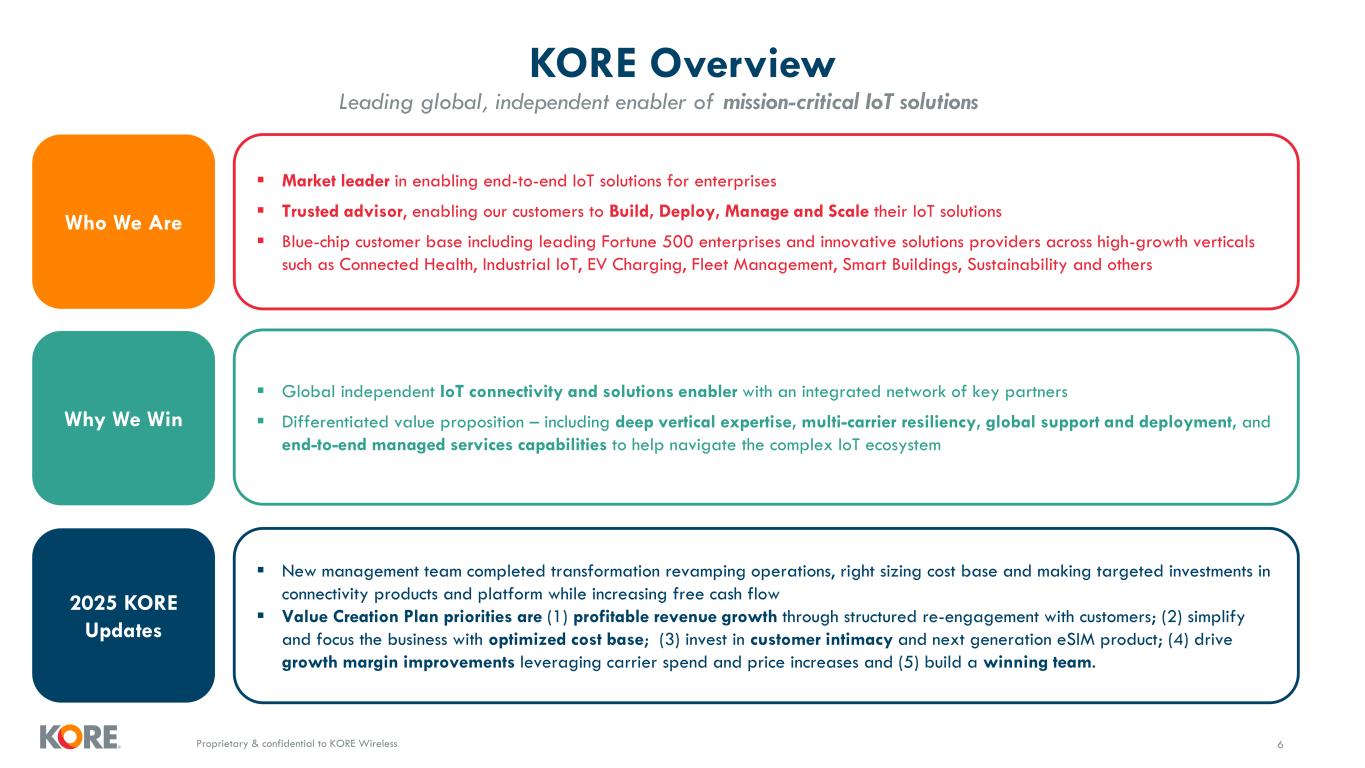
Proprietary & confidential to KORE Wireless KORE Overview 6 Leading global, independent enabler of mission-critical IoT solutions Who We Are Why We Win ▪ Market leader in enabling end-to-end IoT solutions for enterprises ▪ Trusted advisor, enabling our customers to Build, Deploy, Manage and Scale their IoT solutions ▪ Blue-chip customer base including leading Fortune 500 enterprises and innovative solutions providers across high-growth verticals such as Connected Health, Industrial IoT, EV Charging, Fleet Management, Smart Buildings, Sustainability and others 2025 KORE Updates ▪ Global independent IoT connectivity and solutions enabler with an integrated network of key partners ▪ Differentiated value proposition – including deep vertical expertise, multi-carrier resiliency, global support and deployment, and end-to-end managed services capabilities to help navigate the complex IoT ecosystem ▪ New management team completed transformation revamping operations, right sizing cost base and making targeted investments in connectivity products and platform while increasing free cash flow ▪ Value Creation Plan priorities are (1) profitable revenue growth through structured re-engagement with customers; (2) simplify and focus the business with optimized cost base; (3) invest in customer intimacy and next generation eSIM product; (4) drive growth margin improvements leveraging carrier spend and price increases and (5) build a winning team.
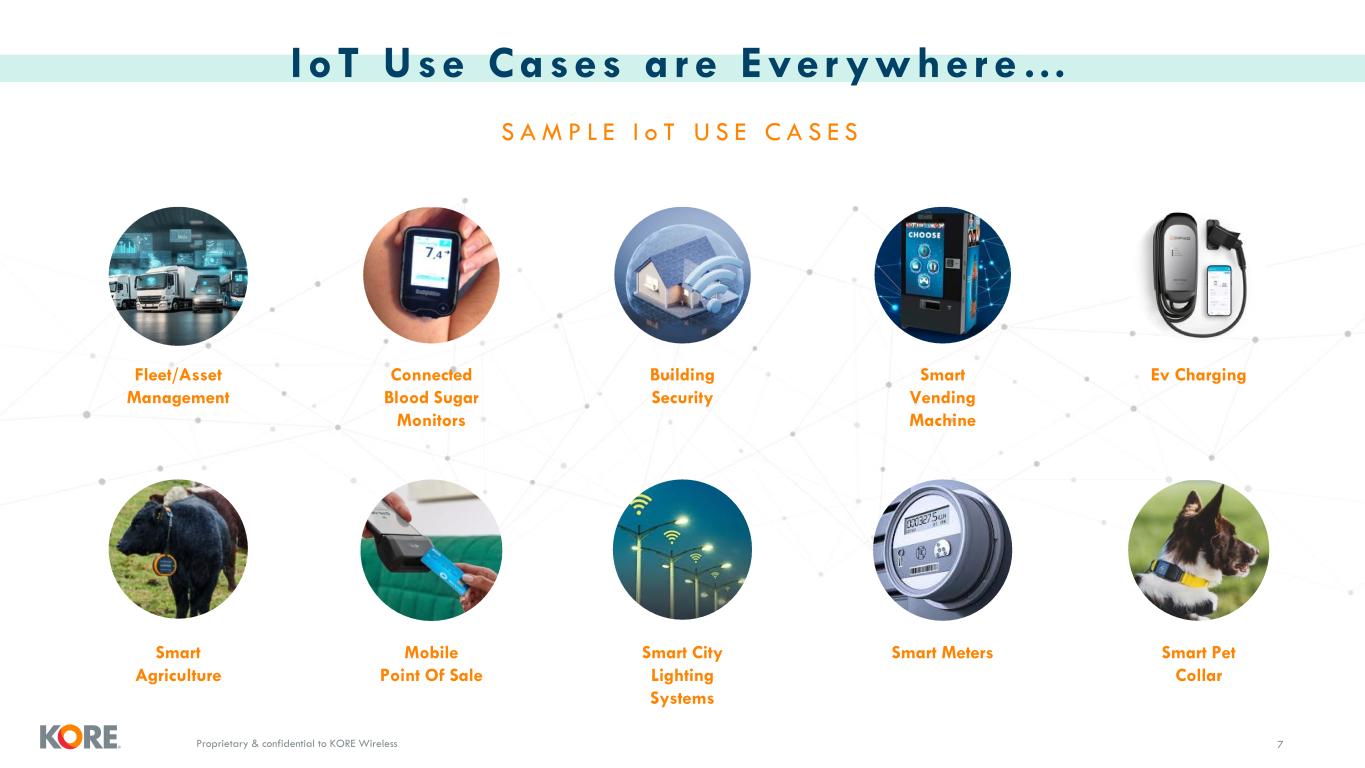
Proprietary & confidential to KORE Wireless I oT Use Cases a r e Eve r ywher e… 7 S A M P L E I o T U S E C A S E S Fleet/Asset Management Connected Blood Sugar Monitors Smart Agriculture Mobile Point Of Sale Smart Pet Collar Smart MetersSmart City Lighting Systems Building Security Ev ChargingSmart Vending Machine
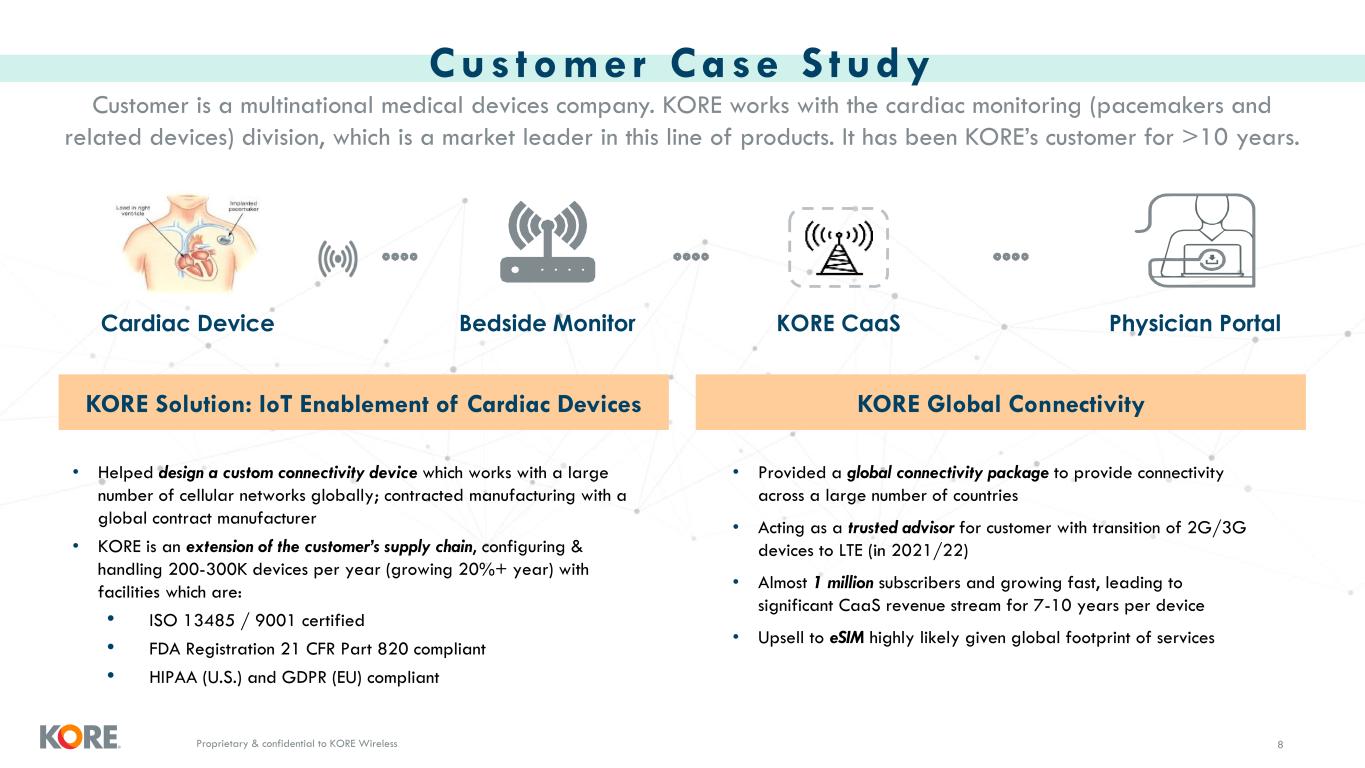
Proprietary & confidential to KORE Wireless Cus tomer Case S tudy 8 KORE Global Connectivity • Provided a global connectivity package to provide connectivity across a large number of countries • Acting as a trusted advisor for customer with transition of 2G/3G devices to LTE (in 2021/22) • Almost 1 million subscribers and growing fast, leading to significant CaaS revenue stream for 7-10 years per device • Upsell to eSIM highly likely given global footprint of services KORE Solution: IoT Enablement of Cardiac Devices • Helped design a custom connectivity device which works with a large number of cellular networks globally; contracted manufacturing with a global contract manufacturer • KORE is an extension of the customer’s supply chain, configuring & handling 200-300K devices per year (growing 20%+ year) with facilities which are: • ISO 13485 / 9001 certified • FDA Registration 21 CFR Part 820 compliant • HIPAA (U.S.) and GDPR (EU) compliant Physician PortalKORE CaaSCardiac Device Bedside Monitor Customer is a multinational medical devices company. KORE works with the cardiac monitoring (pacemakers and related devices) division, which is a market leader in this line of products. It has been KORE’s customer for >10 years.
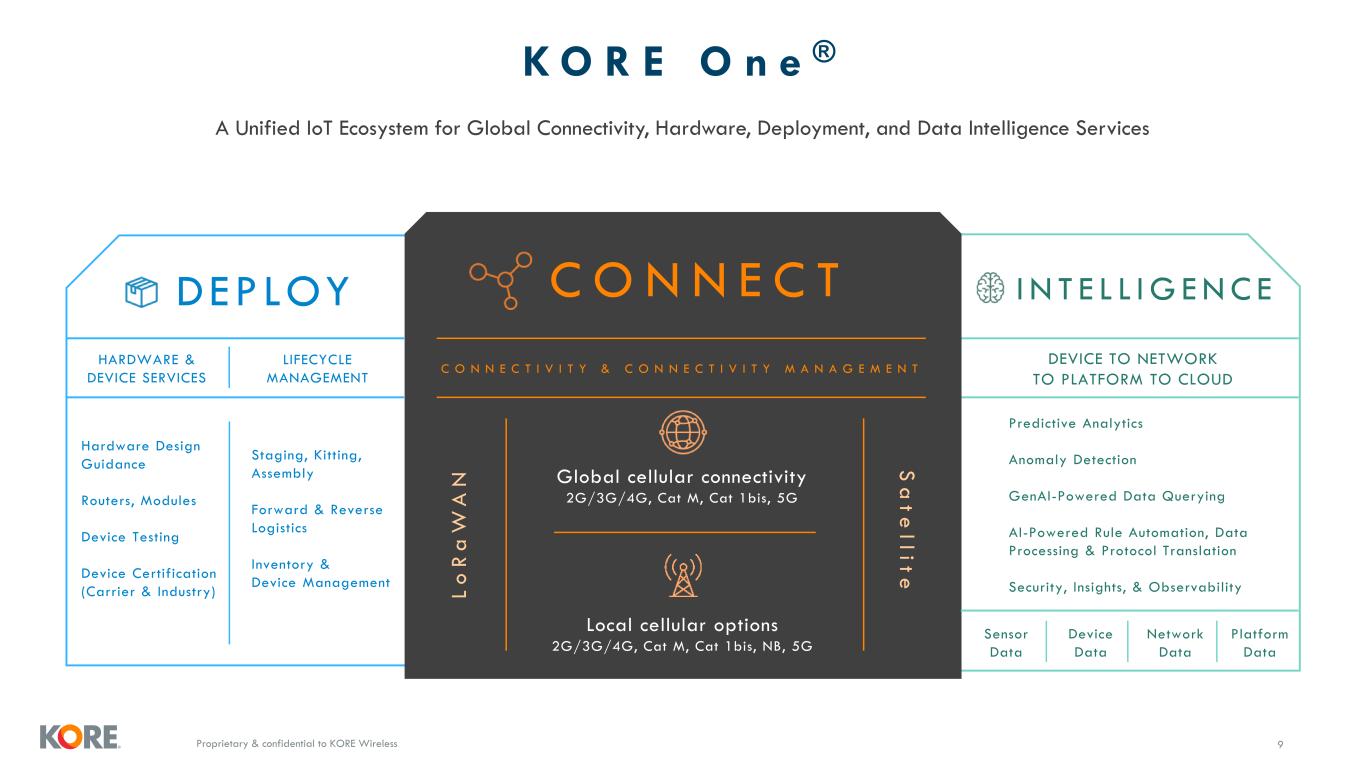
Proprietary & confidential to KORE Wireless K O R E O n e ® A Unified IoT Ecosystem for Global Connectivity, Hardware, Deployment, and Data Intelligence Services L o R a W A N S a t e l l i t e C O N N E C T I V I T Y & C O N N E C T I V I T Y M A N A G E M E N T Hardware Design Guidance Routers, Modules Device Testing Device Certification (Carrier & Industry) Staging, Kitting, Assembly Forward & Reverse Logistics Inventory & Device Management HARDWARE & DEVICE SERVICES LIFECYCLE MANAGEMENT DEVICE TO NETWORK TO PLATFORM TO CLOUD Predictive Analytics Anomaly Detection GenAI-Powered Data Querying AI-Powered Rule Automation, Data Processing & Protocol Translation Security, Insights, & Observability Sensor Data Device Data Platform Data Network Data DEPLOY I N T E L L I G E N C EC O N N E C T Local cellular options 2G/3G/4G, Cat M, Cat 1bis, NB, 5G Global cellular connectivity 2G/3G/4G, Cat M, Cat 1bis, 5G 9
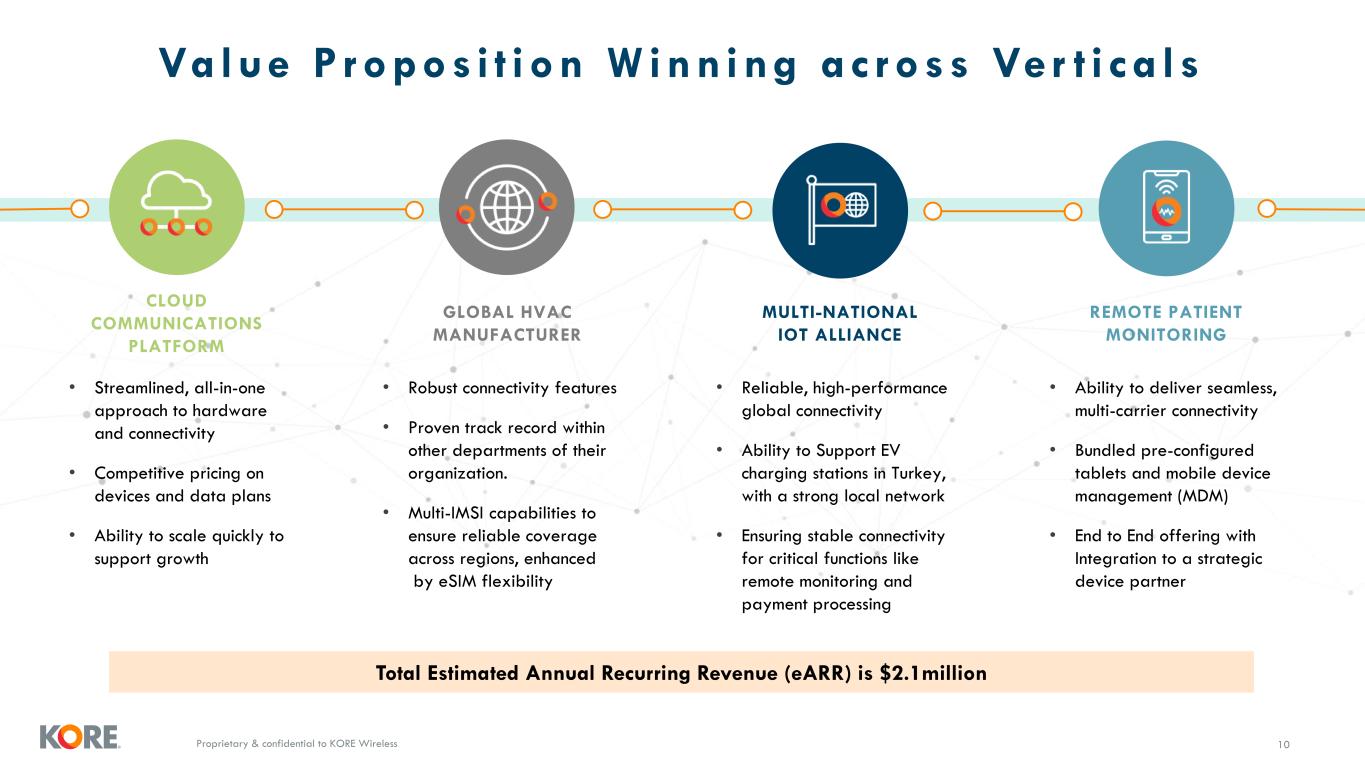
Proprietary & confidential to KORE Wireless 10 Value P ropos i t i on W inn ing ac ross Ve r t i ca l s CLOUD COMMUNICATIONS PLATFORM GLOBAL HVAC MANUFACTURER REMOTE PATIENT MONITORING MULTI-NATIONAL IOT ALLIANCE Total Estimated Annual Recurring Revenue (eARR) is $2.1million • Streamlined, all-in-one approach to hardware and connectivity • Competitive pricing on devices and data plans • Ability to scale quickly to support growth • Robust connectivity features • Proven track record within other departments of their organization. • Multi-IMSI capabilities to ensure reliable coverage across regions, enhanced by eSIM flexibility • Ability to deliver seamless, multi-carrier connectivity • Bundled pre-configured tablets and mobile device management (MDM) • End to End offering with Integration to a strategic device partner • Reliable, high-performance global connectivity • Ability to Support EV charging stations in Turkey, with a strong local network • Ensuring stable connectivity for critical functions like remote monitoring and payment processing
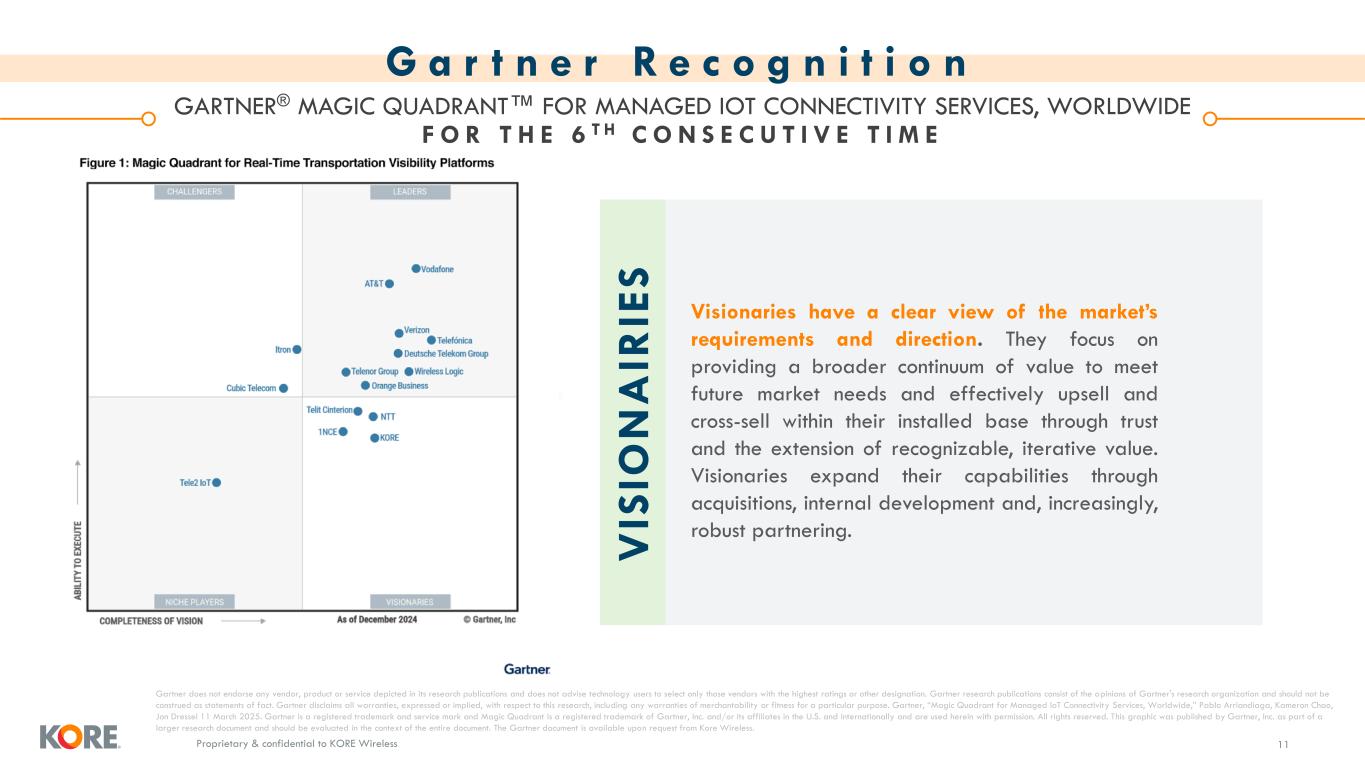
Proprietary & confidential to KORE Wireless GARTNER® MAGIC QUADRANT™ FOR MANAGED IOT CONNECTIVITY SERVICES, WORLDWIDE F O R T H E 6 T H C O N S E C U T I V E T I M E Gartner does not endorse any vendor, product or service depicted in its research publications and does not advise technology users to select only those vendors with the highest ratings or other designation. Gartner research publications consist of the opinions of Gartner's research organization and should not be construed as statements of fact. Gartner disclaims all warranties, expressed or implied, with respect to this research, including any warranties of merchantability or fitness for a particular purpose. Gartner, “Magic Quadrant for Managed IoT Connectivity Services, Worldwide,” Pablo Arriandiaga, Kameron Chao, Jon Dressel 11 March 2025. Gartner is a registered trademark and service mark and Magic Quadrant is a registered trademark of Gartner, Inc. and/or its affiliates in the U.S. and internationally and are used herein with permission. All rights reserved. This graphic was published by Gartner, Inc. as part of a larger research document and should be evaluated in the context of the entire document. The Gartner document is available upon request from Kore Wireless. V IS IO N A IR IE S Visionaries have a clear view of the market’s requirements and direction. They focus on providing a broader continuum of value to meet future market needs and effectively upsell and cross-sell within their installed base through trust and the extension of recognizable, iterative value. Visionaries expand their capabilities through acquisitions, internal development and, increasingly, robust partnering. G a r t n e r R e c o g n i t i o n 11
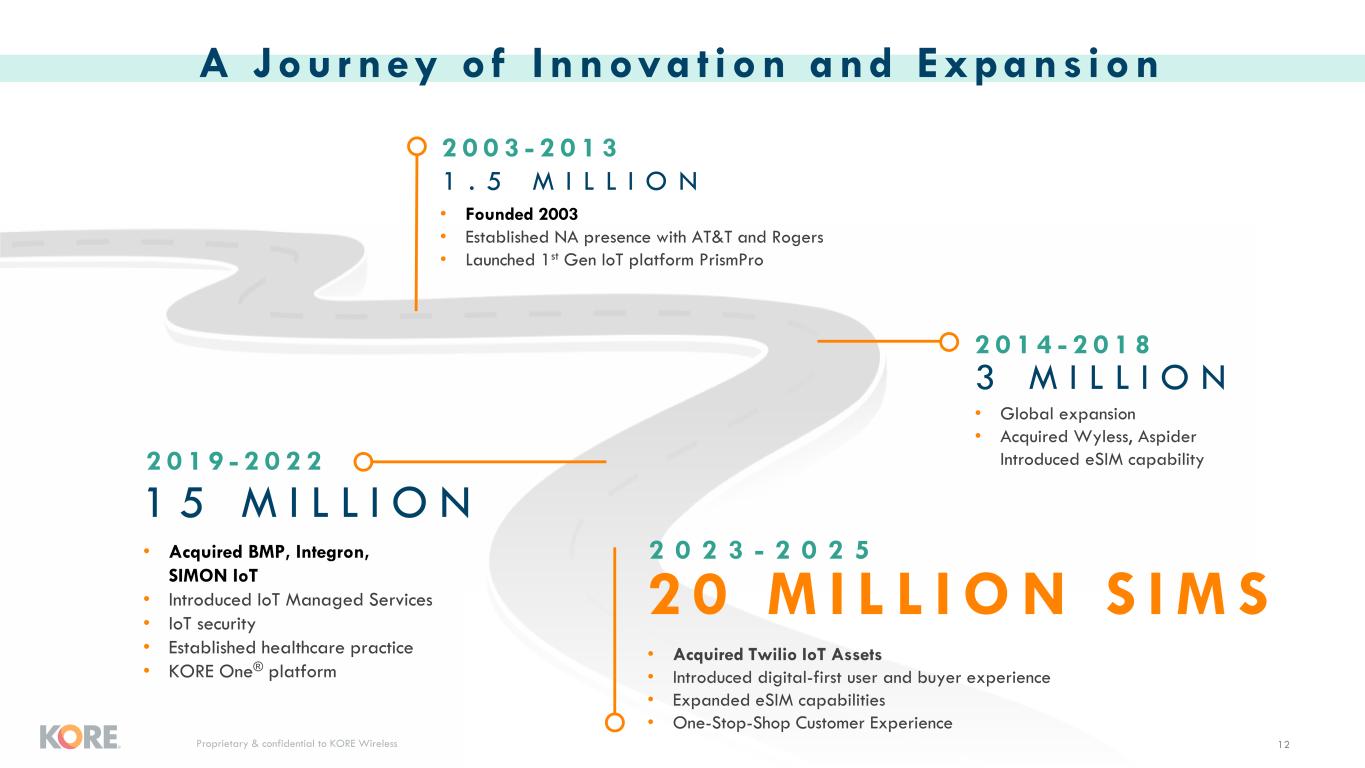
Proprietary & confidential to KORE Wireless 2 0 M I L L I O N S I M S 1 5 M I L L I O N 2 0 1 9 - 2 0 2 2 2 0 2 3 - 2 0 2 5• Acquired BMP, Integron, SIMON IoT • Introduced IoT Managed Services • IoT security • Established healthcare practice • KORE One® platform • Acquired Twilio IoT Assets • Introduced digital-first user and buyer experience • Expanded eSIM capabilities • One-Stop-Shop Customer Experience 1 . 5 M I L L I O N 2 0 0 3 - 2 0 1 3 • Founded 2003 • Established NA presence with AT&T and Rogers • Launched 1st Gen IoT platform PrismPro 3 M I L L I O N 2 0 1 4 - 2 0 1 8 • Global expansion • Acquired Wyless, Aspider Introduced eSIM capability A Journey o f I nnova t ion and Expans ion 12

Proprietary & confidential to KORE Wireless 13 13 2024 and 1Q 2025 Business Update
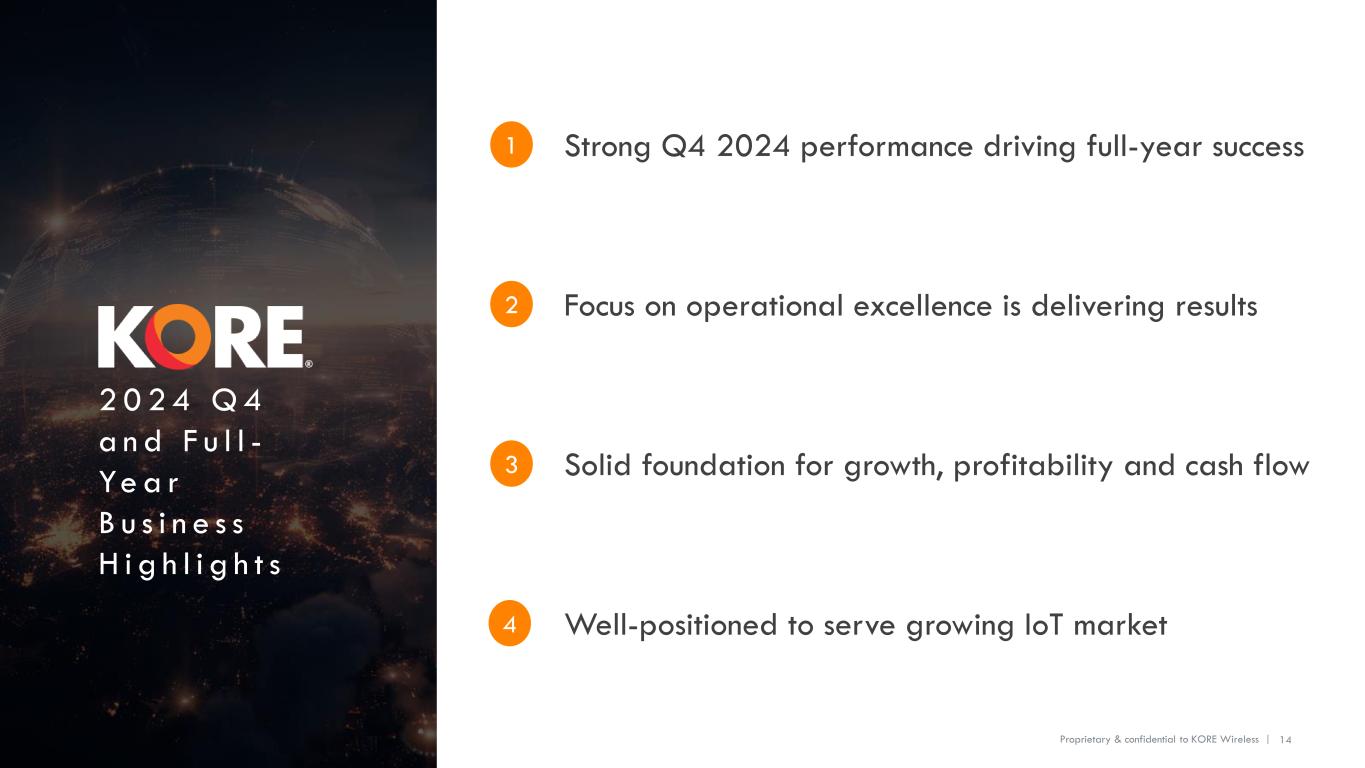
Proprietary & confidential to KORE Wireless Proprietary & confidential to KORE Wireless | 2 0 2 4 Q 4 a n d F u l l - Ye a r B u s i n e s s H i g h l i g h t s 14 Strong Q4 2024 performance driving full-year success1 2 Focus on operational excellence is delivering results 3 Solid foundation for growth, profitability and cash flow 4 Well-positioned to serve growing IoT market
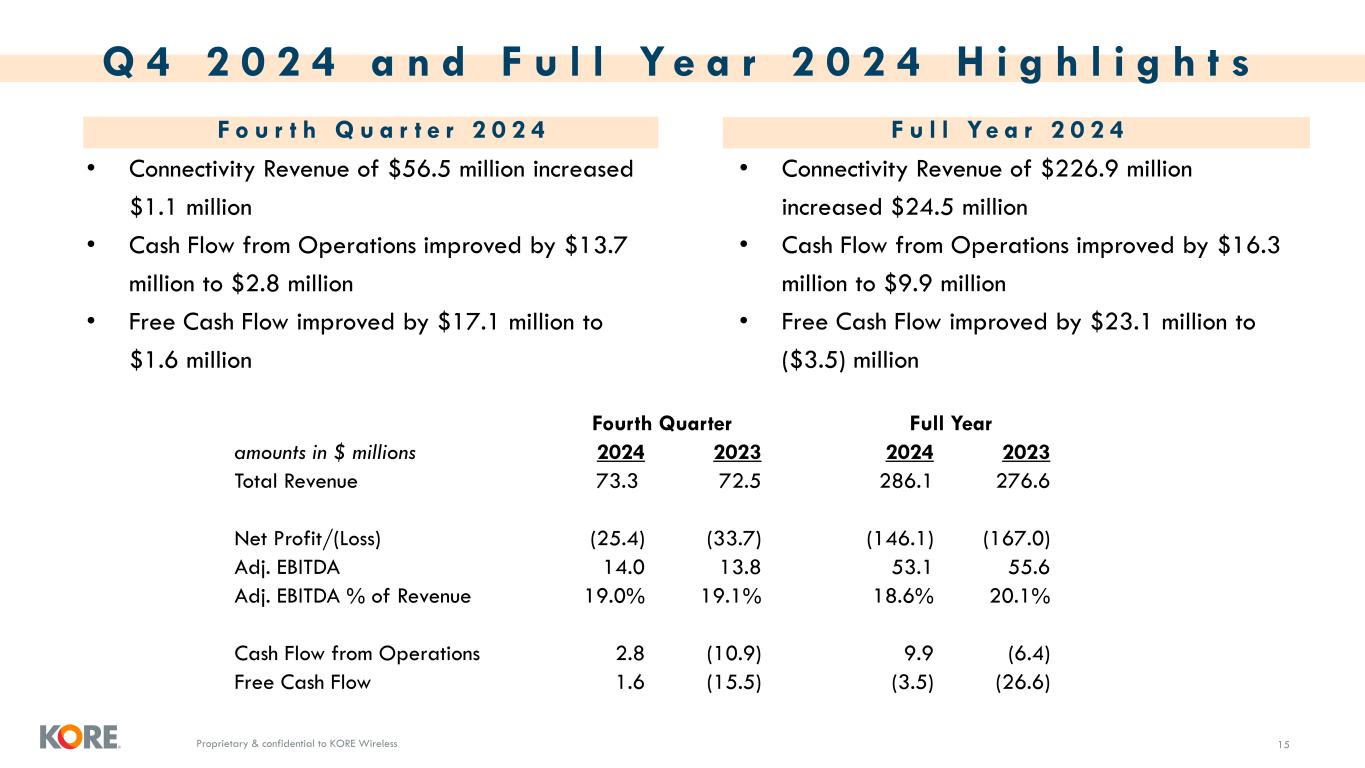
Proprietary & confidential to KORE Wireless 15 Q 4 2 0 2 4 a n d F u l l Y e a r 2 0 2 4 H i g h l i g h t s F o u r t h Q u a r t e r 2 0 2 4 F u l l Ye a r 2 0 2 4 • Connectivity Revenue of $56.5 million increased $1.1 million • Cash Flow from Operations improved by $13.7 million to $2.8 million • Free Cash Flow improved by $17.1 million to $1.6 million • Connectivity Revenue of $226.9 million increased $24.5 million • Cash Flow from Operations improved by $16.3 million to $9.9 million • Free Cash Flow improved by $23.1 million to ($3.5) million Fourth Quarter Full Year amounts in $ millions 2024 2023 2024 2023 Total Revenue 73.3 72.5 286.1 276.6 Net Profit/(Loss) (25.4) (33.7) (146.1) (167.0) Adj. EBITDA 14.0 13.8 53.1 55.6 Adj. EBITDA % of Revenue 19.0% 19.1% 18.6% 20.1% Cash Flow from Operations 2.8 (10.9) 9.9 (6.4) Free Cash Flow 1.6 (15.5) (3.5) (26.6)
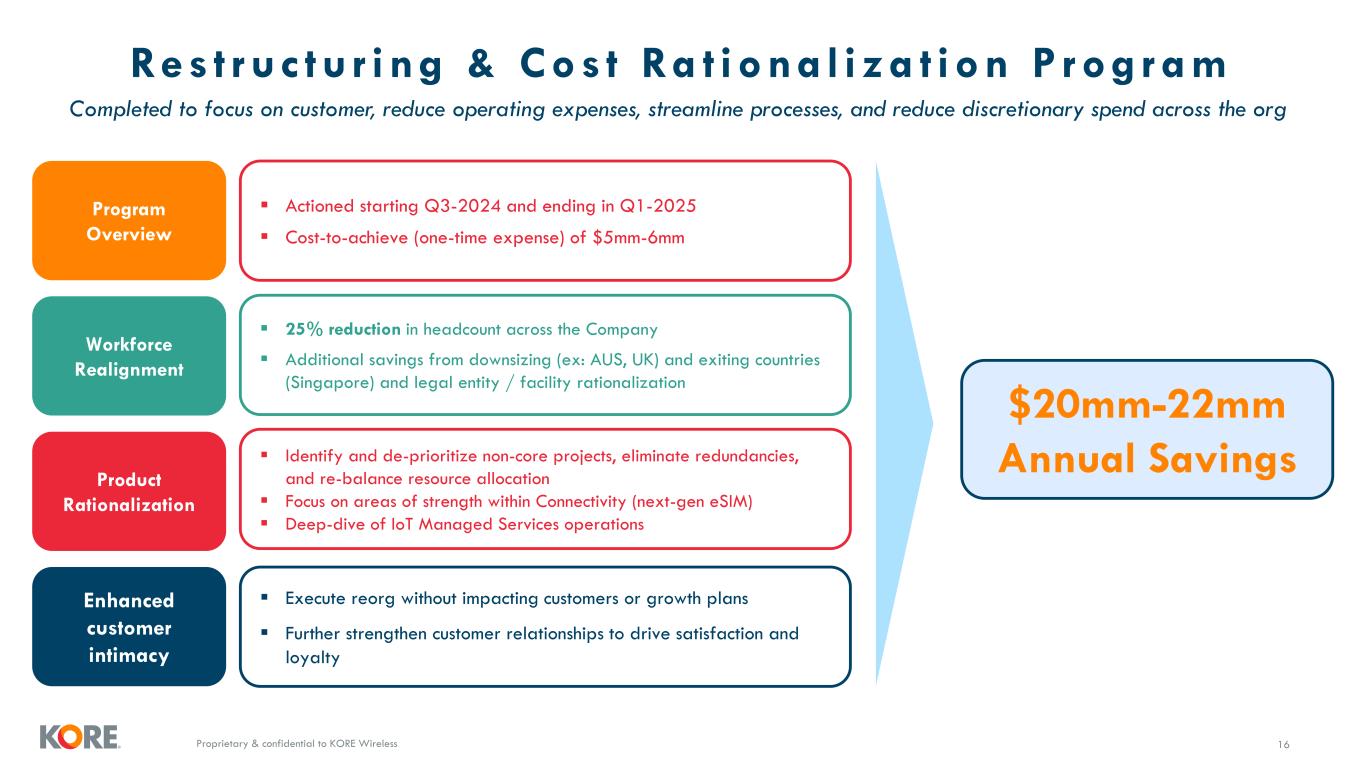
Proprietary & confidential to KORE Wireless Res t ruc tu r ing & Cos t Ra t iona l i za t ion P rog ram 16 Program Overview Workforce Realignment Product Rationalization ▪ Actioned starting Q3-2024 and ending in Q1-2025 ▪ Cost-to-achieve (one-time expense) of $5mm-6mm ▪ 25% reduction in headcount across the Company ▪ Additional savings from downsizing (ex: AUS, UK) and exiting countries (Singapore) and legal entity / facility rationalization ▪ Identify and de-prioritize non-core projects, eliminate redundancies, and re-balance resource allocation ▪ Focus on areas of strength within Connectivity (next-gen eSIM) ▪ Deep-dive of IoT Managed Services operations Enhanced customer intimacy ▪ Execute reorg without impacting customers or growth plans ▪ Further strengthen customer relationships to drive satisfaction and loyalty $20mm-22mm Annual Savings Completed to focus on customer, reduce operating expenses, streamline processes, and reduce discretionary spend across the org
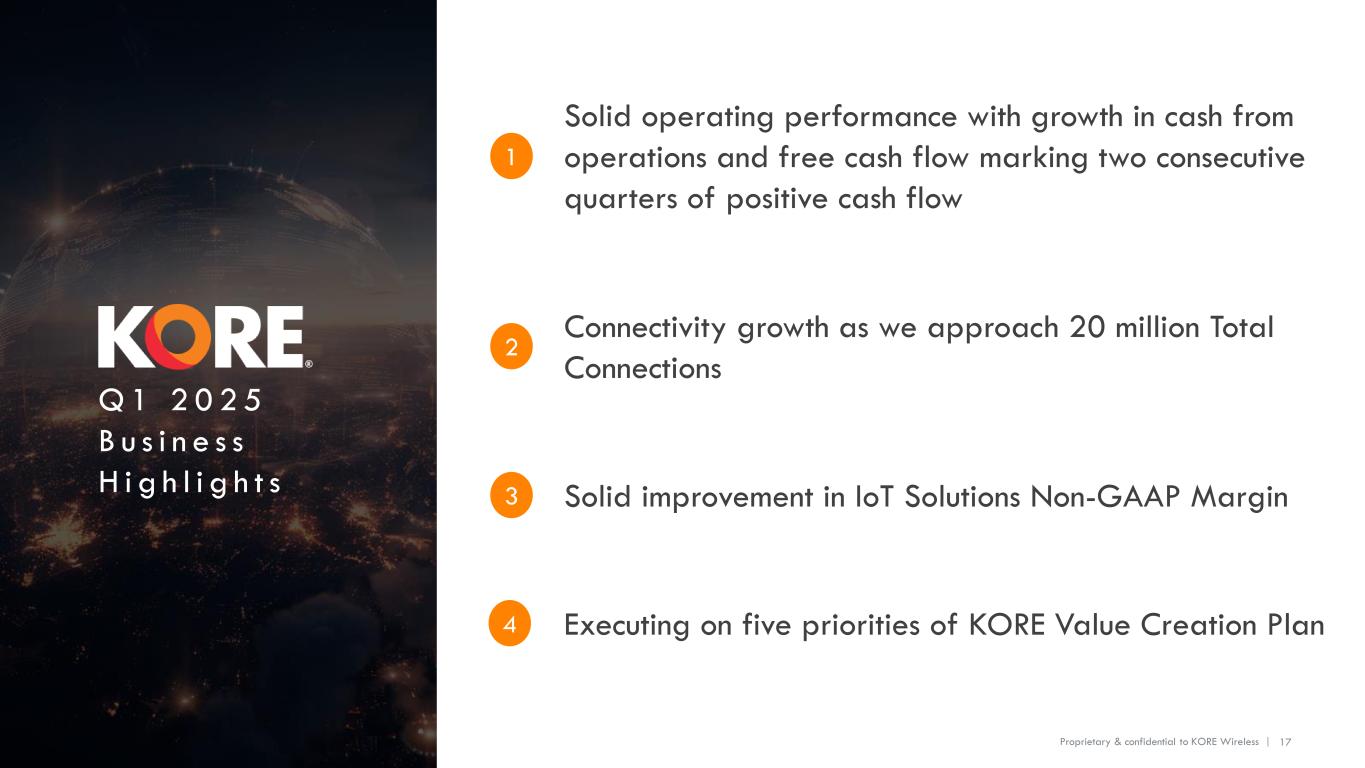
Proprietary & confidential to KORE Wireless Proprietary & confidential to KORE Wireless | Q 1 2 0 2 5 B u s i n e s s H i g h l i g h t s 17 Solid operating performance with growth in cash from operations and free cash flow marking two consecutive quarters of positive cash flow 1 2 Connectivity growth as we approach 20 million Total Connections 3 Solid improvement in IoT Solutions Non-GAAP Margin 4 Executing on five priorities of KORE Value Creation Plan
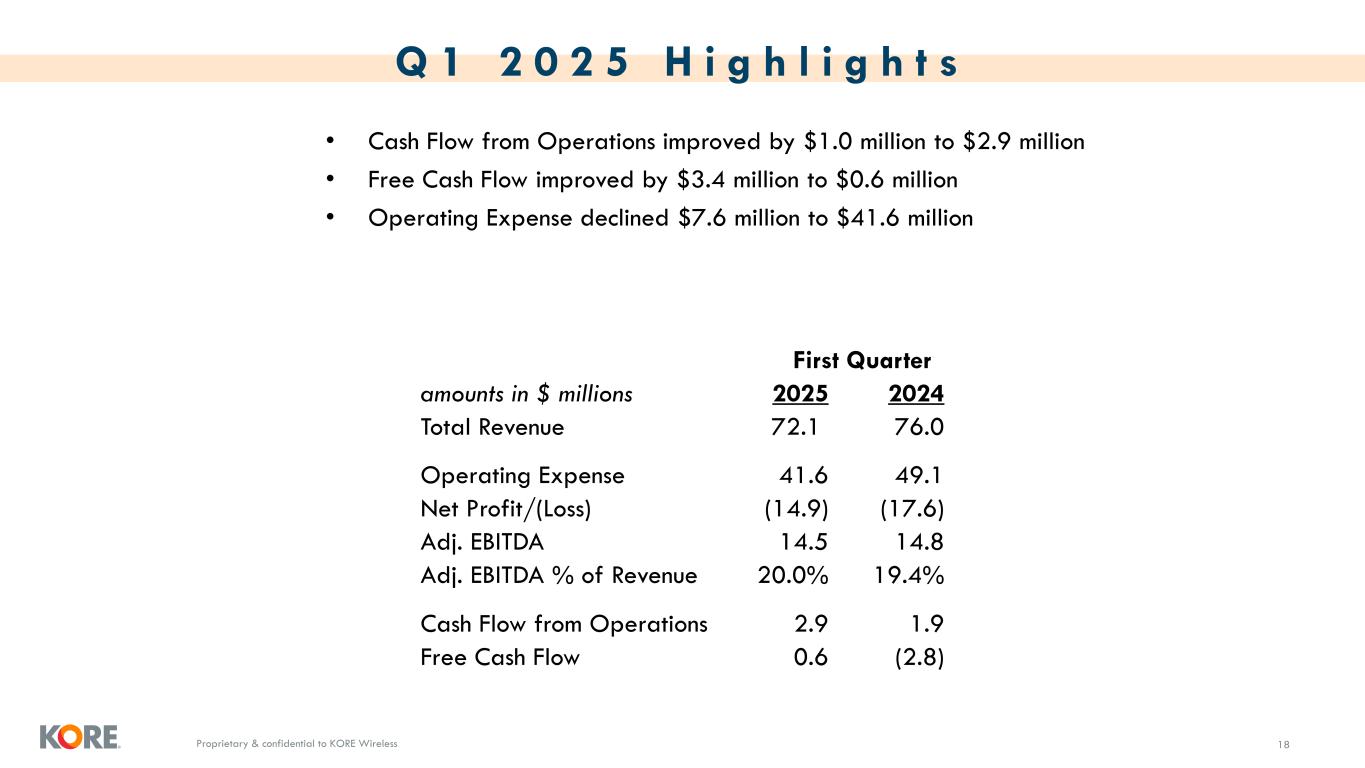
Proprietary & confidential to KORE Wireless 18 Q 1 2 0 2 5 H i g h l i g h t s • Cash Flow from Operations improved by $1.0 million to $2.9 million • Free Cash Flow improved by $3.4 million to $0.6 million • Operating Expense declined $7.6 million to $41.6 million First Quarter amounts in $ millions 2025 2024 Total Revenue 72.1 76.0 Operating Expense 41.6 49.1 Net Profit/(Loss) (14.9) (17.6) Adj. EBITDA 14.5 14.8 Adj. EBITDA % of Revenue 20.0% 19.4% Cash Flow from Operations 2.9 1.9 Free Cash Flow 0.6 (2.8)
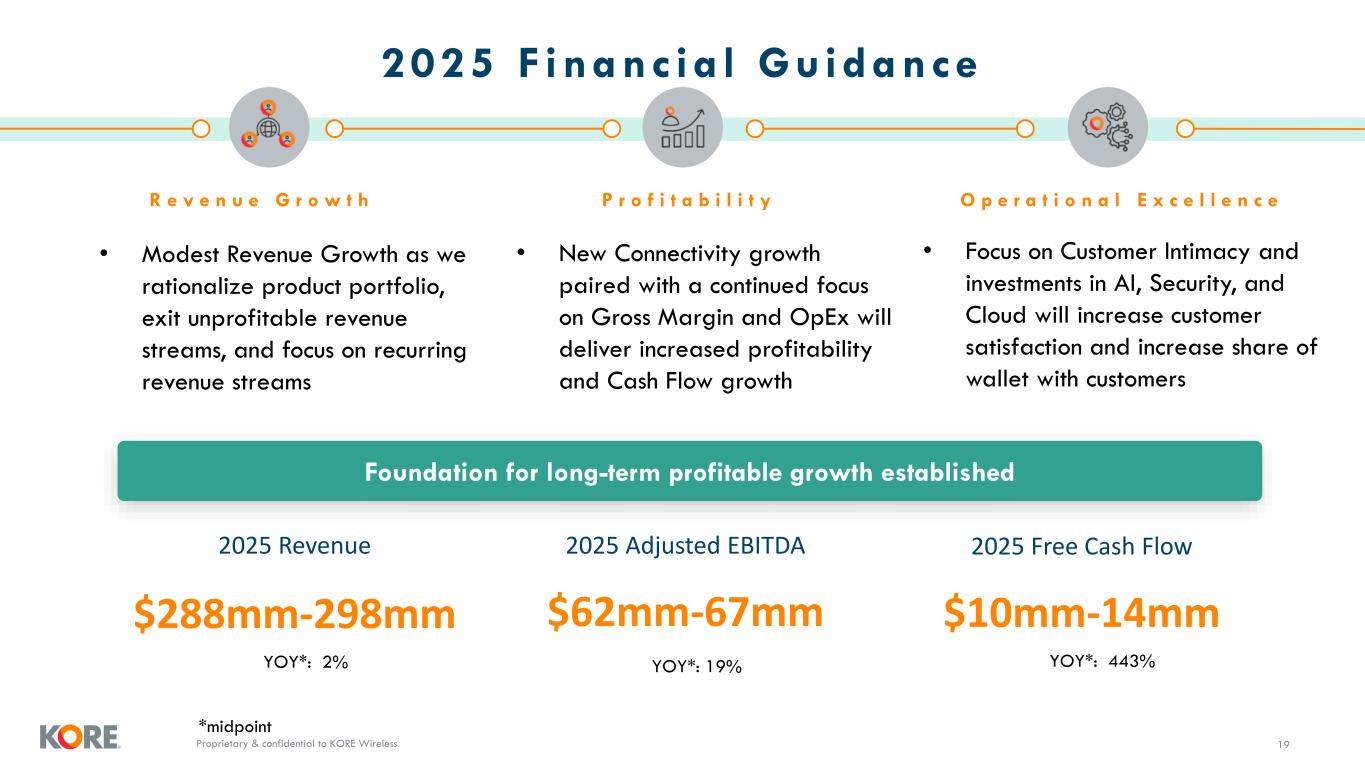
Proprietary & confidential to KORE Wireless 2025 F inanc ia l Gu idance Foundation for long-term profitable growth established $288mm-298mm $62mm-67mm 2025 Revenue 2025 Adjusted EBITDA 19 10 R e v e n u e G r o w t h P r o f i t a b i l i t y O p e r a t i o n a l E x c e l l e n c e • Modest Revenue Growth as we rationalize product portfolio, exit unprofitable revenue streams, and focus on recurring revenue streams • New Connectivity growth paired with a continued focus on Gross Margin and OpEx will deliver increased profitability and Cash Flow growth • Focus on Customer Intimacy and investments in AI, Security, and Cloud will increase customer satisfaction and increase share of wallet with customers $10mm-14mm 2025 Free Cash Flow YOY*: 2% YOY*: 19% YOY*: 443% *midpoint

Proprietary & confidential to KORE Wireless 20 20 VALUE CREATION
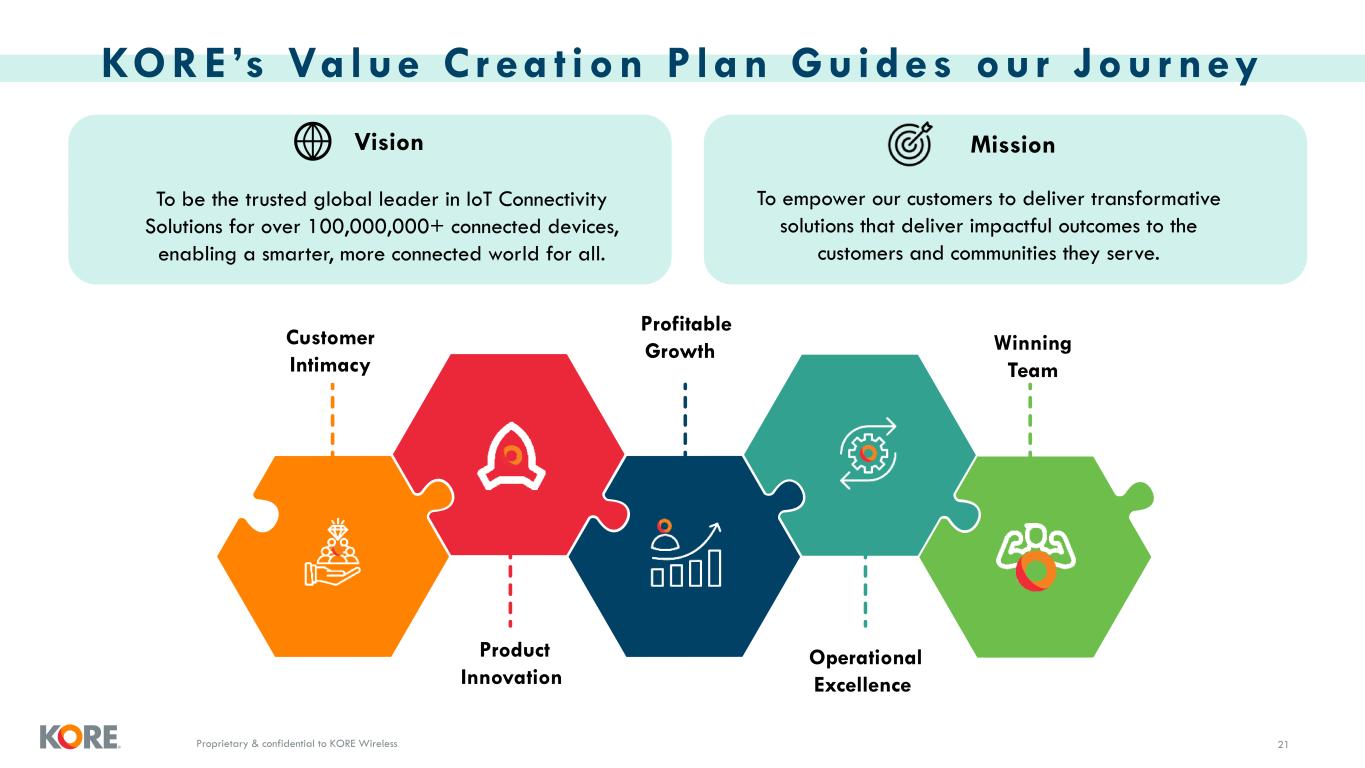
Proprietary & confidential to KORE Wireless KORE ’s Va lue C r ea t ion P lan Gu ides ou r Jou r ney Customer Intimacy Profitable Growth Winning Team Product Innovation Operational Excellence 21 Vision To be the trusted global leader in IoT Connectivity Solutions for over 100,000,000+ connected devices, enabling a smarter, more connected world for all. To empower our customers to deliver transformative solutions that deliver impactful outcomes to the customers and communities they serve. Mission
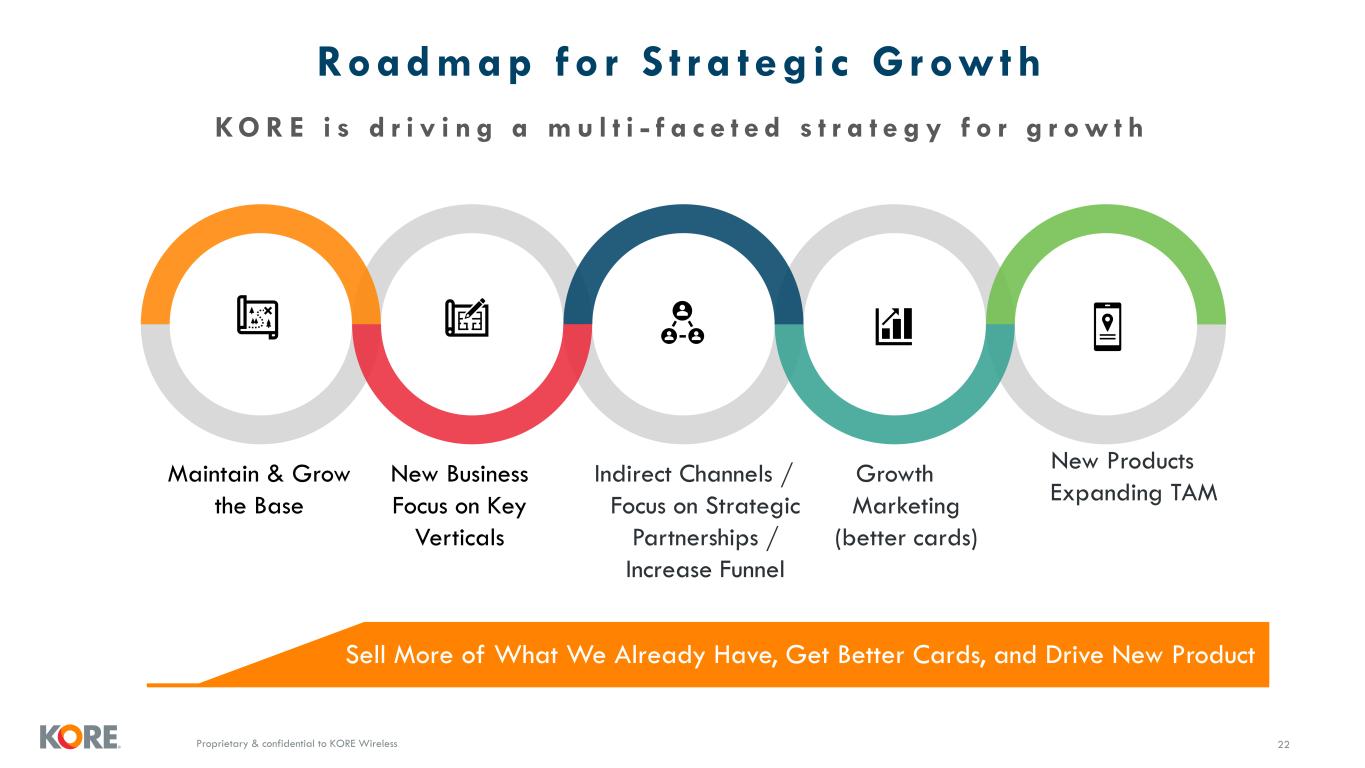
Proprietary & confidential to KORE Wireless Growth Marketing (better cards) New Products Expanding TAM Indirect Channels / Focus on Strategic Partnerships / Increase Funnel Sell More of What We Already Have, Get Better Cards, and Drive New Product Roadmap fo r S t r a t e g i c G rowth KO R E i s d r i v i n g a m u l t i - f a c e t e d s t r a t e g y f o r g r o w t h Maintain & Grow the Base New Business Focus on Key Verticals 22
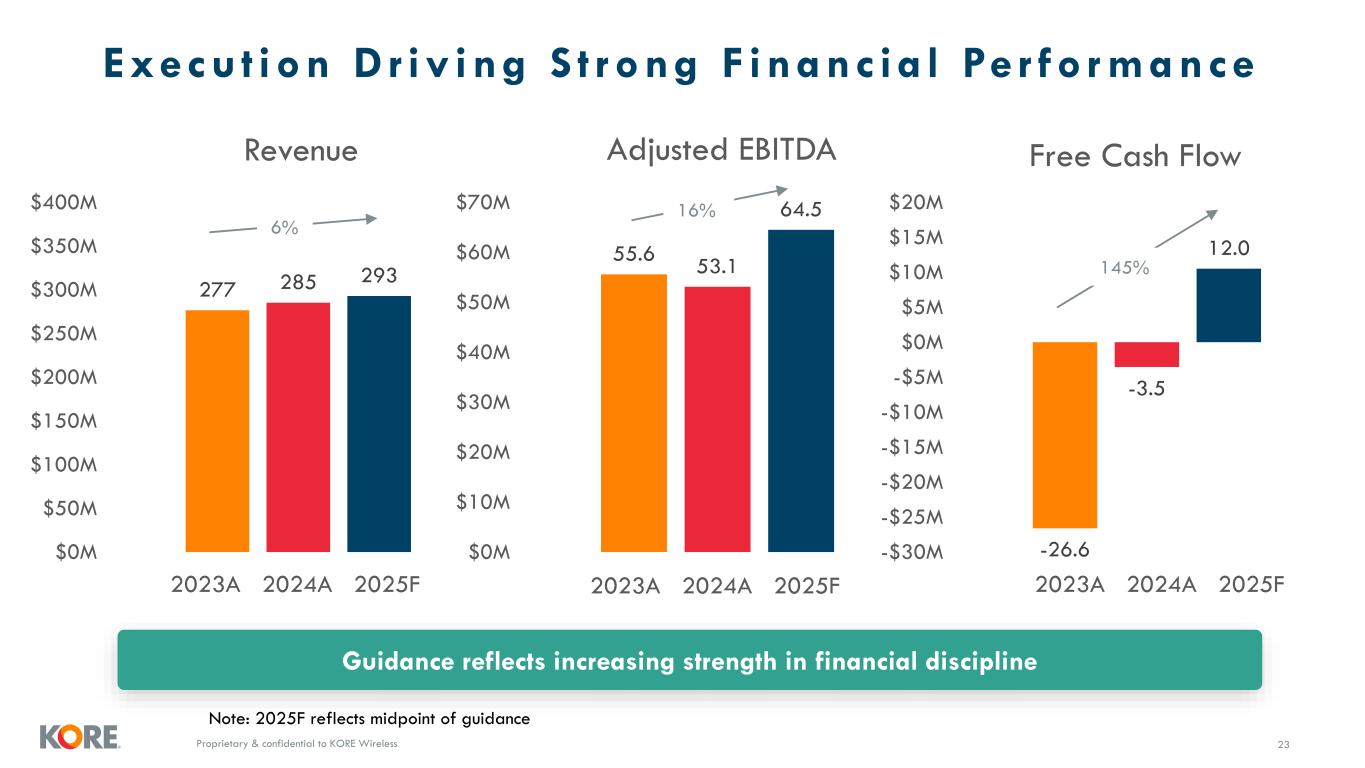
Proprietary & confidential to KORE Wireless Execu t ion D r iv ing S t rong F inanc ia l Pe r fo r mance Guidance reflects increasing strength in financial discipline 23 Note: 2025F reflects midpoint of guidance 277 285 293 $0M $50M $100M $150M $200M $250M $300M $350M $400M 2023A 2024A 2025F Revenue 55.6 53.1 64.5 $0M $10M $20M $30M $40M $50M $60M $70M 2023A 2024A 2025F Adjusted EBITDA -26.6 -3.5 12.0 -$30M -$25M -$20M -$15M -$10M -$5M $0M $5M $10M $15M $20M 2023A 2024A 2025F Free Cash Flow 6% 16% 145%
Proprietary & confidential to KORE Wireless KORE Inves tmen t H igh l igh t s 24 1. Expansive Market Opportunity - eSIM and IoT markets are accelerating, with 34%+ CAGR expected through 2030 and 96B+ connected devices projected globally. 2. Established Market Leadership - KORE is a globally recognized IoT enabler, operating in 180+ countries with 20M connections and featured in Gartner's Magic Quadrant six years running. 3. Restructured for Scalable Growth - Recent operational restructuring has streamlined costs and processes, and positioning KORE for sustainable expansion. 4. Focused Value Creation Plan - Strategic priorities include customer-centricity, innovation, and operational excellence to drive profitable growth and competitive differentiation. 5. Strengthening Cash Flow - Continuing positive momentum in cash flow allowing greater financial flexibility

Proprietary & confidential to KORE Wireless 25 APPENDIX
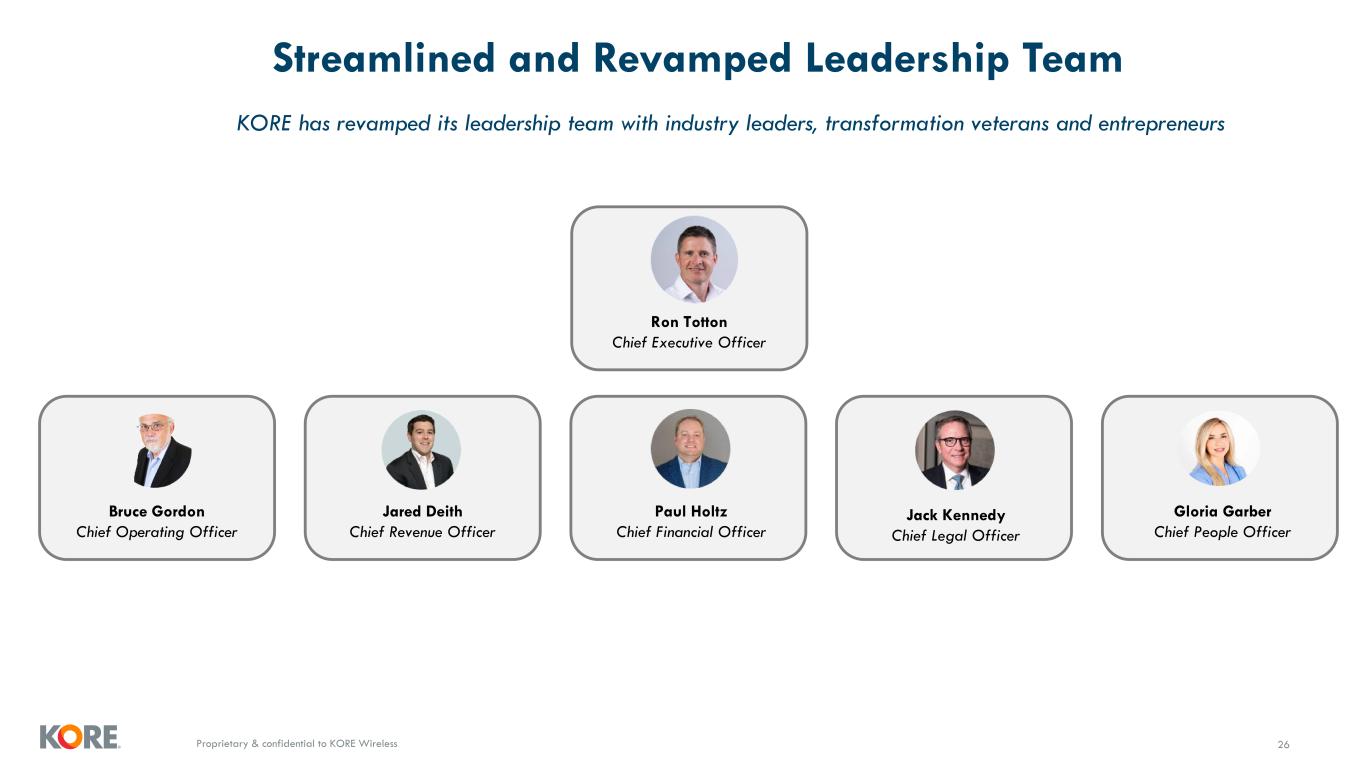
Proprietary & confidential to KORE Wireless Streamlined and Revamped Leadership Team 26 KORE has revamped its leadership team with industry leaders, transformation veterans and entrepreneurs Paul Holtz Chief Financial Officer Jack Kennedy Chief Legal Officer Bruce Gordon Chief Operating Officer Jared Deith Chief Revenue Officer Gloria Garber Chief People Officer Ron Totton Chief Executive Officer
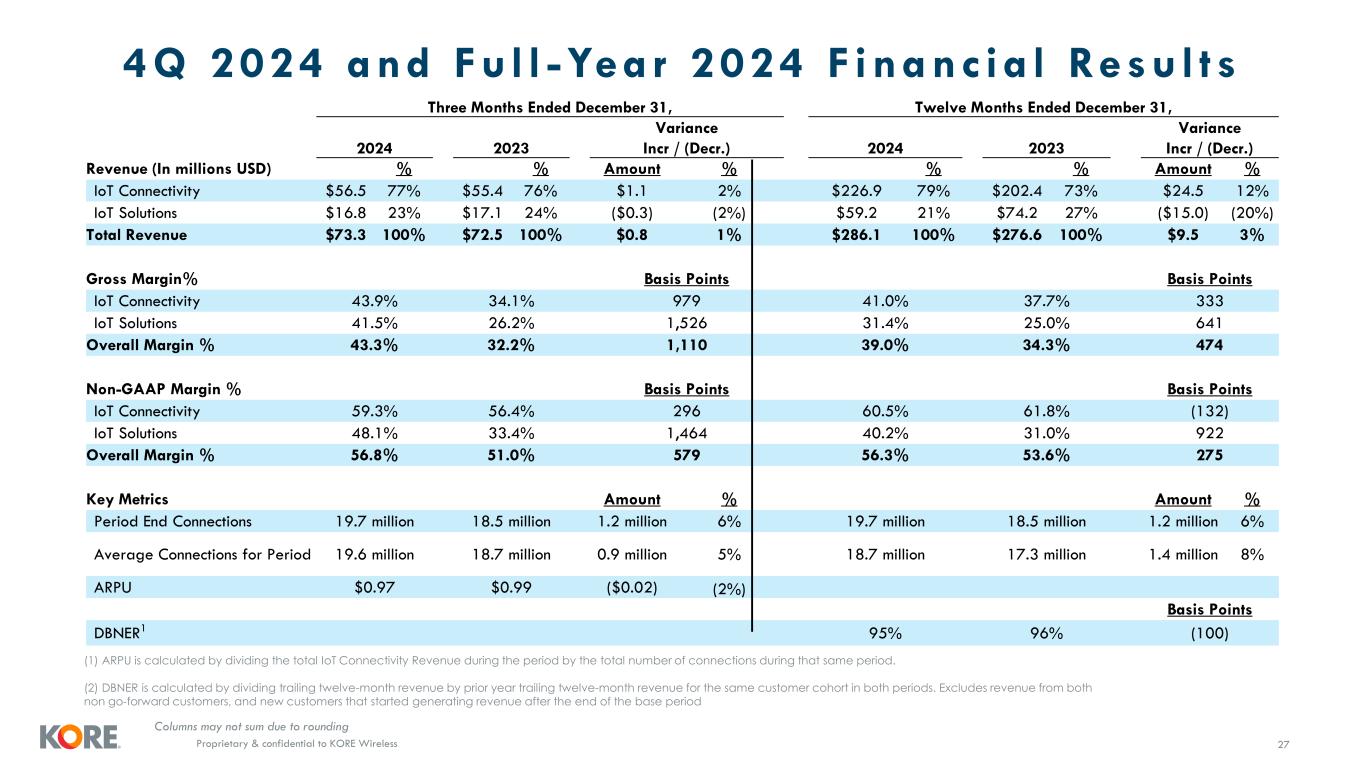
Proprietary & confidential to KORE Wireless 4Q 2024 and Fu l l -Yea r 2024 F inanc ia l Resu l t s 27 (1) ARPU is calculated by dividing the total IoT Connectivity Revenue during the period by the total number of connections during that same period. (2) DBNER is calculated by dividing trailing twelve-month revenue by prior year trailing twelve-month revenue for the same customer cohort in both periods. Excludes revenue from both non go-forward customers, and new customers that started generating revenue after the end of the base period Columns may not sum due to rounding Three Months Ended December 31, Twelve Months Ended December 31, 2024 2023 Variance Incr / (Decr.) 2024 2023 Variance Incr / (Decr.) Revenue (In millions USD) % % Amount % % % Amount % IoT Connectivity $56.5 77% $55.4 76% $1.1 2% $226.9 79% $202.4 73% $24.5 12% IoT Solutions $16.8 23% $17.1 24% ($0.3) (2%) $59.2 21% $74.2 27% ($15.0) (20%) Total Revenue $73.3 100% $72.5 100% $0.8 1% $286.1 100% $276.6 100% $9.5 3% Gross Margin% Basis Points Basis Points IoT Connectivity 43.9% 34.1% 979 41.0% 37.7% 333 IoT Solutions 41.5% 26.2% 1,526 31.4% 25.0% 641 Overall Margin % 43.3% 32.2% 1,110 39.0% 34.3% 474 Non-GAAP Margin % Basis Points Basis Points IoT Connectivity 59.3% 56.4% 296 60.5% 61.8% (132) IoT Solutions 48.1% 33.4% 1,464 40.2% 31.0% 922 Overall Margin % 56.8% 51.0% 579 56.3% 53.6% 275 Key Metrics Amount % Amount % Period End Connections 19.7 million 18.5 million 1.2 million 6% 19.7 million 18.5 million 1.2 million 6% Average Connections for Period 19.6 million 18.7 million 0.9 million 5% 18.7 million 17.3 million 1.4 million 8% ARPU $0.97 $0.99 ($0.02) (2%) Basis Points DBNER1 95% 96% (100)
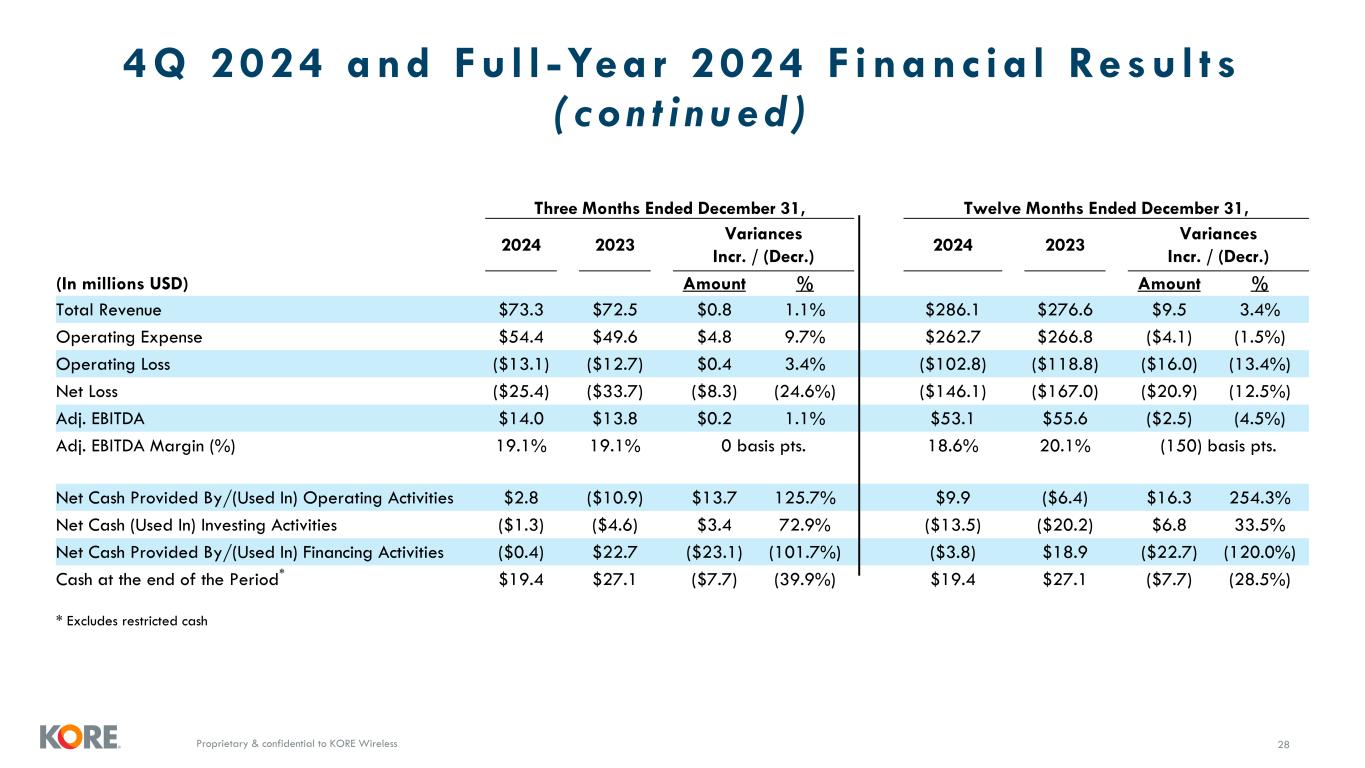
Proprietary & confidential to KORE Wireless 4Q 2024 and Fu l l -Yea r 2024 F inanc ia l Resu l t s ( con t i n ued ) 28 Three Months Ended December 31, Twelve Months Ended December 31, 2024 2023 Variances Incr. / (Decr.) 2024 2023 Variances Incr. / (Decr.) (In millions USD) Amount % Amount % Total Revenue $73.3 $72.5 $0.8 1.1% $286.1 $276.6 $9.5 3.4% Operating Expense $54.4 $49.6 $4.8 9.7% $262.7 $266.8 ($4.1) (1.5%) Operating Loss ($13.1) ($12.7) $0.4 3.4% ($102.8) ($118.8) ($16.0) (13.4%) Net Loss ($25.4) ($33.7) ($8.3) (24.6%) ($146.1) ($167.0) ($20.9) (12.5%) Adj. EBITDA $14.0 $13.8 $0.2 1.1% $53.1 $55.6 ($2.5) (4.5%) Adj. EBITDA Margin (%) 19.1% 19.1% 0 basis pts. 18.6% 20.1% (150) basis pts. Net Cash Provided By/(Used In) Operating Activities $2.8 ($10.9) $13.7 125.7% $9.9 ($6.4) $16.3 254.3% Net Cash (Used In) Investing Activities ($1.3) ($4.6) $3.4 72.9% ($13.5) ($20.2) $6.8 33.5% Net Cash Provided By/(Used In) Financing Activities ($0.4) $22.7 ($23.1) (101.7%) ($3.8) $18.9 ($22.7) (120.0%) Cash at the end of the Period* $19.4 $27.1 ($7.7) (39.9%) $19.4 $27.1 ($7.7) (28.5%) * Excludes restricted cash
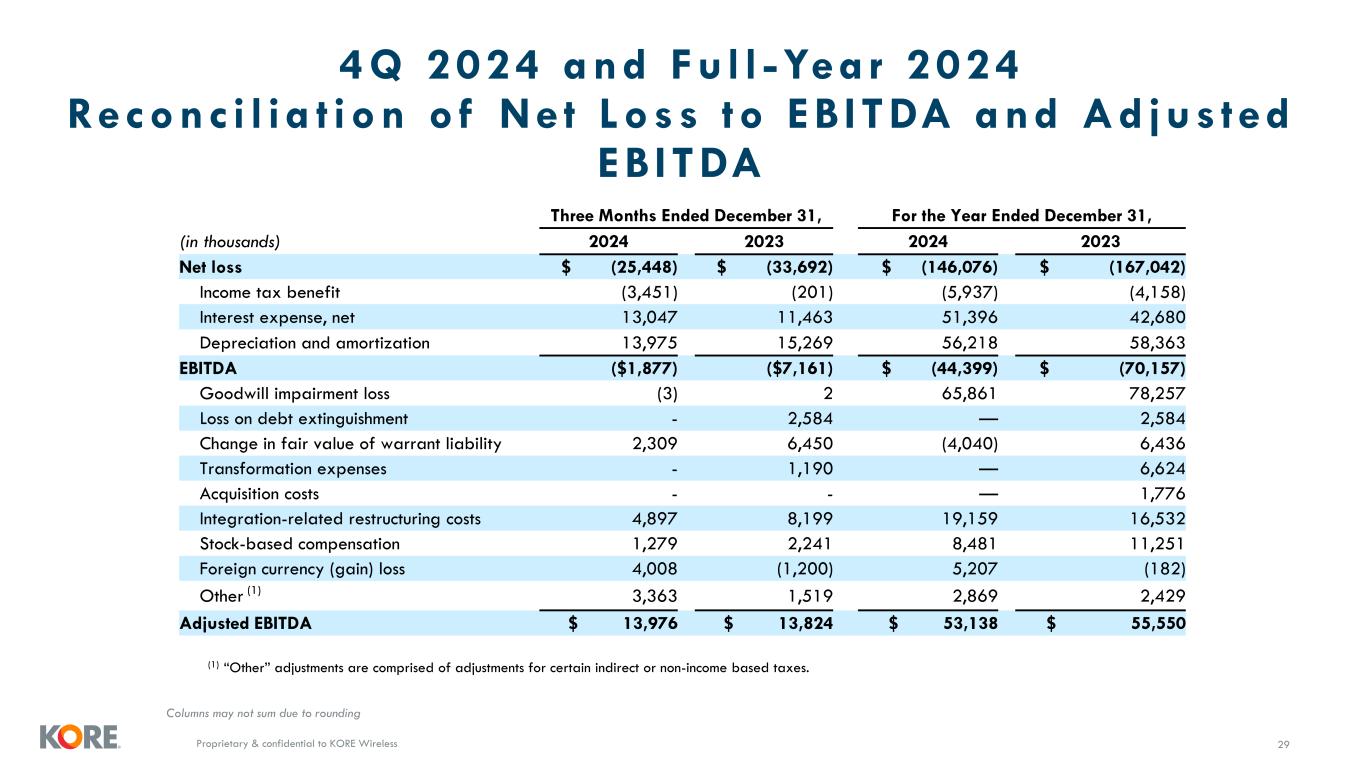
Proprietary & confidential to KORE Wireless 4Q 2024 and Fu l l -Yea r 2024 Reconc i l i a t ion o f Ne t Loss to EB ITDA and Ad jus ted EB ITDA 29 Columns may not sum due to rounding (1) “Other” adjustments are comprised of adjustments for certain indirect or non-income based taxes. Three Months Ended December 31, For the Year Ended December 31, (in thousands) 2024 2023 2024 2023 Net loss $ (25,448) $ (33,692) $ (146,076) $ (167,042) Income tax benefit (3,451) (201) (5,937) (4,158) Interest expense, net 13,047 11,463 51,396 42,680 Depreciation and amortization 13,975 15,269 56,218 58,363 EBITDA ($1,877) ($7,161) $ (44,399) $ (70,157) Goodwill impairment loss (3) 2 65,861 78,257 Loss on debt extinguishment - 2,584 — 2,584 Change in fair value of warrant liability 2,309 6,450 (4,040) 6,436 Transformation expenses - 1,190 — 6,624 Acquisition costs - - — 1,776 Integration-related restructuring costs 4,897 8,199 19,159 16,532 Stock-based compensation 1,279 2,241 8,481 11,251 Foreign currency (gain) loss 4,008 (1,200) 5,207 (182) Other (1) 3,363 1,519 2,869 2,429 Adjusted EBITDA $ 13,976 $ 13,824 $ 53,138 $ 55,550
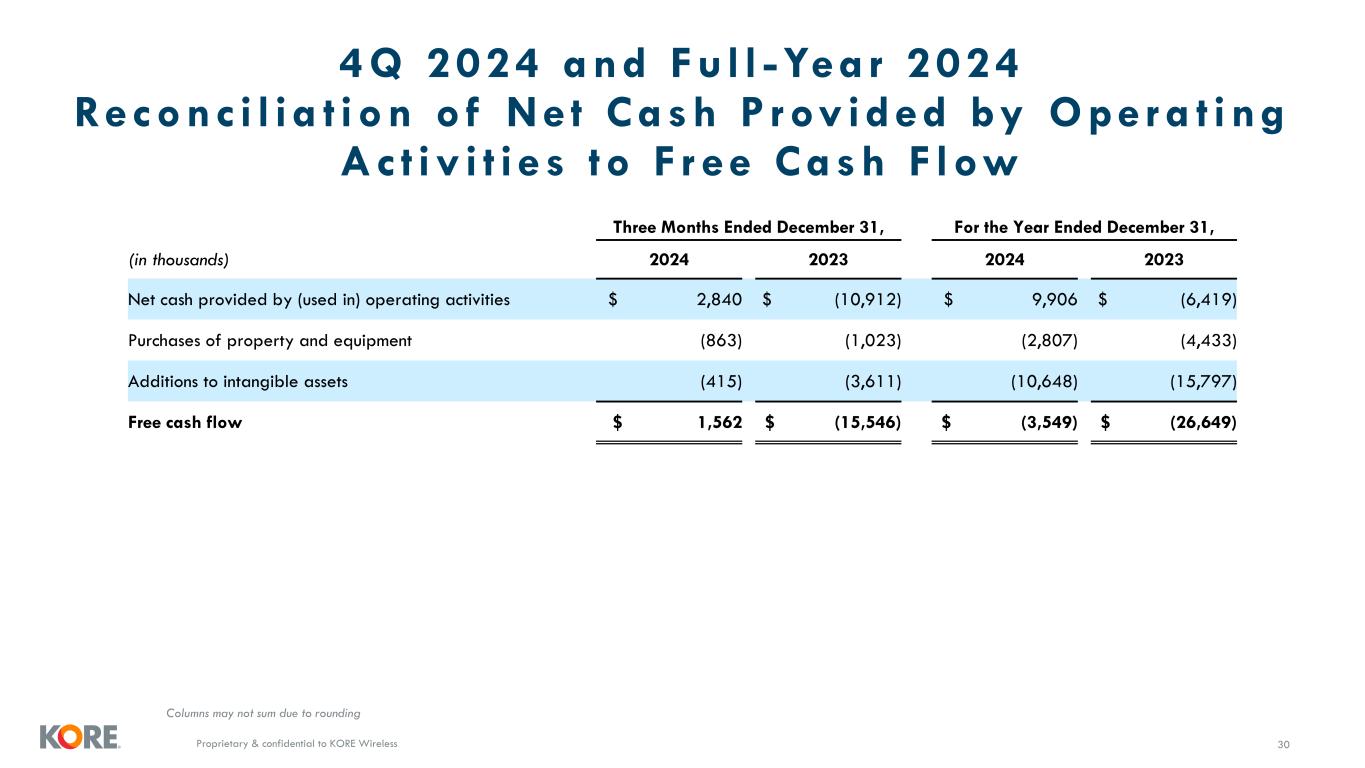
Proprietary & confidential to KORE Wireless 4Q 2024 and Fu l l -Yea r 2024 Reconc i l i a t ion o f Ne t Cash P rov ided by Oper a t ing Ac t iv i t i e s to F r ee Cash F low 30 Columns may not sum due to rounding Three Months Ended December 31, For the Year Ended December 31, (in thousands) 2024 2023 2024 2023 Net cash provided by (used in) operating activities $ 2,840 $ (10,912) $ 9,906 $ (6,419) Purchases of property and equipment (863) (1,023) (2,807) (4,433) Additions to intangible assets (415) (3,611) (10,648) (15,797) Free cash flow $ 1,562 $ (15,546) $ (3,549) $ (26,649)
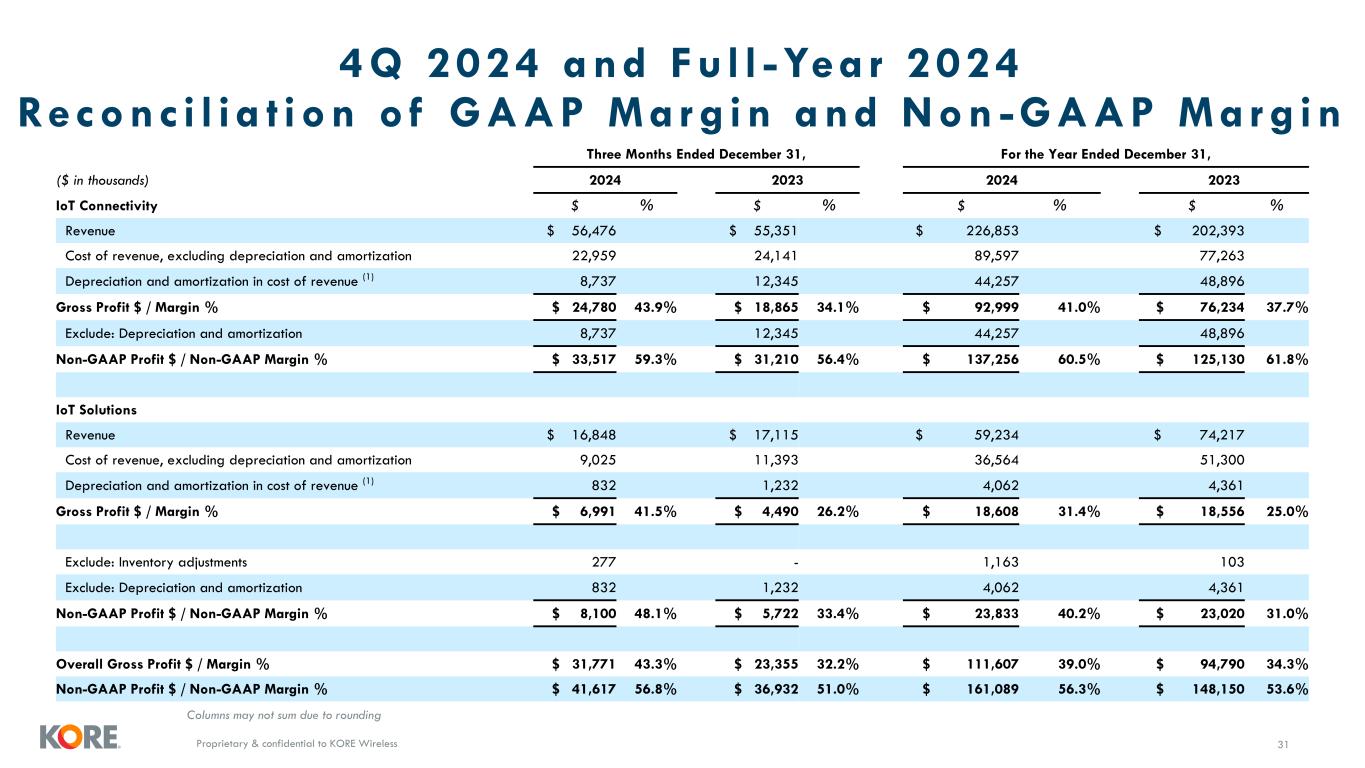
Proprietary & confidential to KORE Wireless 4Q 2024 and Fu l l -Yea r 2024 Reconc i l i a t ion o f GAAP Mar g in and Non -GAAP Mar g in 31 Columns may not sum due to rounding Three Months Ended December 31, For the Year Ended December 31, ($ in thousands) 2024 2023 2024 2023 IoT Connectivity $ % $ % $ % $ % Revenue $ 56,476 $ 55,351 $ 226,853 $ 202,393 Cost of revenue, excluding depreciation and amortization 22,959 24,141 89,597 77,263 Depreciation and amortization in cost of revenue (1) 8,737 12,345 44,257 48,896 Gross Profit $ / Margin % $ 24,780 43.9% $ 18,865 34.1% $ 92,999 41.0% $ 76,234 37.7% Exclude: Depreciation and amortization 8,737 12,345 44,257 48,896 Non-GAAP Profit $ / Non-GAAP Margin % $ 33,517 59.3% $ 31,210 56.4% $ 137,256 60.5% $ 125,130 61.8% IoT Solutions Revenue $ 16,848 $ 17,115 $ 59,234 $ 74,217 Cost of revenue, excluding depreciation and amortization 9,025 11,393 36,564 51,300 Depreciation and amortization in cost of revenue (1) 832 1,232 4,062 4,361 Gross Profit $ / Margin % $ 6,991 41.5% $ 4,490 26.2% $ 18,608 31.4% $ 18,556 25.0% Exclude: Inventory adjustments 277 - 1,163 103 Exclude: Depreciation and amortization 832 1,232 4,062 4,361 Non-GAAP Profit $ / Non-GAAP Margin % $ 8,100 48.1% $ 5,722 33.4% $ 23,833 40.2% $ 23,020 31.0% Overall Gross Profit $ / Margin % $ 31,771 43.3% $ 23,355 32.2% $ 111,607 39.0% $ 94,790 34.3% Non-GAAP Profit $ / Non-GAAP Margin % $ 41,617 56.8% $ 36,932 51.0% $ 161,089 56.3% $ 148,150 53.6%
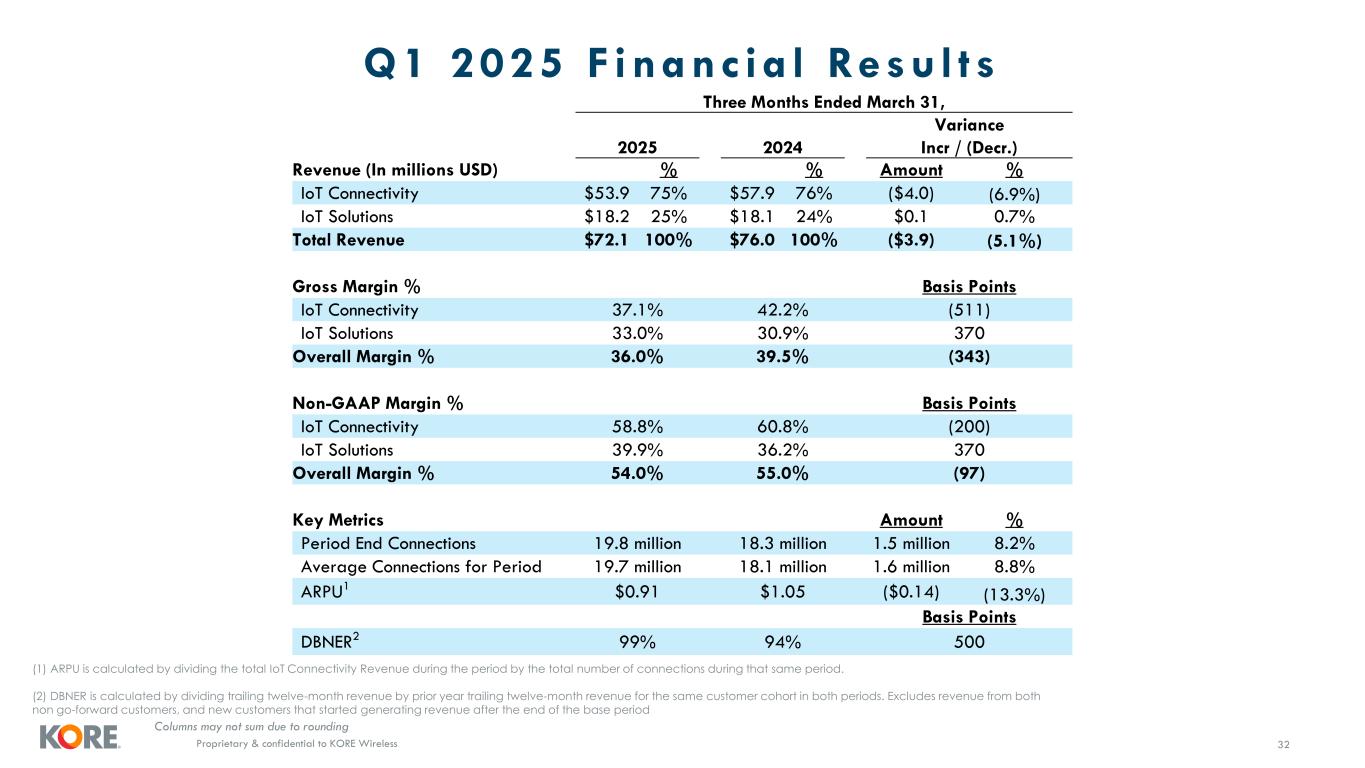
Proprietary & confidential to KORE Wireless Q1 2025 F inanc ia l Resu l t s 32 (1) ARPU is calculated by dividing the total IoT Connectivity Revenue during the period by the total number of connections during that same period. (2) DBNER is calculated by dividing trailing twelve-month revenue by prior year trailing twelve-month revenue for the same customer cohort in both periods. Excludes revenue from both non go-forward customers, and new customers that started generating revenue after the end of the base period Columns may not sum due to rounding Three Months Ended March 31, 2025 2024 Variance Incr / (Decr.) Revenue (In millions USD) % % Amount % IoT Connectivity $53.9 75% $57.9 76% ($4.0) (6.9%) IoT Solutions $18.2 25% $18.1 24% $0.1 0.7% Total Revenue $72.1 100% $76.0 100% ($3.9) (5.1%) Gross Margin % Basis Points IoT Connectivity 37.1% 42.2% (511) IoT Solutions 33.0% 30.9% 370 Overall Margin % 36.0% 39.5% (343) Non-GAAP Margin % Basis Points IoT Connectivity 58.8% 60.8% (200) IoT Solutions 39.9% 36.2% 370 Overall Margin % 54.0% 55.0% (97) Key Metrics Amount % Period End Connections 19.8 million 18.3 million 1.5 million 8.2% Average Connections for Period 19.7 million 18.1 million 1.6 million 8.8% ARPU1 $0.91 $1.05 ($0.14) (13.3%) Basis Points DBNER2 99% 94% 500
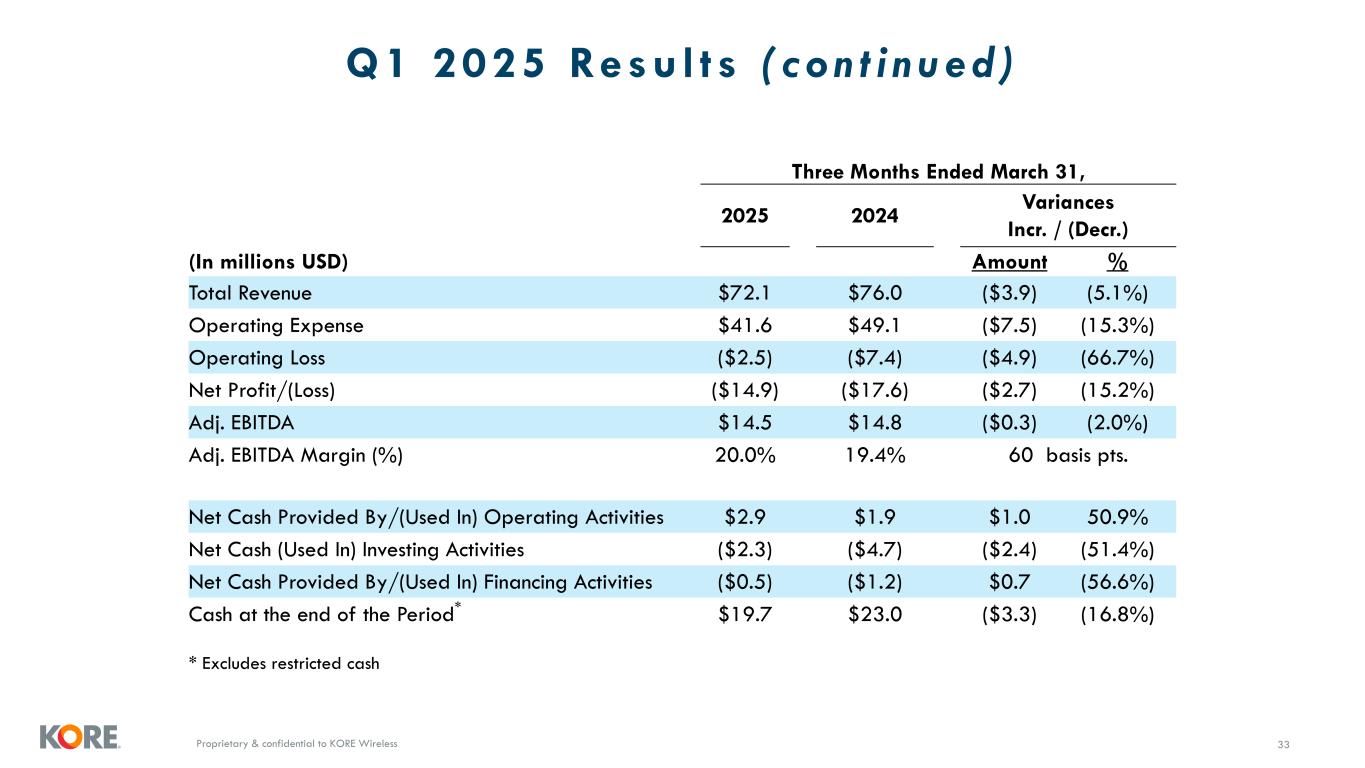
Proprietary & confidential to KORE Wireless Q1 2025 Resu l t s ( con t i n ued ) 33 Three Months Ended March 31, 2025 2024 Variances Incr. / (Decr.) (In millions USD) Amount % Total Revenue $72.1 $76.0 ($3.9) (5.1%) Operating Expense $41.6 $49.1 ($7.5) (15.3%) Operating Loss ($2.5) ($7.4) ($4.9) (66.7%) Net Profit/(Loss) ($14.9) ($17.6) ($2.7) (15.2%) Adj. EBITDA $14.5 $14.8 ($0.3) (2.0%) Adj. EBITDA Margin (%) 20.0% 19.4% 60 basis pts. Net Cash Provided By/(Used In) Operating Activities $2.9 $1.9 $1.0 50.9% Net Cash (Used In) Investing Activities ($2.3) ($4.7) ($2.4) (51.4%) Net Cash Provided By/(Used In) Financing Activities ($0.5) ($1.2) $0.7 (56.6%) Cash at the end of the Period* $19.7 $23.0 ($3.3) (16.8%) * Excludes restricted cash
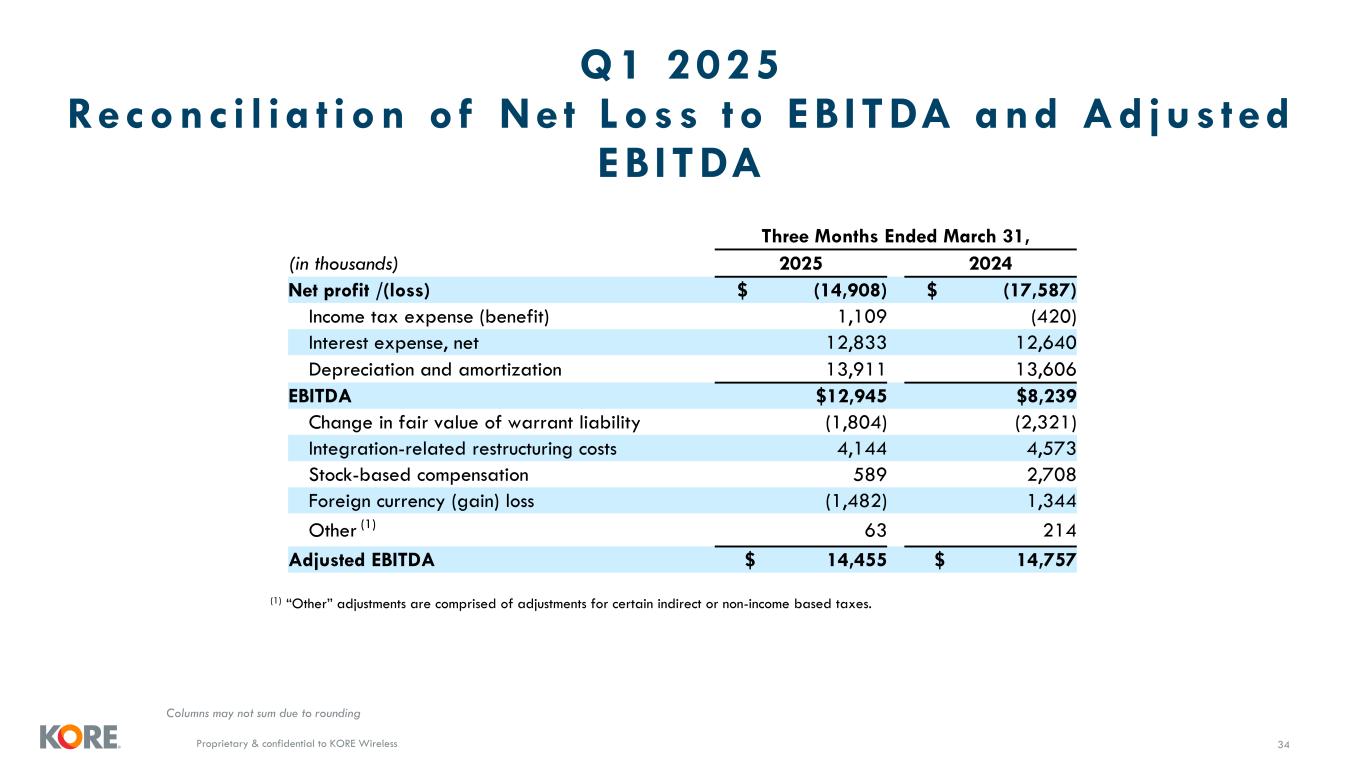
Proprietary & confidential to KORE Wireless Q1 2025 Reconc i l i a t ion o f Ne t Loss to EB ITDA and Ad jus ted EB ITDA 34 Columns may not sum due to rounding (1) “Other” adjustments are comprised of adjustments for certain indirect or non-income based taxes. Three Months Ended March 31, (in thousands) 2025 2024 Net profit /(loss) $ (14,908) $ (17,587) Income tax expense (benefit) 1,109 (420) Interest expense, net 12,833 12,640 Depreciation and amortization 13,911 13,606 EBITDA $12,945 $8,239 Change in fair value of warrant liability (1,804) (2,321) Integration-related restructuring costs 4,144 4,573 Stock-based compensation 589 2,708 Foreign currency (gain) loss (1,482) 1,344 Other (1) 63 214 Adjusted EBITDA $ 14,455 $ 14,757
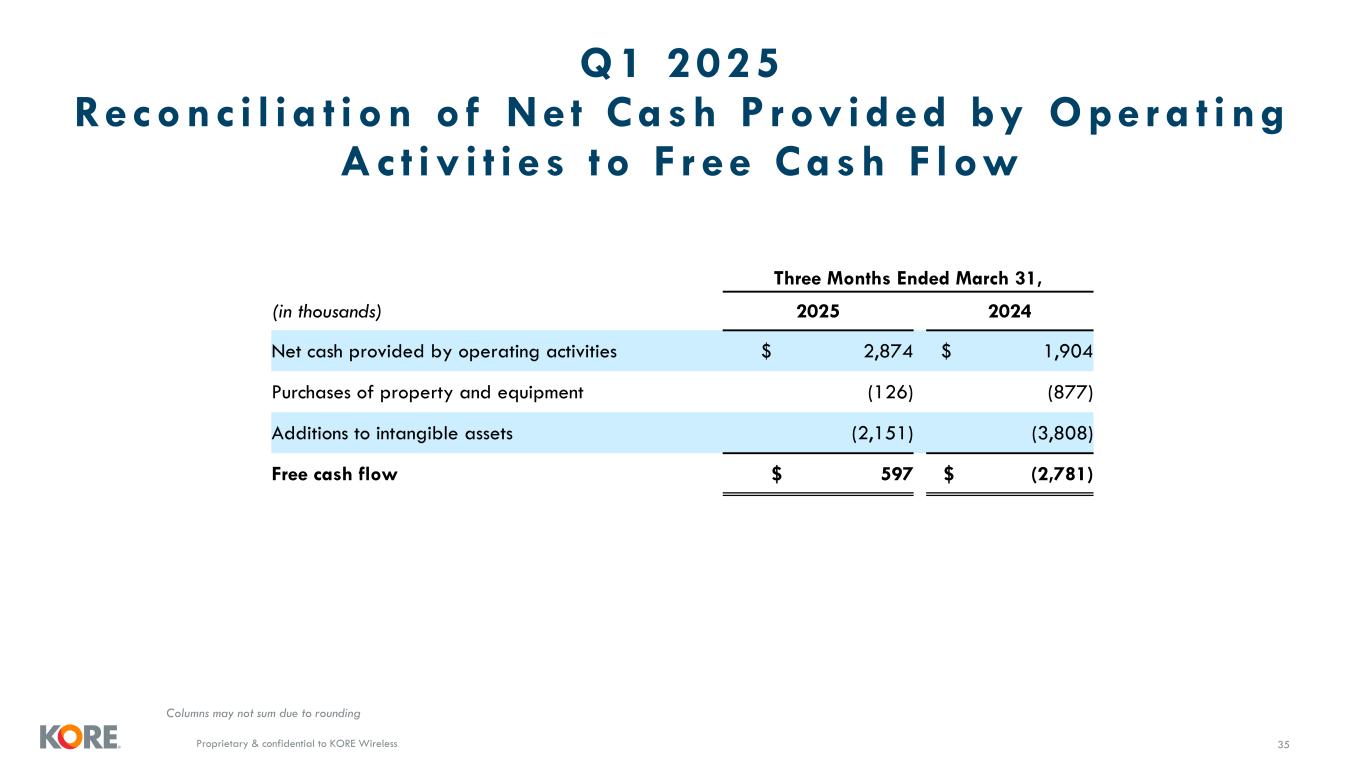
Proprietary & confidential to KORE Wireless Q1 2025 Reconc i l i a t ion o f Ne t Cash P rov ided by Oper a t ing Ac t iv i t i e s to F r ee Cash F low 35 Columns may not sum due to rounding Three Months Ended March 31, (in thousands) 2025 2024 Net cash provided by operating activities $ 2,874 $ 1,904 Purchases of property and equipment (126) (877) Additions to intangible assets (2,151) (3,808) Free cash flow $ 597 $ (2,781)
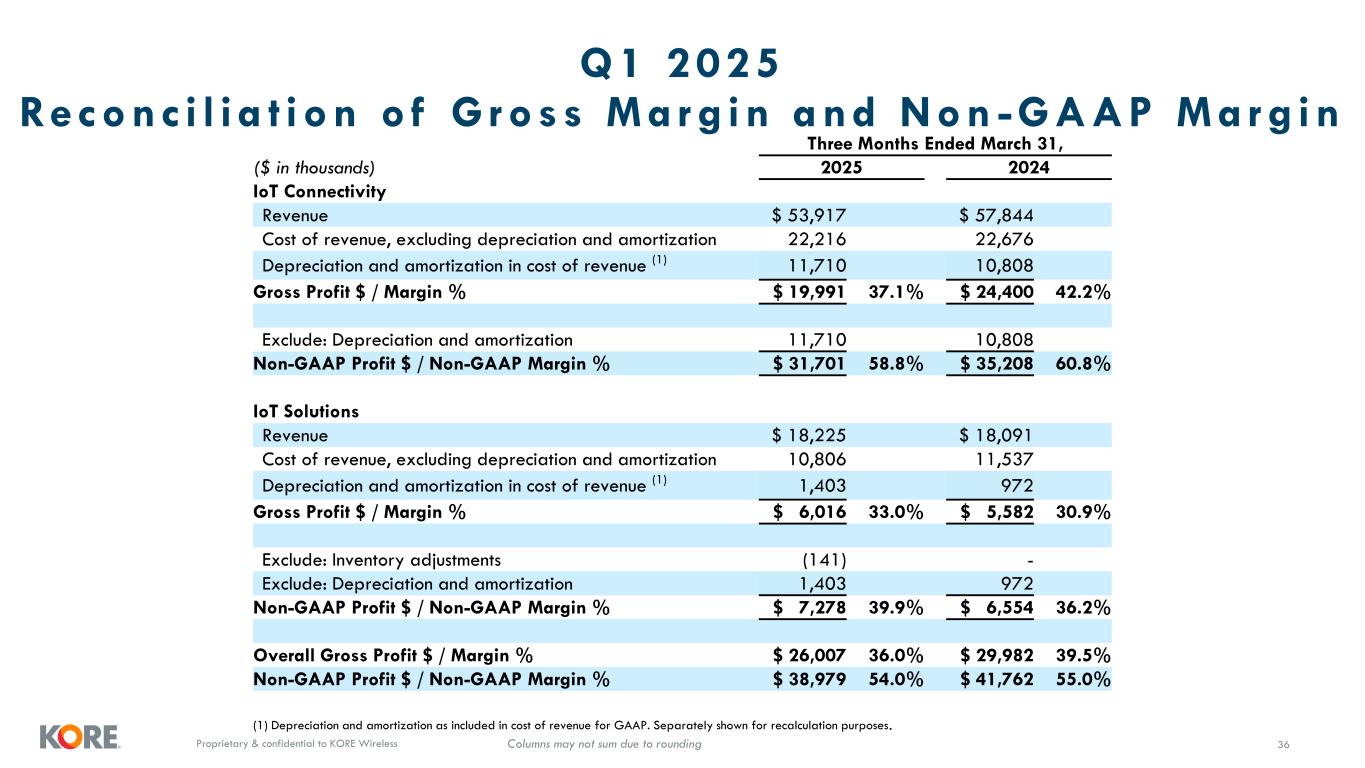
Proprietary & confidential to KORE Wireless Q1 2025 Reconc i l i a t ion o f G ross Mar g in and Non -GAAP Mar g in 36Columns may not sum due to rounding Three Months Ended March 31, ($ in thousands) 2025 2024 IoT Connectivity Revenue $ 53,917 $ 57,844 Cost of revenue, excluding depreciation and amortization 22,216 22,676 Depreciation and amortization in cost of revenue (1) 11,710 10,808 Gross Profit $ / Margin % $ 19,991 37.1% $ 24,400 42.2% Exclude: Depreciation and amortization 11,710 10,808 Non-GAAP Profit $ / Non-GAAP Margin % $ 31,701 58.8% $ 35,208 60.8% IoT Solutions Revenue $ 18,225 $ 18,091 Cost of revenue, excluding depreciation and amortization 10,806 11,537 Depreciation and amortization in cost of revenue (1) 1,403 972 Gross Profit $ / Margin % $ 6,016 33.0% $ 5,582 30.9% Exclude: Inventory adjustments (141) - Exclude: Depreciation and amortization 1,403 972 Non-GAAP Profit $ / Non-GAAP Margin % $ 7,278 39.9% $ 6,554 36.2% Overall Gross Profit $ / Margin % $ 26,007 36.0% $ 29,982 39.5% Non-GAAP Profit $ / Non-GAAP Margin % $ 38,979 54.0% $ 41,762 55.0% (1) Depreciation and amortization as included in cost of revenue for GAAP. Separately shown for recalculation purposes.
Proprietary & confidential to KORE Wireless Disc la imers 37 Forward-Looking Statements This presentation includes "forward-looking statements" within the meaning of the "safe harbor" provisions of the Private Securities Litigation Reform Act of 1995. KORE's actual results may differ from their expectations, estimates and projections and consequently, you should not rely on these forward-looking statements as predictions of future events. Forward-looking statements generally are accompanied by words such as "believe," "guidance," "may," "will," "estimate," "continue," "anticipate," "intend," "expect," "should," "would," "plan," "predict," "potential," "seem," "seek," "future," "outlook,“ and similar expressions that predict or indicate future events or trends or that are not statements of historical matters. These forward-looking statements include, but are not limited to, statements regarding expected financial and other risks, statements regarding future operational performance and efficiency, 2025 guidance, statements regarding the expected cost savings, revenue growth and profitability from the Company’s restructuring plan, estimates and forecasts of revenue, Adjusted EBITDA, Free Cash Flow and other financial and performance metrics, statements regarding growth from the Company’s indirect channel partner relationships, projections regarding recent customer engagements, projections of market opportunity and conditions, the impact of SGP.32 eSIM architecture, and the Estimated Annual Recurring Revenue ("eARR") of contracts and potential revenue opportunities in KORE’s sales funnel. These statements are based on various assumptions and on the current expectations of KORE’s management. These forward-looking statements are provided for illustrative purposes only and are not intended to serve as and must not be relied on by any investor or other person as, a guarantee, an assurance, a prediction or a definitive statement of fact or probability. Actual events and circumstances are difficult or impossible to predict and will differ from assumptions. Many actual events and circumstances are beyond the control of KORE. These forward-looking statements are subject to a number of risks and uncertainties, including the risks discussed under the caption “Item 1A. Risk Factors” in Part I of our most recent Annual Report on Form 10-K or any updates discussed under the caption “Item 1A. Risk Factors” in Part II of our Quarterly Reports on Form 10-Q and in our other filings with the SEC including general economic, financial, legal, political and business conditions and changes in domestic and foreign markets. If the risks materialize or assumptions prove incorrect, actual results could differ materially from the results implied by these forward-looking statements. There may be additional risks that KORE presently does not know or that KORE currently believes are immaterial that could also cause actual results to differ materially from those contained in the forward-looking statements. In addition, forward- looking statements reflect KORE's expectations, plans or forecasts of future events and views as of the date of this presentation. KORE anticipates that subsequent events and developments will cause these assessments to change. However, while KORE may elect to update these forward-looking statements at some point in the future, KORE specifically disclaims any obligation to do so. These forward-looking statements should not be relied upon as representing KORE's assessments as of any date subsequent to the date of this presentation. Accordingly, undue reliance should not be placed upon the forward-looking statements. Use of Projections This presentation also contains certain financial forecasts of KORE. KORE's independent auditors have not studied, reviewed, compiled or performed any procedures with respect to the projections for the purpose of their inclusion in this presentation, and accordingly, neither of them has expressed an opinion or provided any other form of assurance with respect thereto for the purpose of this presentation. These projections are for illustrative purposes only and should not be relied upon as being necessarily indicative of future results. The assumptions and estimates underlying the prospective financial information are inherently uncertain and are subject to a wide variety of significant business, economic and competitive risks and uncertainties that could cause actual results to differ materially from those contained in the prospective financial information. Projections are inherently uncertain due to a number of factors outside of KORE's control. Accordingly, there can be no assurance that the prospective results are indicative of future performance of KORE or that actual results will not differ materially from those presented in the prospective financial information. Inclusion of the prospective financial information in this presentation should not be regarded as a representation by any person that the results contained in the prospective financial information will be achieved.
Proprietary & confidential to KORE Wireless Disc la imers 38 Use of Non-GAAP Financial Measures In conjunction with net loss calculated in accordance with GAAP, we also use EBITDA and Adjusted EBITDA (as well as Adjusted EBITDA as a percentage of revenue), free cash flow, and Non-GAAP Profit and Non-GAAP Margin to evaluate our ongoing operations and for internal planning and forecasting purposes. Non-GAAP financial information is presented for supplemental informational purposes only, should not be considered in isolation or as a substitute for financial information presented in accordance with GAAP, and may be different from similarly-titled non-GAAP measures used by other companies. We believe that along with our GAAP financial information, our non-GAAP financial information when taken collectively and evaluated appropriately, is helpful to investors in assessing our operating performance. EBITDA is defined as net loss before interest expense, income tax expense or benefit, and depreciation and amortization. Adjusted EBITDA is defined as EBITDA adjusted for certain unusual and other significant items and removes the volatility associated with non-cash items and operational income and expenses that are not expected to be ongoing. Such adjustments include goodwill impairment charges, changes in the fair value of certain of our warrants required by GAAP to be accounted for at fair value, gains or losses on debt extinguishment, “transformation expenses” related to the implementation of our strategic transformation plan and include the costs of a re-write of our core technology platform, expenses incurred to design certain new IoT Solutions, and “go-to-market” capabilities. All of which expenses were completed in 2023, acquisition costs, integration-related restructuring costs, stock-based compensation, and foreign currency gains and losses. Adjusted EBITDA as a percentage of revenue is calculated as Adjusted EBITDA divided by revenue, and has no GAAP equivalent, as net loss as a percentage of revenue is not considered meaningful. Free cash flow is defined as net cash provided by operating activities reduced by capital expenditures consisting of purchases of property and equipment, purchases of intangible assets and capitalization of internal use software. We believe free cash flow is an important liquidity measure of the cash that is available for operational expenses, investments in our business, strategic acquisitions, and for certain other activities such as repaying debt obligations and stock repurchases. Free Cash Flow is a non-GAAP measure defined as net cash used in operating activities - continuing operations, reduced by capital expenditures (consisting of purchases of property and equipment), purchases of intangible assets and capitalization of internal use software. We believe Free Cash Flow is an important liquidity measure of the cash that is available for operational expenses, investments in our business, strategic acquisitions, and for certain other activities such as repaying debt obligations and stock repurchases. Free Cash Flow is a key financial indicator used by management. Free Cash Flow is useful to investors as a liquidity measure because it measures our ability to generate or use cash. The use of Free Cash Flow as an analytical tool has limitations because it does not represent the residual cash flow available for discretionary expenditures. Because of these limitations, Free Cash Flow should be considered along with other operating and financial performance measures presented in accordance with GAAP. Non-GAAP Margin is a non-GAAP measure defined as non-GAAP Gross Profit (“Non-GAAP Profit”) divided by revenue, expressed as a percentage. Non-GAAP Profit is a non-GAAP measure defined as gross profit excluding certain (i) inventory adjustments that may not be indicative of ongoing operations, (ii) depreciation and (iii) amortization. Gross profit and gross margin as calculated in accordance with GAAP include depreciation and amortization as part of a cost of revenue, which is shown separately for convenience in the GAAP reconciliation included in the supplementary schedules of this presentation. Non-GAAP Margin is a non-GAAP measure defined as non-GAAP Gross Profit (“Non-GAAP Profit”) divided by revenue, expressed as a percentage. Non-GAAP Profit is a non-GAAP measure defined as gross profit excluding certain (i) inventory adjustments that may not be indicative of ongoing operations, (ii) depreciation and (iii) amortization. We have not provided the forward-looking equivalents calculated using accounting principles generally accepted in the United States (GAAP) for the forward-looking non-GAAP financial measures Adjusted EBITDA and Free Cash Flow or a GAAP reconciliation as a result of the uncertainty regarding, and the potential variability of, reconciling items including but not limited to stock-based compensation expense, foreign currency loss or gain and acquisition and integration-related expenses. Accordingly, a reconciliation of this non-GAAP guidance metric to its corresponding GAAP equivalents is not available without unreasonable effort. However, it is important to note that material changes to reconciling items could have a significant effect on future GAAP results and, as such, we also believe that any reconciliations provided would imply a degree of precision that could be confusing or misleading to investors.