Filed pursuant to Rule 424(b)(3)
Registration Statement No. 333-261464
KORE GROUP HOLDINGS, INC.
8,911,744 COMMON STOCK ISSUABLE UPON THE EXERCISE OF WARRANTS
12,000,000 SHARES OF COMMON STOCK UNDERLYING THE EXCHANGEABLE NOTES
186,326 SHARES OF COMMON STOCK
This prospectus relates to the resale of 12,186,326 shares of common stock, par value $0.0001 per share (the “common stock”) of KORE Group Holdings, Inc. (the “Company”), which consists of an aggregate of (i) 12,000,000 shares of common stock underlying the Exchangeable Notes (as defined herein); and (ii) 186,326 shares of common stock issued as compensation to certain advisors of the Company in connection with the Business Combination (as defined below). We collectively refer to the selling securityholders covered by this prospectus as the “Selling Securityholders.” This prospectus also relates to the issuance by us of up to 8,911,744 shares of common stock upon the exercise of outstanding Company warrants.
On September 30, 2021, we consummated the transactions contemplated by that certain Agreement and Plan of Merger dated March 12, 2021, as amended on July 27, 2021 and September 21, 2021 (the “Merger Agreement”), by and among Cerberus Telecom Acquisition Corp. (“CTAC”), King Pubco, Inc. (“KORE”), a Delaware corporation and wholly owned subsidiary of Cerberus Telecom Acquisition Holdings, LLC (the “Sponsor”), an affiliate of CTAC, King Corp Merger Sub, Inc. (“Corp Merger Sub”), a Delaware corporation and direct, wholly owned subsidiary of the Sponsor, King LLC Merger Sub, LLC (“LLC Merger Sub”), a Delaware limited liability company and direct wholly owned subsidiary of KORE, and Maple Holdings Inc. (“Maple” or “pre-combination KORE”), a Delaware corporation, which, among other things, provided for (i) the merger of CTAC with and into LLC Merger Sub (the “Pubco Merger”), with LLC Merger Sub being the surviving entity of the Pubco Merger and KORE as parent of the surviving entity, (ii) immediately prior to the First Merger (as defined below), the contribution by Sponsor of 100% of its equity interests in Corp Merger Sub to KORE (the “Corp Merger Sub Contribution”), as a result of which Corp Merger Sub became a wholly owned subsidiary of KORE, (iii) following the Corp Merger Sub Contribution, the merger of Corp Merger Sub with and into Maple (the “First Merger”), with Maple being the surviving corporation of the First Merger, and (iv) immediately following the First Merger and as part of the same overall transaction as the First Merger, the merger of Maple with and into LLC Merger Sub (the “Second Merger” and, together with the First Merger, being collectively referred to as the “Mergers” and, together with the other transactions contemplated by the Merger Agreement, the “Transactions” and the closing of the Transactions, the “Business Combination”), with LLC Merger Sub being the surviving entity of the Second Merger and KORE being the sole member of LLC Merger Sub. In connection with the Business Combination, KORE changed its name to “KORE Group Holdings, Inc.”
Each public and private warrant of CTAC outstanding immediately prior to the Mergers was automatically converted into warrants of the Company on a one-for-one basis.
As part of the Business Combination, we entered into that certain backstop agreement (“Backstop Agreement”) dated July 27, 2021 between KORE Wireless Group, Inc., a wholly owned subsidiary of KORE, and Drawbridge Special Opportunities Fund LP, an affiliate of Fortress Credit Corp. (“Fortress”), pursuant to which Fortress agreed to purchase senior unsecured convertible notes in an aggregate principal amount of up to $120,000,000 issued, from time to time, by KORE Wireless Group, Inc (the “Exchangeable Notes”). The Company agreed, pursuant to the Backstop Agreement, to register the resale of the shares of common stock issued in exchange for the Exchangeable Notes.
We will receive the proceeds from any exercise of the warrants for cash, but not from the resale of the shares of common stock registered hereby by the Selling Securityholders. We will bear all costs, expenses and fees in connection with the registration of the shares of common stock. The Selling Securityholders will bear all commissions and discounts, if any, attributable to their respective sales of the shares of common stock.
We are registering the offer and sale of the securities described above to satisfy certain registration rights we have granted. Our registration of the securities covered by this prospectus does not mean that either we or the Selling Securityholders will issue, offer or sell, as applicable, any of the securities. The Selling Securityholders and any of their permitted transferees may offer and sell the securities covered by this prospectus in a number of different ways and at varying prices. Additional information on the Selling Securityholders, and the times and manner in which they may offer and sell the securities under this prospectus, is provided under “Selling Securityholders” and “Plan of Distribution” in this prospectus.
Our common stock trades on the New York Stock Exchange (the “NYSE”) under the ticker symbol “KORE” and our warrants trade on the NYSE under the ticker symbol “KORE WS.” On June 6, 2023, the closing sale price of our common stock as reported by NYSE was $1.43 per share and the closing price of our warrants was $0.12.
Investing in shares of our common stock or warrants involves risks that are described in the “Risk Factors” section beginning on page 6 of this prospectus. Neither the SEC nor any state securities commission has approved or disapproved of the securities to be issued under this prospectus or determined if this prospectus is truthful or complete. Any representation to the contrary is a criminal offense.
The date of this prospectus is June 20, 2023.
TABLE OF CONTENTS
You should rely only on the information contained in this prospectus. No one has been authorized to provide you with information that is different from that contained in this prospectus. This prospectus is dated as of the date set forth on the cover hereof. You should not assume that the information contained in this prospectus is accurate as of any date other than that date.
ABOUT THIS PROSPECTUS
This prospectus is part of a registration statement on Form S-1 that we filed with the SEC using the “shelf” registration process. Under the shelf registration process, the Selling Securityholders may, from time to time, sell the securities offered by them described in this prospectus. We will not receive any proceeds from the sale by such Selling Securityholders of the securities offered by them described in this prospectus. This prospectus also relates to the issuance by us of shares of common stock issuable upon the exercise of warrants. We will receive proceeds from any exercise of the warrants for cash.
Neither we nor the Selling Securityholders have authorized anyone to provide you with any information or to make any representations other than those contained in this prospectus or any applicable prospectus supplement or any free writing prospectuses prepared by or on behalf of us or to which we have referred you. Neither we nor the Selling Securityholders take responsibility for, and can provide no assurance as to the reliability of, any other information that others may give you. Neither we nor the Selling Securityholders will make an offer to sell these securities in any jurisdiction where such offer or sale are not permitted. No dealer, salesperson or other person is authorized to give any information or to represent anything not contained in this prospectus, any applicable prospectus supplement or any related free writing prospectus. You should assume that the information appearing in this prospectus or any prospectus supplement is accurate as of the date on the front of those documents only, regardless of the time of delivery of this prospectus or any applicable prospectus supplement, or any sale of a security. Our business, financial condition, results of operations and prospects may have changed since those dates.
The Selling Securityholders and their permitted transferees may use this shelf registration statement to sell securities from time to time through any means described in the section titled “Plan of Distribution.” More specific terms of any securities that the Selling Securityholders and their permitted transferees offer and sell may be provided in a prospectus supplement that describes, among other things, the specific amounts and prices of the securities being offered and the terms of the offering.
We may also provide a prospectus supplement or post-effective amendment to the registration statement to add information to, or update or change information contained in, this prospectus. Any statement contained in this prospectus will be deemed to be modified or superseded for purposes of this prospectus to the extent that a statement contained in such prospectus supplement or post-effective amendment modifies or supersedes such statement. Any statement so modified will be deemed to constitute a part of this prospectus only as so modified, and any statement so superseded will be deemed not to constitute a part of this prospectus. You should read both this prospectus and any applicable prospectus supplement or post-effective amendment to the registration statement together with the additional information to which we refer you in the sections of this prospectus titled “Where You Can Find More Information.”
Unless the context indicates otherwise, references in this prospectus to “KORE,” “Company,” “we,” “us” or “our” refer to the business of KORE Group Holdings, Inc., and its subsidiaries following the closing of the Business Combination.
This prospectus contains summaries of certain provisions contained in some of the documents described herein, but reference is made to the actual documents for complete information. All of the summaries are qualified in their entirety by the actual documents. Copies of some of the documents referred to herein have been filed, will be filed or will be incorporated by reference as exhibits to the registration statement of which this prospectus is a part, and you may obtain copies of those documents as described below under “Where You Can Find More Information.”
MARKET, INDUSTRY AND OTHER DATA
This prospectus includes estimates regarding market and industry data and forecasts and projections, which are based on publicly available information, industry publications and surveys, reports from government agencies, reports by market participants and research firms and other independent sources, as well as our own estimates, forecasts and projections based on our management’s knowledge of and experience in the market sectors in which we compete.
Certain monetary amounts, percentages and other figures included in this prospectus have been subject to rounding adjustments. Accordingly, figures shown as totals in certain tables or charts may not be the arithmetic aggregation of the figures that precede them, and figures expressed as percentages in the text may not total 100% or, as applicable, when aggregated may not be the arithmetic aggregation of the percentages that precede them.
TRADEMARKS
This prospectus also contains trademarks, service marks, copyrights and trade names of other companies, which are the property of their respective owners. We do not intend our use or display of other companies’ trademarks, copyrights or trade names to imply a relationship with, or endorsement or sponsorship of us by any other companies. Solely for convenience, our trademarks and trade names referred to in this prospectus may appear without the ® or ™ symbols, but such references are not intended to indicate, in any way, that we will not assert, to the fullest extent under applicable law, our rights or the right of the applicable licensor to these trademarks and trade names.
SELECTED DEFINITIONS
As used in this prospectus, unless as the context requires otherwise, as used herein, references to “KORE,” the “Company,” “we,” “us,” and “our,” and similar references refer collectively to KORE Group Holdings, Inc. and its consolidated subsidiaries.
Unless the context otherwise requires, references in this prospectus to:
•“ASU” are to Accounting Standards Update;
•“Backstop Agreement” are to that certain backstop agreement dated July 27, 2021 between KORE Wireless Group, Inc., a wholly owned subsidiary of KORE, and Drawbridge Special Opportunities Fund LP, an affiliate of Fortress Credit Corp., in connection with the Backstop Financing, as amended November 15, 2021;
•“Backstop Financing” are to the backstop financing to be provided by an affiliate of Fortress Credit Corp. pursuant to the Backstop Agreement and the Commitment Letter;
•“Backstop Notes” are to the senior unsecured convertible notes in an aggregate principal amount of $120,000,000 issued by KORE Wireless Group, Inc. pursuant to the Backstop Financing and the Commitment Letter;
•“ Base Exchange Rate” are to the $12.50 per share that is exchangeable for a Note into a Common Stock by us at any time at the option of Fortress.;
•“ Board” are to the board of directors of KORE Group Holdings, Inc.;
•“BMP” Acquisition” is the acquisition of 100% of the outstanding share capital of Business Mobility Partners, Inc. (“BMP”) and Simon IoT LLC (“Simon IoT”);
•“Business Combination” The acquisition of the net assets of Cerberus Telecom Acquisition Corporation ("CTAC") by pre-combination KORE, which was accounted for as a reverse recapitalization;
•“CaaS” are to Connectivity-as-a-Service;
•“CEaaS” are to Connectivity Enablement-as-a-Service;
•“ CECL” are to current expected credit loss;
•“CHTS” is Connected Health Telemetry Solution;
•“Closing” are to the consummation of the Transactions;
•“ Closing Date” are to September 30, 2021;
•“Code” are to the Internal Revenue Code of 1986, as amended;
•“ Company” are to KORE Group Holdings, Inc.;
•“CODM” are to the chief operating decision maker;
•“Commitment Letter” are to that certain commitment letter dated as of September 21, 2021, and countersigned on October 1, 2021, by and among an affiliate of Fortress Credit Corp., KORE, Corp Merger Sub and LLC Merger Sub;
•“Corp Merger Sub” are to King Corp Merger Sub, Inc.;
•“COVID-19” are to SARS-CoV-2 or COVID-19, any evolution or variations existing as of or following the date of the Merger Agreement, or any epidemics, pandemics or disease outbreaks;
•“FDA” are to U.S. Food and Drug Administration;
•“EGC” are to emerging growth company;
•“eCOA” is Electronic Clinical Outcome Assessment;
•“eSIM” or embedded subscriber identity module, is a form of programmable SIM. It provides the capability to store multiple network profiles that can be provisioned and managed over-the-air;
•“eUICC” or embedded universal integrated circuit card is a form of programmable SIM card, often referred to as eSIM. It provides the capability to store multiple network profiles that can be provisioned and managed over-the-air;
•“ePRO” is Electronic Patient Reported Outcome;
•“Exchange Act” is the Securities Exchange Act of 1934, as amended;
•“FASB” are to Financial Accounting Standards Board;
•“FIFO” are to first-in, first-out method;
•“Fortress” are to the affiliates of Fortress Credit Corp.;
•“GAAP” are to generally accepted accounting principles in the United States;
•“GNSS Receiver” are to a global navigation satellite system receiver which is integral to an electronic device that receives and digitally processes the signals from a navigation satellite constellation in order to allow the functioning of GPS systems and other location based devices;
•“HIPAA” are to Health Insurance Portability and Accountability Act;
•“Incentive Plan” are to the KORE 2021 Long-Term Stock Incentive Plan;
•“IoT” are to Internet of Things;
•“IIoT” are to Industrial IoT;
•“KORE Common Stock” are to the shares of common stock of KORE, par value $0.0001 per share;
•“KORE Warrants” are to the sale of Series B preferred stock, pre-combination KORE issued warrants for the purchase of common stock at an exercise price of $0.01 per warrant;
•“KORE Wireless” are to KORE Wireless, Inc., a Delaware corporation and wholly owned and principal operating subsidiary of KORE;
•“LLC Merger Sub” are to King LLC Merger Sub, LLC;
•“Lock-Up Shares” are to KORE stockholders party thereto are contractually restricted from selling or transferring any of their shares of our Company’s common stock;
•“LTE” Long-Term Evolution is a standard for wireless broadband communication for mobile devices and data terminals, based on the GSM/EDGE and UMTS/HSPA standards;
•“Maple” are to Maple Holdings Inc.;
•“Merger Agreement” are to that certain Agreement and Plan of Merger, dated as of March 12, 2021, as amended on July 27, 2021 and September 21, 2021, by and among CTAC, KORE, Corp Merger Sub, LLC Merger Sub and Maple Holdings Inc.;
•“Mergers” are to the First Merger and Second Merger, collectively;
•“MRCs” are to monthly recurring charges;
•“MODGo” is KORE branded SaaS platform solution to manage, order and deploy devices on the go;
•“NYSE” is to the New York Stock Exchange;
•“mPERS” are to mobile Personal Emergency Response System;
•“PCAOB” are to the Public Company Accounting Oversight Board;
•“multi-IMSI” is multi- International Mobile Subscriber Identity;
•“OEMs” are to original equipment manufacturers;
•“OmniSIM” is eSIM /eUICC solution branded by KORE as it a unique solution which offers a combination of KORE and local profiles on a single eSIM. Omni Reach and Omni Rush are two different variations of the OmniSIM solution;
•“PIPE” are to Private Investment in Public Equity;
•“RSUs” are to Restricted Stock Unit Awards;
•“PIPE Investment” are to the private placement pursuant to which CTAC entered into subscription agreements (containing commitments to funding that are subject only to conditions that generally align with the conditions set forth in the Merger Agreement) with certain investors whereby such investors agreed to purchase an aggregate of 22,500,000 shares of KORE Common Stock at a purchase price of $10.00 per share for an aggregate commitment of $225,000,000;
•“PIPE Investors” are to the investors participating in the PIPE Investment;
•“SaaS” are to software-as-a-service;
•“SEC” are to the United States Securities and Exchange Commission;
•“Simon IoT” are to Simon IoT LLC;
•“Sponsor” are to Cerberus Telecom Acquisition Holdings, LLC, a Delaware limited liability company;
•“Subscription Agreements” are to the subscription agreements entered into by and between CTAC and the PIPE Investors, in each case, dated as of March 12, 2021 in connection with the PIPE Investment;
•“Transactions” are to, collectively, the Business Combination and the other transactions contemplated by the Merger Agreement and the other related transaction agreements; and
•“Warrant Agreement” are to a certain warrant agreement entered into by and between CTAC and Continental Stock Transfer & Trust Company, dated as of October 26, 2021.
CAUTIONARY STATEMENT REGARDING FORWARD-LOOKING STATEMENTS
This prospectus contains forward-looking statements within the meaning of the Private Securities Litigation Reform Act of 1995. These statements express our opinions, expectations, beliefs, plans, objectives, assumptions, forecasts or projections regarding future events or future results and therefore are, or may be deemed to be, “forward-looking statements.” These forward-looking statements can generally be identified by the use of forward-looking terminology, including the terms “believes,” “estimates,” “anticipates,” “expects,” “seeks,” “projects,” “intends,” “plans,” “may,” “will” or “should” or, in each case, their negative or other variations or comparable terminology, but the absence of these words does not mean that a statement is not forward-looking. These forward-looking statements include all matters that are not historical facts.
The forward-looking statements in this prospectus are only current expectations and predictions. We have based these forward-looking statements largely on our current expectations and projections about future events and financial trends that we believe may affect our business, financial condition and results of operations. Forward-looking statements involve known and unknown risks, uncertainties and other important factors that may cause our actual results, performance or achievements to be materially different from any future results, performance or achievements expressed or implied by the forward-looking statements, including, but not limited to, the important factors discussed under the heading “Risk Factors.” The forward-looking statements in this prospectus are based upon information available to us as of the date of this prospectus, and while we believe such information forms a reasonable basis for such statements, such information may be limited or incomplete, and our statements should not be read to indicate that we have conducted an exhaustive inquiry into, or review of, all potentially available relevant information. These statements are inherently uncertain and investors are cautioned not to unduly rely upon these statements.
You should read this prospectus and the documents that we reference in this prospectus and have filed as exhibits to this prospectus with the understanding that our actual future results, levels of activity, performance and achievements may be materially different from what we expect. We qualify all of our forward-looking statements by these cautionary statements. These forward-looking statements speak only as of the date of this prospectus. Except as required by applicable law, we do not plan to publicly update or revise any forward- looking statements contained in this prospectus.
Forward-looking statements in this prospectus may include, for example, statements about:
•our ability to develop and introduce new products and services successfully;
•our ability to compete in the market in which we operate;
•our ability to meet the price and performance standards of the evolving 5G New Radio products and technologies;
•our ability to expand our customer reach/reduce customer concentration;
•our ability to grow the IoT and mobile portfolio outside of North America;
•our ability to make scheduled payments on or to refinance our indebtedness;
•our ability to introduce and sell new products that comply with current and evolving industry standards and government regulations;
•our ability to develop and maintain strategic relationships to expand into new markets;
•our ability to properly manage the growth of our business to avoid significant strains on our management and operations and disruptions to our business;
•our reliance on third parties to manufacture components of our solutions;
•our ability to accurately forecast customer demand and timely delivery of sufficient product quantities;
•our reliance on sole source suppliers for some products, services and devices used in our solutions;
•the continuing impact of uncertain global economic conditions on the demand for our products;
•the impact of geopolitical instability on our business;
•the emergence of global public health emergencies, such as the outbreak of the 2019 novel coronavirus, now known as “COVID-19,” which could extend lead times in our supply chain and lengthen sales cycles with our customers;
•direct and indirect effects of COVID-19 on our employees, customers and supply chain and the economy and financial markets;
•the impact that new or adjusted tariffs may have on the costs of components or our products, and our ability to sell products internationally;
•our ability to be cost competitive while meeting time-to-market requirements for our customers;
•our ability to meet the product performance needs of our customers in wireless broadband data access markets;
•demand for software-as-a-service telematics solutions;
•our dependence on wireless telecommunication operators delivering acceptable wireless services;
•the outcome of any pending or future litigation, including intellectual property litigation;
•infringement claims with respect to intellectual property contained in our solutions;
•our continued ability to license necessary third-party technology for the development and sale of our solutions;
•the introduction of new products that could contain errors or defects;
•conducting business abroad, including foreign currency risks;
•the pace of 5G wireless network rollouts globally and their adoption by customers;
•our ability to make focused investments in research and development;
•our ability to identify suitable acquisition candidates or to successfully integrate and realize the benefits of our past or future strategic acquisitions or investments;
•our ability to hire, retain and manage additional qualified personnel to maintain and expand our business; and
•our ability to maintain adequate liquidity to meet our financial needs and/or raise financing in the future.
PROSPECTUS SUMMARY
This summary highlights selected information from this prospectus and may not contain all of the information that is important to you in making an investment decision. Before investing in our securities, you should carefully read this entire prospectus, including our financial statements and the related notes included in this prospectus and the information set forth under the headings “Risk Factors” and “Management’s Discussion and Analysis of Financial Condition and Results of Operations.” See also the section entitled “Where You Can Find Additional Information.”
We offer IoT services and solutions. We are one of the largest global independent IoT enablers, delivering critical services to customers globally to deploy, manage and scale their IoT application and use cases. We provide advanced connectivity services, location-based services, device solutions, managed and professional services used in the development and support of IoT solutions and applications. Our IoT platform is delivered in partnership with the world’s largest mobile network operators and provides secure, reliable wireless connectivity to mobile and fixed devices. This technology enables us to expand our global technology platform by transferring capabilities across the new and existing vertical markets and to deliver complimentary products to channel partners and resellers worldwide. We began operations in 2003. A predecessor entity, KORE, Maple Holdings Inc., was incorporated under the laws of the State of Delaware on July 29, 2014. After the Closing, Maple Holdings Inc. ceased to exist as a separate legal entity.
KORE has operating subsidiaries located in Australia, Belgium, Brazil, Canada, the Dominican Republic, Ireland, Malta, Mexico, the Netherlands, New Zealand, Switzerland, the United Kingdom and the United States.
We believe we are one of the largest global enablers of IoT, providing “Connectivity” and IoT Solutions to enterprise customers across five key industry verticals, comprised of (i) Connected Health, (ii) Fleet Management, (iii) Asset Monitoring, (iv) Retail, Communications Services and (v) Industrial IoT.
On March 26, 2023, we entered into a purchase agreement (the “Purchase Agreement”) with Twilio Inc. (“Twilio”), whereby we agreed to purchase, subject to the satisfaction or waiver of the conditions set forth therein, the “internet of things” business of Twilio through the purchase of certain assets, including certain technology and intellectual property rights, and the assumption of certain liabilities, of Twilio (the “Twilio Transaction”). The Twilio Transaction was closed on June 1, 2023.
On February 16, 2022, we acquired Business Mobility Partners, Inc. and Simon IoT LLC which are industry-leading mobile service providers to expand our services and solutions within the healthcare and life sciences industries.
We have built a business at scale with revenue, net loss and adjusted EBITDA as shown in the table below:
| | | | | | | | | | | |
| Three months ended |
| (In thousands, USD) | March 31,
2023 | | March 31,
2022 |
Revenue | $ | 65,975 | | | $ | 68,978 | |
Net loss | (18,490) | | | (11,572) | |
Adjusted EBITDA | 13,328 | | | 15,288 | |
| | | | | | | | | | | |
| Twelve months ended |
| (In thousands, USD) | December 31, 2022 | | December 31, 2021 |
Revenue | $ | 268,447 | | | $ | 248,435 | |
Net loss | (106,200) | | | (24,776) | |
Adjusted EBITDA | 62,835 | | | 60,929 | |
Already a large market, we believe that IoT shows the promise and potential to be a significant technological revolution. IoT adoptions often result in significant productivity increases while creating entirely new business models in many cases, and we believe that IoT has the ability to have a significant impact worldwide. We enable this IoT adoption and are at the center of this revolution.
Diverse, Blue-chip Customer Base
We enable mission-critical IoT applications for enterprise and solution provider customers across approximately 15.1 million devices as of March 31, 2023, and 2022, and approximately 15.0 million and 14.6 million devices as of December 31, 2022, and 2021, respectively. We provided connectivity to over 3,600 customers for each of the years ended December 31, 2022 and 2021. Examples of how our customers use our products and services across our five key verticals are illustrated below:
•Connected Health: IoT enablement of medical device therapies, telehealth, chronic disease management, remote patient monitoring, IoT-enabled clinical drug trials, ePRO / eCOA, biometric sensor data capture, mPERS connected emergency devices, connected medical equipment diagnostics, electronic visit verification.
•Fleet Management: Stolen vehicle recovery location tracking, connected cameras for tracking vehicle driving conditions and driver behavior, connected route optimization, fuel consumption optimization, connected preventive maintenance, usage-based insurance, connected cars.
•Asset Monitoring: Home/business security sensor and camera solutions, offender tracking through ankle bracelets, tank monitoring, supply chain inventory and asset tracking, fuel pipeline flow monitoring.
•Retail/Communication Services: IoT and consumer service providers, carrier IoT business units, enterprise connectivity / failsafe, private networking-we may provide CEaaS for some of these customers.
•Industrial IoT: Smart utilities / meters, smart cities / buildings, smart factories, field service automation, manufacturers of smart or connected products with actionable insights into industrial operations within manufacturing and OEMs.
Across the above-mentioned use cases and others, IoT is already a large and fast-growing industry comprised of IoT hardware, software, connectivity and services.
We enable mission-critical applications for over 3,600 customers comprising over 15.0 million devices. We are a leader in enabling end-to-end IoT solutions for enterprises across high growth end markets including Connected Health, Industrial IoT, Fleet Management and Remote Asset Monitoring. We serve an expansive group of some of the largest blue-chip enterprises with low customer concentration (approximately 300 customers comprising approximately 90% and 89% of our revenue for the years ended December 31, 2022 and 2021, respectively).
Our customers operate in a wide variety of sectors, including healthcare, fleet and vehicle management, asset management, communication services and industrial/manufacturing. Our largest customer, comprising approximately 13% and 18% of our revenue for the quarters ended March 31, 2023, and 2022, respectively, is a large multinational medical device and health care company. The same customer also comprised approximately 11% and 21% of our revenue for the years ended December 31, 2022, and 2021, respectively,
We have a business to business (“B2B”) model where any given customer may have hundreds, or thousands of devices deployed in the field. The structure of our relationships with our connectivity customers is “sticky,” meaning that any exit by a connectivity customer from our platform generally will take place over an extended period of time.
The difficulty in determining if a customer is moving away from KORE is compounded by the fact that the number of total connections that we have with any particular customer can increase or decrease over time depending on a variety of factors, including pricing, customer satisfaction and fit with a particular customer product. In some cases, customers may choose to allocate a portion of their business to other service providers alongside us. This allocation can change from period to period. As a result, a decline in total connections by a customer is not necessarily an indicator that the customer has decided to move away from us. Customers often keep their volume
allocation decisions confidential in order to prevent us from making commercial adjustments (such as price increases). We have developed a reliable framework for identifying early signs of potential customer churn and deploying preventative measures to ensure retention.
Key Partners
Our strong customer and partner relationships provide it with the opportunity to expand our market reach and sales. We partner with leading cellular providers to enable its CaaS business. Our IoT ecosystem partners include enterprise-level IoT software providers as application platform partners, top of the line commercial hardware manufacturers as hardware OEM partners, well-known electronics solutions providers as semi-conductor and module OEM partners, globally recognized cloud platforms as cloud providers as well as multinational system integrators as systems integration services partners. These partnerships allow us to provide IoT Solutions to our customers.
Market Opportunity
Key highlights of our market and business opportunities include:
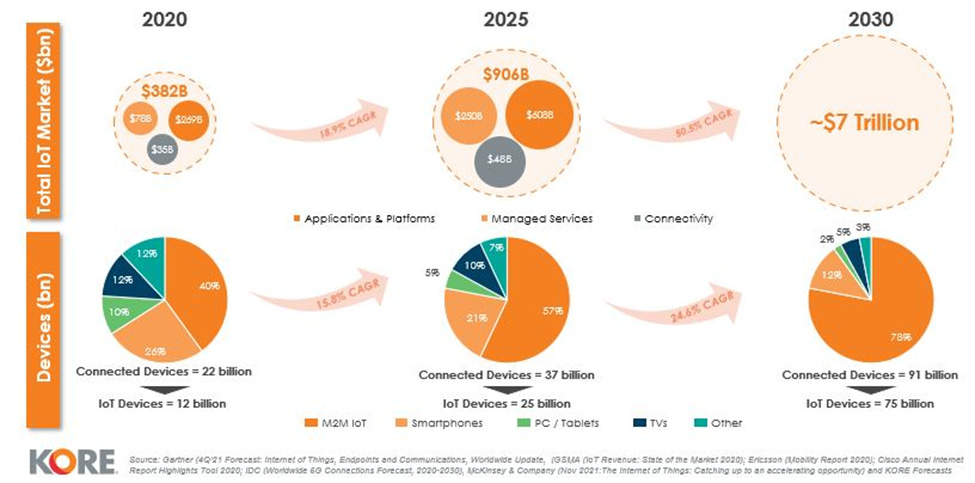
Large and Growing IoT Market. The IoT market is rapidly expanding, and we aim to capitalize on this momentum. The addressable IoT market is anticipated by industry analysts to grow from $382 billion, with 12 billion IoT devices in 2020, to $906 billion with 25 billion IoT devices by 2025. The addressable IoT market is projected by industry analysts to be $7 trillion by 2030 with 75 billion IoT devices and an accelerated growth of 50.5% CAGR. In addition to the proliferation of IoT endpoints, the adoption of 5G connectivity and enterprise digital transformation are major drivers for the growth of the IoT market.
Full stack product suite. Our mission is clear, to simplify the complexities of IoT and help clients deploy, manage, and scale their mission critical IoT Solutions. We have built a platform that allows us to be a trusted advisor to our clients in serving them in three areas CaaS, IoT Managed Services/Solutions, and Analytics, which we refer to as “CSA,” or connectivity, solutions, and analytics. We offer a one-stop shop for enterprise customers seeking to obtain multiple IoT services and solutions from a single provider.
IoT Connectivity
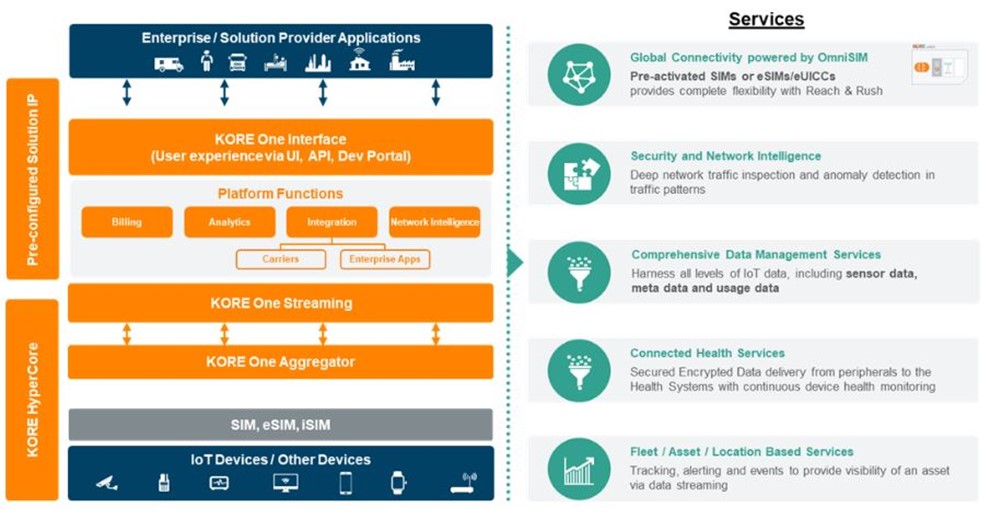
IoT Connectivity services represent 66% and 64% of our revenue for the quarters ended March 31, 2023, and 2022, respectively. IoT Connectivity services represent 66% and 68% of our revenue for the years ended December 31, 2022, and 2021, respectively. Our heritage is in delivering IoT Connectivity services, particularly cellular connectivity, which is needed in a large number of IoT use cases. Managing cellular connectivity for IoT devices is complex. Companies deploying IoT devices often do so in multiple countries and continents. Even within an individual country, it is often the case that no single carrier offers 100% network coverage or coverage across all cellular technologies. Among other IoT deployment complexities, this lack of a single carrier across territories often necessitates negotiating, establishing and maintaining a large number of cellular carrier contracts. On a day-to-day level this requires potentially accessing a large number of cellular carrier portals in order to provision, de-provision, maintain, change rate plans for, change states for, and perform other transactions for subscriber identity modules (“SIMs”) deployed in IoT devices. A company deploying IoT would also expect to get multiple cellular carrier bills every month, and to work with multiple customer support organizations when something goes wrong. This complexity is very hard to manage at scale, especially since it is only a part of the complexity of the overall IoT deployment. Our connectivity services simplify this complexity and provide a single connectivity relationship managed through a single source with the KORE One platform which is purpose built for IoT. On the back-end, we leverage 46 carrier integrations with our cellular carrier partners.
Risk Factors
Our business is subject to numerous risks and uncertainties, including those highlighted in the section entitled “Risk Factors” immediately following this prospectus summary, which represent challenges that we face in connection with the successful implementation of our strategy and the growth of our business. In particular, the following considerations, among others, may offset our competitive strengths or have a negative effect on our
business strategy, which could cause a decline in the price of shares of our common stock or warrants and result in a loss of all or a portion of your investment:
•Risks related to the revision, including, without limitation, potential inquiries from the SEC and/or the New York Stock Exchange Capital Markets, the potential adverse effect on the price of our common stock, and possible claims by our stockholders or otherwise;
•The 5G market may take longer to materialize than we expect or, if it does materialize rapidly, we may not be able to meet the development schedule and other customer demands;
•Our development and investments in new technologies, may not generate operating income or contribute to future results of operations that meet our expectations;
•If we are unable to support customers with low latency and/or high throughput IoT use cases, our revenue growth and profitability will be harmed;
•If we are unable to effectively manage our increasingly diverse and complex businesses and operations, our ability to generate growth and revenue from new or existing customers may be adversely affected;
•The loss of our largest customers, particularly our single largest customer, could significantly impact our revenue and profitability;
•Our products are highly technical and may contain undetected errors, product defects, security vulnerabilities, or software errors;
•If there are interruptions or performance problems associated with the network infrastructure used to provide our services, our customers may experience service outages, which may impact our reputation and future sales;
•Our inability to adapt to rapid technological change in our markets could impair our ability to remain competitive and adversely affect our results of operations;
•The market for the products and services that we offer is rapidly evolving and highly competitive. We may be unable to compete effectively;
•If we are unable to protect our intellectual property and proprietary rights, our competitive position and business could be harmed;
•Failure to maintain the security of our information and technology networks, including information relating to our customers and employees, could adversely affect us;
•Our internal and customer-facing systems, and systems of third parties they rely upon, may be subject to cybersecurity breaches, disruptions, or delays;
•We are subject to evolving privacy laws that are subject to potentially differing interpretations in the United States as well as other jurisdictions that can adversely impact our business and require that we incur substantial costs;
•Our technology contains third-party open-source software components and failure to comply with the terms of the underlying open-source software licenses could restrict our ability to provide our platform;
•We face risks inherent in conducting business internationally, including compliance with international as well as U.S. laws and regulations that apply to our international operations;
•We may be subject to legal proceedings and litigation, including intellectual property and privacy disputes, which are costly to defend and could materially harm our business, financial condition and results of operations;
•We may be affected by fluctuations in currency exchange rates;
•Our management has identified internal control deficiencies that have resulted in material weaknesses in our internal control over financial reporting and disclosure controls and procedures;
•Our future capital needs are uncertain, and we may need to raise additional funds in the future, but may not be able to raise such additional funds on acceptable terms or at all; and
•We have a history of losses and may not be able to achieve or sustain profitability in the future.
Corporate Information
We began operations in 2003. Our predecessor entity, Maple Holdings Inc., was incorporated under the laws of the State of Delaware on July 29, 2014. We and our subsidiaries offer IoT services and solutions. We, together with our subsidiaries, are one of the largest global independent IoT enabler, delivering critical services to customers globally to deploy, manage and scale their IoT application and use cases. We provide advanced connectivity services, location-based services, device solutions, managed and professional services used in the development and support of IoT solutions and applications. Our IoT platform is delivered in partnership with the world’s largest mobile network operators and provides secure, reliable wireless connectivity to mobile and fixed devices. This technology enables us to expand our global technology platform by transferring capabilities across the new and existing vertical markets and to deliver complimentary products to channel partners and resellers worldwide.
The mailing address of KORE’s principal executive office is 3 Ravinia Drive NE, Suite 500, Atlanta, GA 30346. Its telephone number is 877-710-5673.
Available Information
We file electronically with the SEC our annual reports on Form 10-K, quarterly reports on Form 10-Q, current reports on Form 8-K, proxy statements and other information. Our SEC filings are available to the public over the Internet at the SEC’s website at http://www.sec.gov. We make these filings available on our website at www.korewireless.com, free of charge, copies of these reports and any amendments as soon as reasonably practicable after filing or furnishing them with the SEC. We announce material information to the public about the company, our products and services and other matters through a variety of means, including our website, the investor relations section of the website, press releases, filings with the SEC, and public conference calls, in order to achieve broad distribution of information to the public. We encourage investors and others to review the information we make public in these locations, as such information could be deemed to be material information.
RISK FACTORS
An investment in our securities involves a high degree of risk. You should carefully consider the risks described below before making an investment decision. Our business, prospects, financial condition or operating results could be harmed by any of these risks, as well as other risks not currently known to us or that we currently consider immaterial. The trading price of our securities could decline due to any of these risks, and, as a result, you may lose all or part of your investment.
In the course of conducting our business operations, we are exposed to a variety of risks. Any of the risk factors we describe below have affected or could materially adversely affect our business, financial condition and results of operations. The market price of our securities could decline, possibly significantly or permanently, if one or more of these risks and uncertainties occurs. Certain statements in “Risk Factors” are forward-looking statements. See “Cautionary Statement Regarding Forward-Looking Statements.”
Risks Related to Our Business and Industry
Our actual operating results may differ significantly from any guidance provided.
Our guidance, including forward-looking statements, is prepared by management and is qualified by, and subject to, a number of assumptions and estimates that, while presented with numerical specificity, are inherently subject to significant business, economic and competitive uncertainties and contingencies. Many of these uncertainties and contingencies are beyond our control and are based upon specific assumptions with respect to future business decisions, some of which will change. We generally state possible outcomes as high and low ranges which are intended to provide a sensitivity analysis as variables are changed but are not intended to represent that actual results could not fall outside of the suggested ranges.
Guidance is necessarily speculative in nature, and it can be expected that some or all of the assumptions of the guidance furnished by us will not materialize or will vary significantly from actual results. In particular, guidance relating to the anticipated results of operations of an acquired business is inherently more speculative in nature than other guidance as management will, necessarily, be less familiar with the business, procedures, and operations of the acquired business. Similarly, guidance offered in periods of extreme uncertainty such as geopolitical tensions, in particular Russia’s incursion into Ukraine, is inherently more speculative in nature than guidance offered in periods of relative stability. Accordingly, any guidance with respect to our projected financial performance is necessarily only an estimate of what management believes is realizable as of the date the guidance is given. Actual results will vary from the guidance and the variations may be material. Investors should also recognize that the reliability of any forecasted financial data will diminish the farther in the future that the data is forecasted.
Actual operating results may be different from our guidance, and such differences may be adverse and material. In light of the foregoing, investors are urged to put the guidance in context and not to place undue reliance on it. In addition, the market price of our common stock may reflect various market assumptions as to the accuracy of our guidance. If our actual results of operations fall below the expectations of investors or securities analysts, the price of our common stock could decline substantially.
Our quarterly results of operations have fluctuated and are likely to continue to fluctuate. As a result, we may fail to meet or exceed the expectations of investors or securities analysts, which could cause our stock price to decline.
Our quarterly operating results, including the levels of our revenue, gross margin, net loss before income taxes and cash flows, may fluctuate as a result of a variety of factors, including adverse macroeconomic conditions, the product mix that we sell, the relative sales related to our platforms and solutions and other factors which are outside of our control. If our quarterly revenue or results of operations fall below the expectations of investors or securities analysts, the price of our common stock could decline substantially. Fluctuations in our results of operations may be due to a number of factors, including:
•the portion of our revenue attributable to IoT Connectivity and IoT Services, including hardware and other sales;
•our ability to manage the businesses we have acquired, and to integrate and manage any future acquisitions of businesses;
•fluctuations in demand, including due to seasonality or broader economic factors, for our platforms and solutions;
•changes in pricing by us in response to competitive pricing actions;
•the ability of our hardware vendors to continue to manufacture high-quality products and to supply sufficient components and products to meet our demands;
•the timing and success of introductions of new solutions, products or upgrades by us or our competitors and the entrance of new competitors;
•changes in our business and pricing policies or those of our competitors;
•our ability to control costs, including our operating expenses and the costs of the hardware we purchase;
•changes in U.S. trade policies, including new or potential tariffs or penalties on imported products;
•competition, including entry into the industry by new competitors and new offerings by existing competitors;
•issues related to introductions of new or improved products such as supply chain disruptions or shortages of prior generation products or short-term decreased demand for next generation products;
•perceived or actual problems with the security, privacy, integrity, reliability, quality or compatibility of our solutions, including those related to security breaches in our systems, our subscribers’ systems, unscheduled downtime, or outages;
•the amount and timing of expenditures, including those related to expanding our operations, including through acquisitions, increasing research and development, introducing new solutions or paying litigation expenses;
•the ability to effectively manage growth within existing and new markets domestically and abroad;
•changes in the payment terms for our platforms and solutions;
•collectability of receivables due from customers and other third parties;
•the strength of regional, national and global economies; and
•the impact of natural disasters such as earthquakes, hurricanes, fires, power outages, floods, epidemics, pandemics and public health crises, including COVID-19, and other catastrophic events or man-made problems such as terrorism, civil unrest and actual or threatened armed conflict, or global or regional economic, political and social conditions.
Fluctuations in our quarterly operating results may be particularly pronounced in the current economic environment. Due to the foregoing factors and the other risks discussed in this Annual Report, you should not rely on quarter-to-quarter comparisons of our results of operations as an indication of our future performance. For the same reason, you should not consider our recent revenue growth and changes in Adjusted EBITDA or results of one quarter as indicative of our future performance. See the “Non-GAAP Measures” section of Item 7. “Management’s Discussion and Analysis of Financial Condition and Results of Operations” for a discussion of the limitations of Adjusted EBITDA and a reconciliation of Adjusted EBITDA from net loss, the most directly comparable GAAP measurement, for the years ended December 31, 2022 and, 2021.
Downturns in general economic and market conditions and reductions in spending may reduce demand for our platforms and solutions, which could harm our revenue, results of operations and cash flows.
Our revenue, results of operations and cash flows depend on the overall demand for our platforms and solutions. Negative macroeconomic conditions in the general economy both in the United States and abroad, inflation, changes in gross domestic product growth, financial and credit market fluctuations, energy costs, international trade relations and other geopolitical tensions, the availability and cost of credit, rising interest rates and the global housing and mortgage markets could cause a decrease in consumer discretionary spending and business investment and diminish growth expectations in the U.S. economy and abroad. Further broadening or protracted extension of the economic downturn could have a negative impact on our business revenue, results of operations and cash flows.
Risks Related to Our Products and Technology
The 5G market may take longer to materialize than we expect or, if it does materialize rapidly, we may not be able to meet the development schedule and other customer demands.
The growth of the 5G market and its emerging standards, including the newly defined 5G NR standard, is accelerating and we believe that we are at the forefront of this newly emerging standard. However, this market may take longer to materialize than we expect, which could delay important commercial milestones. Even if the market does materialize at the rapid pace that we are expecting, we may have difficulties meeting the aggressive timing expectations of our current customers and getting our target products to market on time to meet the demands of our target customers. We may have difficulties meeting the market and technical specifications and timelines. It is also possible that offerings developed by others will render our offerings and initiatives noncompetitive or obsolete. Additionally, our target customers have no guarantee that the configurations of their respective target products will be successful or that they can reach the appropriate target client base to provide a positive return on the research and development investments we are making in the 5G market. We are pursuing 5G opportunities in the United States and abroad. 5G markets outside of the United States will develop at different rates and we will encounter these challenges to varying degrees in different countries. Failure to manage challenges related to 5G markets and opportunities could adversely affect our business, financial condition and results of operations.
Our growth depends in part on our ability to extend our technologies and products into new and expanded areas, including 5G. Our development and investments in these new technologies, may not generate operating income or contribute to future results of operations that meet our expectations.
We continue to invest significant resources toward advancements primarily in support of 4G- and 5G-based technologies. We also invest in new and expanded product areas by utilizing our existing technical and business expertise and through acquisitions or other strategic transactions. Our future growth depends on our ability to develop leading and cost-effective technologies and products for these new and expanded areas and developing technologies. In particular, our growth depends significantly on our ability to develop and commercialize products using 5G technologies. In January 2022, several major U.S. wireless carriers had to temporarily delay the deployment of new wireless facilities that were meant to facilitate the evolution of their wireless networks to 5G technology in response to concerns of the aviation industry that those 5G facilities could interfere with equipment used for aviation and could impede aviation safety. Although the FCC, FAA, the wireless telecommunications industry and the aviation industry are working on solutions to alleviate those concerns, the timing for resolution is unclear, and such uncertainty could further impact the amount of and timing of 5G network investment. To the extent the 5G rollout is further delayed due to interference with existing technologies, or adoption of 5G is slowed as a result of such concerns, we may incur significant costs and asset impairments, which could adversely affect our business, financial condition, and results of operations.
If we are unable to support customers with low latency and/or high throughput IoT use cases, our revenue growth and profitability will be harmed.
As wireless networks have evolved to support higher speeds, IoT devices have included more advanced capabilities such as video, real-time event logging, edge compute services (where computing is completed on or near the site of the sensor) and voice controls. As a result, customers have developed IoT applications that consume more network resources and require much lower network latency. In order to support these new customers and the
increasing number of 5G use cases, we must continue to make significant investments in network capacity, infrastructure and edge virtualization solutions. The timely deployment of higher capacity infrastructure and edge virtualization to support high throughput, low latency IoT applications is critical to keeping and attracting key customers, the failure of which could adversely affect our business, financial condition, and results of operations.
Our products are highly technical and may contain undetected errors, product defects, security vulnerabilities, or software errors.
Our products and solutions, including our software products, are highly technical and complex and, when deployed, may contain errors, defects, or security vulnerabilities including but not limited to vulnerabilities resulting from the use of third-party hardware and software. We must develop our products quickly to keep pace with the rapidly changing market, and we have a history of frequently introducing new products. Products and services as sophisticated as ours could contain undetected errors or defects, especially when first introduced or when new models or versions are released. Such occurrences could result in damage to our reputation, lost revenue, diverted development resources, increased customer service and support costs, warranty claims, and litigation.
We warrant that our products will be free of defects for various periods of time, depending on the product. In addition, certain of our contracts include epidemic failure clauses. If invoked, these clauses may entitle the customer to return or obtain credits for products and inventory, or to cancel outstanding purchase orders even if the products themselves are not defective.
Errors, viruses, or bugs may be present in software or hardware that we acquire or license from third parties and incorporate into our products or in third party software or hardware that our customers use in conjunction with our products. Our customers’ proprietary software and network firewall protections may corrupt data from our products and create difficulties in implementing our solutions.
Changes to third party software or hardware that our customers use in conjunction with our software could also render our applications inoperable. Any errors, defects, or security vulnerabilities in our products or any defects in, or compatibility issues with, any third-party hardware or software or customers’ network environments discovered after commercial release could result in loss of revenue or delay in revenue recognition, loss of customers, theft of trade secrets, data or intellectual property and increased service and warranty cost, any of which could adversely affect our business, financial condition, and results of operations.
Undiscovered vulnerabilities in our products alone or in combination with third party hardware or software could expose them to hackers or other unscrupulous third parties who develop and deploy viruses, and other malicious software programs that could attack our products. Actual or perceived security vulnerabilities in our products could harm our reputation and lead some customers to return products, to reduce or delay future purchases, or use competitive products.
If there are interruptions, outages or performance degradation problems associated with the network infrastructure used to provide our services, customers may experience service outages, which may impact our reputation and future sales.
Our continued success depends, in part, on our ability to provide highly available services to our customers. The majority of our current and future customers expect to use our services 24 hours a day, seven days a week, without interruption or degradation of performance. Since a large majority of customer network traffic routes through hardware managed by us, any outage or performance problem that occurs within this infrastructure could impair the ability of our customers to transmit wireless data traffic to our destination servers, which could negatively impact the customers’ IoT devices or solutions. Potential outages and performance problems may occur due to a variety of factors, including hardware failure, equipment configuration changes, capacity constraints, human error and introduction of new functionality. Additionally, we depend on services from various third parties to support IoT networks and platforms. If a third party experiences a service outage, a product defect or bug, or performance degradation, such failures could interrupt customers’ ability to use our services, which could also negatively affect their perception of our service reliability. Our services are hosted in our third party data centers and any outages in these centers from any source including catastrophic events such as terrorist attack, flood, power failure, earthquake,
etc. can impact the availability of our services, which could adversely affect our business, financial condition, and results of operations.
Our internal and customer-facing systems, and systems of third parties we rely upon, may be subject to cybersecurity breaches, disruptions, ransom attacks or delays.
A cybersecurity incident in our own systems or the systems of our third-party providers may compromise the confidentiality, integrity, or availability of our own internal data, the availability of our products and websites designed to support our customers, or our customer data. Computer hackers, ransom attacks, foreign governments, or cyber terrorists may attempt to or succeed in penetrating our network security and our website. The recent discovery of wide-scale cybersecurity intrusions into U.S. government and private company computer networks by alleged Russian state actors underscores the ongoing threat posed by sophisticated and foreign state-sponsored attacks. The frequency of ransomware and malware attacks has also been increasing over time. Unauthorized access and theft to our proprietary business information or customer data or rendering them unusable for our use through encryption, may be accomplished through break-ins, sabotage, theft of IoT data streams and transmissions, breach of our secure network by an unauthorized party, computer viruses, computer denial-of-service attacks, employee theft or misuse, ransomware attacks, breach of the security of the networks of our third-party providers, or other misconduct. Additionally, outside parties may attempt to fraudulently induce employees or users to disclose sensitive or confidential information in order to gain access to data.
Despite our efforts to maintain the security and integrity of our systems, it is impossible to eliminate this risk. Because the techniques used by computer hackers who may attempt to penetrate and sabotage our network security or our website change frequently, they may take advantage of weaknesses in third-party technology or standards of which we are unaware or that we do not control and may not be recognized until long after they have been launched against a target. We may be unable to anticipate or counter these techniques. It is also possible that unauthorized access to customer data or confidential information may be obtained through inadequate use of security controls by customers, vendors, or business partners. Efforts to prevent hackers from disrupting our service or otherwise accessing our systems are expensive to develop, implement, and maintain. Such efforts require ongoing monitoring and updating as technologies change and efforts to overcome security measures become more sophisticated and may limit the functionality of, or otherwise adversely impact our service offering and systems. A cybersecurity incident affecting our systems may also result in theft of our intellectual property, proprietary data, or trade secrets, which would compromise our competitive position, reputation, and operating results. We also may be required to notify regulators about any actual or perceived personal data breach (including the EU Lead Data Protection Authority) as well as the individuals who are affected by the incident within strict time periods.
The systems we rely upon also remain vulnerable to damage or interruption from a number of other factors, including access to the internet, the failure of our network or software systems, or significant variability in visitor traffic on our product websites, earthquakes, floods, fires, power loss, telecommunication failures, computer viruses, human error, and similar events or disruptions. Some of our systems are not fully redundant, and our disaster recovery planning is not sufficient for all eventualities. Our systems are also subject to intentional acts of vandalism. Despite any precautions we may take, the occurrence of a natural disaster, a decision by any of our third-party hosting providers to close a facility we use without adequate notice for financial or other reasons, or other unanticipated problems at our hosting facilities could cause system interruptions and delays, and result in loss of critical data and lengthy interruptions in our services.
We rely on our information systems and those of third parties for activities such as processing customer orders, delivery of products, hosting and providing services and support to our customers, billing and tracking our customers, hosting and managing our customer data, and otherwise running our business. Any disruptions or unexpected incompatibilities in our information systems and those of the third parties upon whom we rely could have a significant impact on our business.
An increasing portion of our revenue comes from subscription solutions and other hosted services in which we store, retrieve, communicate, and manage data that is critical to our customers’ business systems. Disruption of our systems that support these services and solutions could cause disruptions in our customers’ systems and in the businesses that rely on these systems. Any such disruptions could harm our reputation, create liabilities for our
customers, hurt demand for our services and solutions, and adversely impact our business, financial condition, and results of operations.
We may become involved in litigation that could materially adversely affect our business, financial condition, results of operations, and prospects.
We may become a party to litigation and disputes related to our intellectual property, business practices, regulatory compliance, products, or platform. While we intend to vigorously defend these lawsuits, litigation can be costly and time-consuming, divert the attention of management and key personnel from our business operations, and dissuade prospective customers from subscribing to our products. We may need to settle litigation and disputes on terms that are unfavorable to us, or we may be subject to an unfavorable judgment that may not be reversible upon appeal. The terms of any settlement or judgment may require us to cease some or all of our operations or pay substantial amounts to the other party. In addition, our customer agreements include provisions requiring us to indemnify our customers against liabilities if our products infringe a third-party’s intellectual property rights, and we have negotiated other specific indemnities with certain customers, in each case, which could require us to make payments to such customers. During the course of any litigation or dispute, we may make announcements regarding the results of hearings and motions and other interim developments. If securities analysts and investors consider these announcements negative, our stock price may decline. With respect to any intellectual property rights claim, we may have to seek a license to continue practices found to be in violation of third-party rights, which may not be available on reasonable terms and may significantly increase our operating expenses. A license to continue such practices may not be available to us, and we may be required to develop alternative non-infringing technology or practices or discontinue our practices. The development of alternative, non-infringing technology or practices could require significant effort and expense. Any of the above could materially adversely affect our business, financial condition, and results of operations.
Risks Related to Customers and Demand for Our Solutions
The loss of our large customers, particularly our single largest customer, could significantly impact our revenue and profitability.
Our largest customer in the year ended December 31, 2022, was approximately 11% of our total revenue in that same period and while we maintain a good relationship with the customer at this moment, its potential loss could significantly impact our revenue and profitability. Our next largest customer in the year ended December 31, 2022, was approximately 8% of our total revenue in that same period and while its potential loss would not be as significant as the loss of the largest customer, it usually takes many years to win and grow customers to this level of revenue. The loss of one or several significant customers could adversely affect our business, financial condition, and results of operations.
Transitions of cellular network technologies from 2G/3G to LTE, Cat-M, NB-IoT or 5G or other cellular telecommunications technologies could impact our revenue due to the loss of subscribers or reduced pricing.
In the United States, the major carriers phased out their 2G and 3G networks by the end of 2022. As of December 31, 2022, we estimate that we have approximately 0.1 million connections that operate on 2G and 3G networks in the United States. European carriers have also announced their intentions to begin 2G and 3G network shutdowns starting in 2025.
While we have strong relationships with many of the affected customers and expects to retain most of the connections which will not be retired upon the switch to 4G or 5G technologies, some of these connections may be lost as a result of competitive bidding processes. LTE rate plans are typically lower in price than legacy 2G and 3G rate plans. As a result, the phase out of 2G and 3G resulted in lower revenue per unit and/or lower revenue for us. While the projected impact of this is incorporated in our projections, if the projected impact of this phase out is more significant than projected, including if we lose more connections than anticipated or if LTE rate plans are priced lower than currently expected, this transition could have an adverse effect on our business, financial condition, and results of operations.
Our inability to adapt to rapid technological change in our markets could impair our ability to remain competitive and adversely affect the results of operations.
All of the markets in which we operate are characterized by rapid technological change, frequent introductions of new products, services and solutions and evolving customer demands. In addition, we are affected by changes in the many industries related to the products or services we offer, including Connectivity services and IoT Solutions offered to our Connected Health, Fleet Management, Communication Services, Asset management and industrial verticals. As the technologies used in each of these industries evolve, we will face new integration and competition challenges. For example, eSIM and eUICC standards may evolve and we will have to evolve its technology to such standards. If we are unable to adapt to rapid technological change, it could adversely affect our business, financial condition, and results of operations and our ability to remain competitive.
Additionally, the deployment of 5G network technology is subject to a variety of risks, including those related to equipment and spectrum availability, unexpected costs, and regulatory permitting requirements that could cause deployment delays or network performance issues. These issues could result in significant costs or reduce the anticipated benefits of the enhancements to our networks. If our services or solutions fail to gain acceptance in the marketplace, or if costs associated with the implementation and introduction of these services or solutions materially increase, our ability to retain and attract customers could be adversely affected.
We may not be able to retain and increase sales to our existing customers, which could negatively impact our financial results.
We generally seek to license our platform and solutions pursuant to customer subscriptions. However, our customers have no obligation to maintain the subscription and can often terminate with 30 days’ notice. We also actively seek to sell additional solutions to our existing customers. If our efforts to satisfy our existing customers are not successful, we may not be able to retain them or sell additional functionality to them and, as a result, our revenue and ability to grow could be adversely affected. Customers may choose not to renew their subscriptions for many reasons, including the belief that our service is not required for their business needs or is otherwise not cost-effective, a desire to reduce discretionary spending or a belief that our competitors’ services provide better value. Additionally, our customers may not renew for reasons entirely out of our control, such as the dissolution of their business or an economic downturn in their industry. A significant increase in our churn rate would have an adverse effect on our business, financial condition, and operating results.
A part of our growth strategy is to sell additional new features and solutions to our existing customers. Our ability to sell new features to customers will depend in significant part on our ability to anticipate industry evolution, practices and standards and to continue to enhance existing solutions or introduce or acquire new solutions on a timely basis to keep pace with technological developments both within our industry and in related industries, and to remain compliant with any regulations mandated by federal agencies or state-mandated or foreign government regulations as they pertain to our customers. However, we may prove unsuccessful either in developing new features or in expanding the third-party software and products with which our solutions integrate. In addition, the success of any enhancement or new feature depends on several factors, including the timely completion, introduction and market acceptance of the enhancement or feature. Any new solutions we develop or acquire might not be introduced in a timely or cost-effective manner and might not achieve the broad market acceptance necessary to generate significant revenue. If any of our competitors implement new technologies before we are able to implement them or better anticipate the innovation and integration opportunities in related industries, those competitors may be able to provide more effective or cheaper solutions than ours.
The marketability of our products may suffer if wireless telecommunications operators do not deliver acceptable wireless services.
The success of our business depends, in part, on the capacity, affordability, reliability and prevalence of wireless data networks provided by wireless telecommunications operators and on which our products and solutions operate.
Currently, various wireless telecommunications operators, either individually or jointly with us, sell our products in connection with the sale of their wireless data services to their customers. Growth in demand for
wireless data access may be limited if, for example, wireless telecommunications operators cease or materially curtail operations, fail to offer services that customers consider valuable at acceptable prices, change the terms of trade to us including offering us meaningful volume discounts without unduly high volume commitments, fail to maintain sufficient capacity to meet the demand for wireless data access, delay the expansion of their wireless networks and services, fail to offer and maintain reliable wireless network services or fail to market their services effectively. Lack of demand for wireless data access could adversely affect our business, financial condition, and results of operations.
Reduction in regulation in certain markets may adversely impact demand for certain of our solutions by reducing the necessity for, or desirability of, our solutions.
Regulatory compliance and reporting are driven by legislation and requirements, which are often subject to change, from regulatory authorities in nearly every jurisdiction globally. For example, in the United States, fleet operators can face numerous complex regulatory requirements, including mandatory Compliance, Safety and Accountability driver safety scoring, hours of service, compliance and fuel tax reporting. The reduction in regulation in certain markets may adversely impact demand for certain of our solutions, which could materially and adversely affect our business, financial condition and results of operations. Conversely, an increase in regulation could increase our cost of providing services, which could adversely affect our business, financial condition, and results of operations.
Investment in new business strategies and acquisitions could result in operating difficulties, dilution and other consequences that could harm our business, financial condition, and operating results.
New business strategies and acquisitions are important elements of our strategy and use of capital, and these transactions could be material to our financial condition and operating results. We expect to continue to evaluate and enter into discussions regarding a wide array of such potential strategic transactions, which could create unforeseen operating difficulties and expenditures. Some of the areas where we face risk include:
•Diversion of management time and focus from operating our business to challenges related to acquisitions and other strategic transactions:
•Failure to successfully integrate the acquired operations, technologies, services and personnel (including cultural integration and retention of employees) and further develop the acquired business and technology:
•Implementation or remediation of controls, procedures, and policies at the acquired company:
•Integration of the acquired company's accounting and administrative systems, and the coordination of product, engineering, and sales and marketing functions;
•Transition of operations, users, and customers onto our existing platforms;
•In the case of foreign acquisitions, the need to integrate operations across different cultures and languages and to address the particular economic, currency, political, and regulatory risks associated with specific countries;
•Failure to accomplish commercial, strategic or financial objectives with respect to investments;
•Failure to realize the value of investment due to lack of liquidity;
•Liability for activities of the acquired company before the acquisition, including patent and trademark infringement claims, data privacy and security issues, violations of laws, commercial disputes, tax liabilities, warranty claims, product liabilities, and other known and unknown liabilities; and
•Litigation or other claims in connection with the acquired company, including claims from terminated employees, customers, former stockholders, or other third parties.
Our failure to address these risks or other problems encountered in connection with our past or future acquisitions and other strategic transactions could cause us to fail to realize their anticipated benefits, incur unanticipated liabilities, and harm our business generally.
Our acquisitions and other strategic transactions could also result in dilutive issuance of our equity securities, the incurrence of debt, contingent liabilities or amortization expenses or impairment of goodwill and/or long-lived assets, and restructuring charges, any of which could harm our financial condition and operating results. Also, the anticipated benefits or value of our acquisitions and other strategic transactions may not materialize.
Risks Related to Our Intellectual Property
We are dependent on proprietary technology, which could result in litigation that could divert significant valuable resources.
Our future success and competitive position are dependent upon our proprietary technology. Despite our efforts to protect our intellectual property, unauthorized parties may attempt to copy or otherwise obtain our software or develop software with the same functionality or to obtain and use information that we regard as proprietary. Others may develop technologies that are similar or superior to our technology or duplicate our technology. In addition, effective copyright, patent, and trade secret protection may be unavailable, limited, or not applied for in certain countries. The steps taken by us to protect our technology might not prevent the misappropriation of such technology.
The value of our products relies substantially on our technical innovation in fields in which there are many current patent filings. Third parties may claim that we or our customers (some of whom are indemnified by us) are infringing their intellectual property rights. For example, individuals and groups may purchase intellectual property assets for the purpose of asserting claims of infringement and attempting to extract settlements from us or our customers. The number of these claims has increased in recent years. As new patents are issued or are brought to our attention by the holders of such patents, it may be necessary for us to secure a license from such patent holders, redesign our products, or withdraw products from the market. In addition, the legal costs and engineering time required to safeguard intellectual property or to defend against litigation could become a significant expense of operations. Any such litigation could require us to incur substantial costs and divert significant valuable resources, including the efforts of our technical and management personnel, which could adversely affect our business, financial condition and results of operations.
If we are unable to protect our intellectual property and proprietary rights, our competitive position and our business could be harmed.
We rely on a combination of intellectual property laws, trade secrets, confidentiality procedures and contractual provisions to protect our intellectual property and proprietary rights. Monitoring unauthorized use of our intellectual property is difficult and costly. The steps we have taken to protect our proprietary rights may not be adequate to prevent the misappropriation of our intellectual property. We may not be able to detect unauthorized use of, or take appropriate steps to enforce, our intellectual property rights. Our competitors may also independently develop similar technology. In addition, the laws of many countries do not protect our proprietary rights to as great an extent as do the laws of the United States. Any failure by us to meaningfully protect our intellectual property could result in competitors offering products that incorporate our most technologically advanced features, which could seriously reduce demand for our products and solutions. In addition, we may in the future need to initiate infringement claims or litigation. Litigation, whether we are a plaintiff or a defendant, can be expensive, time consuming and may divert the efforts of our technical staff and managerial personnel, which could adversely affect our business, financial condition and results of operations, whether or not such litigation results in a determination favorable to us.
An assertion by a third party that we are infringing its intellectual property could subject us to costly and time-consuming litigation or expensive licenses and our business could be harmed.
The technology industries involving mobile data communications, IoT devices, software and services are characterized by the existence of a large number of patents, copyrights, trademarks and trade secrets and by frequent litigation based on allegations of infringement or other violations of intellectual property rights. Much of this
litigation involves patent holding companies or other adverse patent owners who have no relevant product revenue of their own, and against whom our own patent portfolio may provide little or no deterrence. One or more patent infringement lawsuits from non-practicing entities may be brought against us or our subsidiaries every year in the ordinary course of business.
We cannot assure you that we or our subsidiaries will prevail in any current or future intellectual property infringement or other litigation given the complex technical issues and inherent uncertainties in such litigation. Defending such claims, regardless of their merit, could be time-consuming and distracting to management, result in costly litigation or settlement, cause development delays, or require us or our subsidiaries to enter into royalty or licensing agreements. In addition, we or our subsidiaries could be obligated to indemnify our customers against third parties’ claims of intellectual property infringement based on our products or solutions. If our products or solutions violate any third-party intellectual property rights, we could be required to withdraw them from the market, re-develop them or seek to obtain licenses from third parties, which might not be available on reasonable terms or at all. Any efforts to re-develop our products or solutions, obtain licenses from third parties on favorable terms or license a substitute technology might not be successful and, in any case, might substantially increase our costs and harm our business, financial condition and operating results. Withdrawal of any of our products or solutions from the market could harm our business, financial condition and operating results.
In addition, we incorporate open-source software into our products and solutions. Given the nature of open-source software, third parties might assert copyright and other intellectual property infringement claims against us based on our use of certain open-source software programs. The terms of many open-source licenses to which we are subject have not been interpreted by U.S. courts or courts of other jurisdictions, and there is a risk that those licenses could be construed in a manner that imposes unanticipated conditions or restrictions on our ability to commercialize our products and solutions. In that event, we could be required to seek licenses from third parties in order to continue offering our products and solutions, to re-develop our solutions, to discontinue sales of our solutions, or to release our proprietary software source code under the terms of an open-source license, any of which could adversely affect our business, financial condition, and results of operations.
Risks Related to Competition
The market for the products and services that we offer is rapidly evolving and highly competitive. We may be unable to compete effectively.
The market for the products and services that we offer is rapidly evolving and highly competitive. We expect competition to continue to increase and intensify, especially in the 5G market. Many of our competitors or potential competitors have significantly greater financial, technical, operational and marketing resources than we do. These competitors, for example, may be able to respond more rapidly or more effectively than we can to new or emerging technologies, changes in customer requirements, supplier-related developments, or a shift in the business landscape. They also may devote greater or more effective resources than we do to the development, manufacture, promotion, sale, and post-sale support of their respective products and services.
Many of our current and potential competitors have more extensive customer bases and broader customer, supplier and other industry relationships that they can leverage to establish competitive dealings with many of our current and potential customers. Some of these companies also have more established and larger customer support organizations than we do. In addition, these companies may adopt more aggressive pricing policies or offer more attractive terms to customers than they currently do, or than we are able to do. They may bundle their competitive products with broader product offerings and may introduce new products, services and enhancements. Current and potential competitors might merge or otherwise establish cooperative relationships among themselves or with third parties to enhance their products, services or market position. In addition, at any time any given customer or supplier of ours could elect to enter our then existing line of business and thereafter compete with us, whether directly or indirectly. As a result, it is possible that new competitors or new or otherwise enhanced relationships among existing competitors may emerge and rapidly acquire significant market share to the detriment of our business. Our products compete with a variety of solutions, including other Subscription-based IoT platforms and solutions.
Our current competitors include:
Connectivity services: telecom carriers such as T-Mobile and Vodafone; Mobile Virtual Network Operators such as Aeris and Wireless Logic.
IoT Solutions and Analytics: device management services providers such as Velocitor and Futura, fleet management SaaS providers such as Fleetmatics and GPS Trakit, and analytics services providers such as Galooli and Intellisite.
We expect our competitors to continue to improve the features and performance of their current products and to introduce new products, services and technologies which, if successful, could reduce our sales and the market acceptance of our products, generate increased price competition and make our products obsolete. For our products to remain competitive, we must, among other things, continue to invest significant resources (financial, human and otherwise) in, among other things, research and development, sales and marketing, and customer support. We cannot be sure that we will have or will continue to have sufficient resources to make these investments or that we will be able to make the technological advances in the marketplace, meet changing customer requirements, achieve market acceptance and respond to our competitors’ products. If we are unable to compete effectively, it could adversely affect our business, financial condition and results of operations.
We may not be able to maintain and expand our business if we are not able to hire, retain and manage additional qualified personnel.
Our success in the future depends in part on the continued contribution of our executive, technical, engineering, sales, marketing, operations and administrative personnel. Recruiting and retaining skilled personnel in the industries in which we operate, including engineers and other technical staff and skilled sales and marketing personnel, is highly competitive. In addition, in the event that we acquire another business or company, the success of any acquisition will depend in part on our retention and integration of key personnel from the acquired company or business.
Although we may enter into employment agreements with members of our senior management and other key personnel, these arrangements do not prevent any of our management or key personnel from leaving us. If we are not able to attract or retain qualified personnel in the future, or if we experience delays in hiring required personnel, particularly qualified technical and sales personnel, we may not be able to maintain and expand our business.
Risks Related to Developing and Delivering Our Solutions
We are dependent on telecommunications carriers to provide our IoT Connectivity Services and a disruption in one or more of these relationships could significantly adversely impact our business.
Our IoT Connectivity services are built on top of cellular connectivity provided by large telecommunications carriers and while we have a large number of carrier relationships, revenue derived from connectivity built on top of cellular networks provided by our top three carrier relationships are approximately 40% of the business for the year ended December 31, 2022. Our inability to keep an on-going contractual relationship with our existing or desired future telecommunications carrier partners or to maintain favorable terms of trade with them including competitive pricing, reasonable or no volume commitments, payment terms, access to latest cellular and network technologies including 5G, eSIMs and eUICC, could adversely affect our ability to sell our connectivity services to customers. Our contracts with large telecommunications carriers are not long term, and so are subject to frequent renegotiation. The outcome of any renegotiation cannot be guaranteed. Additional consolidation of carriers could further reduce our bargaining power in negotiations with carriers, which could adversely affect our business, financial condition, and results of operations.
We are dependent on a limited number of suppliers for certain critical components to our solutions; a disruption in our supply chain could adversely affect our revenue and results of operations.
Our current reliance on a limited group of suppliers involves risks, including a potential inability to obtain an adequate supply of required products or components to meet customers’ IoT Solutions delivery requirements, a risk
that we may accumulate excess inventories if we inaccurately forecast demand for our products, reduced control over pricing and delivery schedules, discontinuation of or increased prices for certain components, and economic conditions that may adversely impact the viability of our suppliers and contract manufacturers. Any disruption in our supply chain could reduce our revenue and adversely impact our financial results. Such a disruption could occur as a result of any number of events, including, but not limited to, increases in wages that drive up prices or labor stoppages, the imposition of regulations, quotas or embargoes on components, a scarcity of, or significant increase in the price of, required electronic components for our products, trade restrictions, tariffs or duties, fluctuations in currency exchange rates, transportation failures affecting the supply chain and shipment of materials and finished goods, third party interference in the integrity of the products sourced through the supply chain, the unavailability of raw materials, severe weather conditions, natural disasters, civil unrest, military conflicts, geopolitical developments, war or terrorism, including the ongoing conflict in Ukraine, regional or global pandemics like COVID-19, and disruptions in utility and other services. In recent months global supply chains have been disrupted by COVID-19 and other factors, resulting in shortages of a number of goods, including chips necessary to produce a wide variety of devices. To the extent we are unable to obtain adequate supplies of chips, this could impact our brand as well as our results of operations. Any inability to obtain adequate deliveries or any other circumstance that would require us to seek alternative sources of supply or to manufacture, assemble, and test such components internally could significantly delay our ability to ship our products, which could damage relationships with current and prospective customers and could harm our reputation and brand and could adversely affect our business, financial condition, and results of operations.
In response to the military conflict between Russia and Ukraine, the United States and other North Atlantic Treaty Organization member states, as well as non-member states, announced targeted economic sanctions on Russia, including certain Russian citizens and enterprises, and the continuation of the conflict may trigger additional economic and other sanctions. The potential impacts of the conflict and related sanctions could include supply chain and logistics disruptions, macro financial impacts resulting from the exclusion of Russian financial institutions from the global banking system, volatility in foreign exchange rates and interest rates, inflationary pressures on raw materials and energy and heightened cybersecurity threats. Although to date our operations have not been directly impacted by the conflict, we do not and cannot know if the conflict, which remains ongoing, could escalate and result in broader economic and security concerns which could adversely affect our business, financial condition or results of operations.
Natural disasters, public health crises, such as the COVID-19 pandemic, political crises, climate change and other catastrophic events or other events outside of our control could damage our facilities or the facilities of third parties on which we depend, and could impact consumer spending.
If any of our facilities or the facilities of our third-party service providers including for example our telecommunications carrier partners, other suppliers of products that are components of our IoT Solutions, or our data center providers, or our other partners are affected by natural disasters, such as earthquakes, tsunamis, wildfires, power shortages, floods, public health crises (such as pandemics and epidemics), political crises (such as terrorism, war, political instability or other conflict), climate change or other events outside our control, including a cyberattack, our critical business or IT systems could be destroyed or disrupted and our ability to conduct normal business operations and our revenue and operating results could be adversely affected. For example, the COVID-19 pandemic has impacted, and may continue to have an impact on our operations, including the implementation of various containment measures, such as government-imposed shelter-in-place orders, quarantines, national or regional lockdowns, travel restrictions and other public health safety measures. Specifically, in response to the spread of COVID-19, and in accordance with direction from government authorities, we have, for example, limited the number of such personnel that can be present at our facilities at any one time, mandated the usage of face masks in our facilities, limited the maximum numbers of people allowed in rooms at one time and requested that many of our personnel work remotely. Our business also may be impacted by changes in the severity of the COVID-19 pandemic at different times in the various cities and regions where we operate and offer services, and by challenges faced in implementing nationwide COVID-19 vaccinations. Even after the COVID-19 pandemic has moderated and the business and social distancing restrictions have eased, we may continue to experience similar adverse effects to our business. Moreover, these types of events could negatively impact consumer spending in the impacted regions
or, depending upon the severity, globally, which could adversely affect our business, financial condition and results of operations.
Our solutions integrate with third-party technologies and if our solutions become incompatible with these technologies, our solutions would lose functionality and our customer acquisition and retention could be adversely affected.
Our solutions integrate with third-party software and devices to allow our solutions to perform key functions. Errors, viruses or bugs may be present in third-party software that our customers use in conjunction with our solutions. Changes to third-party software that our customers use in conjunction with our solutions could also render our solutions inoperable. Customers may conclude that our software is the cause of these errors, bugs or viruses and terminate their subscriptions. The inability to easily integrate with, or any defects in, any third-party software could result in increased costs, or in delays in software releases or updates to our products until such issues have been resolved, which could adversely affect our business, financial condition, results of operations, and future prospects and could damage our reputation.
Any significant disruption in service on our websites or in our computer systems could damage our reputation and result in a loss of customers, which would harm our business and operating results.
Our brand, reputation, and ability to attract, retain, and serve our customers are dependent upon the reliable performance of our services and our customers’ ability to access our solutions at all times. Our customers rely on our solutions to make operating decisions related to their businesses, as well as to measure, store and analyze valuable data regarding their businesses. Our solutions are vulnerable to interruption and our data centers are vulnerable to damage or interruption from human error, intentional bad acts, computer viruses or hackers, earthquakes, hurricanes, floods, fires, war, terrorist attacks, power losses, hardware failures, systems failures, telecommunications failures, and similar events, any of which could limit our customers’ ability to access our solutions. Prolonged delays or unforeseen difficulties in connection with adding capacity or upgrading our network architecture may cause our service quality to suffer. Any event that significantly disrupts our service or exposes our data to misuse could damage our reputation and harm our business, financial condition and results of operations, including reducing our revenue, causing us to issue credits to customers, subjecting us to potential liability, increasing our churn rates, or increasing our cost of acquiring new customers.
Risks Related to International Operations
We face risks inherent in conducting business internationally, including compliance with international and U.S. laws and regulations that apply to our international operations.
We operate in many parts of the world that have experienced significant governmental corruption to some degree and, in certain circumstances, strict compliance with anti-bribery laws may conflict with local customs and practices. These laws and regulations include data privacy requirements, labor relations laws, tax laws, anti-competition regulations, import and trade restrictions, export control laws, and laws that prohibit corrupt payments to governmental officials or certain payments or remunerations to customers, including the U.S. Foreign Corrupt Practices Act (“FCPA”), the U.K. Bribery Act, and other anti-corruption laws that have recently been the subject of a substantial increase in global enforcement. Many of our products are subject to U.S. export law restrictions that limit the destinations and types of customers to which our products may be sold or that require an export license in connection with sales outside the United States. Given the high level of complexity of these laws, there is a risk that some provisions may be inadvertently or intentionally breached, for example through fraudulent or negligent behavior of individual employees, our failure to comply with certain formal documentation requirements or otherwise. Also, we may be held liable for actions taken by our local partners. Violations of these laws and regulations could result in fines, criminal sanctions against us, our officers or our employees, and prohibitions or conditions on the conduct of our business. Any such violations could include prohibitions or conditions on our ability to offer our products in one or more countries and could materially damage our reputation, our brand, our international expansion efforts, our ability to attract and retain employees, our business, financial condition and results of operations.
We may be affected by fluctuations in currency exchange rates.
We are potentially exposed to adverse as well as beneficial movements in currency exchange rates. Although the majority of our sales are transacted in U.S. dollars, expenses may be paid in local currencies. An increase in the value of the dollar could increase the real cost to our customers of our products in those markets outside the U.S. where we sell in dollars, and a weakened dollar could increase the cost of local operating expenses, procurement of raw materials from sources outside the United States, and overseas capital expenditures. We also conduct certain investing and financing activities in local currencies.
Risk Related to Regulation
We are subject to evolving privacy laws in the United States and other jurisdictions that are subject to potentially differing interpretations and which could adversely impact our business and require that we incur substantial costs.
Existing privacy-related laws and regulations in the United States and other countries are evolving and are subject to potentially differing interpretations, and various U.S. federal and state or other international legislative and regulatory bodies may expand or enact laws regarding privacy and data security-related matters. For example, the EU-U.S. Privacy Shield, a basis for data transfers from the EU to the U.S., was invalidated by the European Court of Justice, and we expect that the international transfer of personal data will present ongoing compliance challenges and complicate our business transactions and operations. Brexit, the United Kingdom’s withdrawal from the European Union, could also lead to further legislative and regulatory changes with regard to personal data transfers between the two territories. New privacy laws have come into effect in Brazil and New Zealand in 2020, and revisions of privacy laws are currently pending in countries like Canada and China. Some countries are considering or have passed legislation that requires local storage and processing of data, including geospatial data. In addition, in June 2018, California enacted the California Consumer Privacy Act (the “CCPA”), which took effect in January 2020 and has been amended by the California Privacy Rights Act (the “CPRA”) passed via ballot initiative in November 2020 and took effect in January 2023. The CCPA and CPRA, among other things, give California residents expanded rights to access and delete their personal information, opt out of certain personal information sharing, and receive detailed information about how their personal information is used. Other states and the U.S. Congress have introduced data privacy legislation that may impact our business. Data privacy legislation, amendments and revisions to existing data privacy legislation, and other developments impacting data privacy and data protection may require us to modify our data processing practices and policies, increase the complexity of providing our products and services, and cause us to incur substantial costs in an effort to comply. Failure to comply may lead to significant fines and business interruption and could adversely affect our business, financial condition and results of operations.
Changes in U.S. and foreign tax rules and regulations, or interpretations thereof, may give rise to potentially adverse tax consequences and adversely affect our financial condition.
We generally conduct our international operations through wholly-owned subsidiaries and report our taxable income in various jurisdictions worldwide based upon our business operations in those jurisdictions. Our corporate structure and associated transfer pricing policies contemplate the business flows and future growth into the international markets, and consider the functions, risks and assets of the various entities involved in the intercompany transactions. The amount of taxes we pay in different jurisdictions will depend to a significant degree on the application of the tax laws of the various jurisdictions to our international business activities, changes in tax rates, new or revised tax laws or interpretations of existing tax laws and policies and our ability to operate our business in a manner consistent with our corporate structure and intercompany arrangements, any or all of which could result in additional tax liabilities or increases in, or in the volatility of, our effective tax rate.
The taxing authorities of the jurisdictions in which we operate may challenge our methodologies for pricing intercompany transactions, which are required to be computed on an arm’s-length basis pursuant to the intercompany arrangements or disagree with our determinations as to the income and expenses attributable to specific jurisdictions. If such a challenge or disagreement were to occur, and our position was not sustained, we could be required to pay additional taxes, interest and penalties, which could result in one-time tax charges, higher
effective tax rates, reduced cash flows and lower overall profitability of our operations; in addition, it is uncertain whether any such adverse effects could be mitigated by corresponding adjustments in other jurisdictions with respect to the items affected. Our financial statements could fail to reflect adequate reserves to cover such a contingency.
Further changes in the tax laws of foreign jurisdictions could arise, including as a result of the base erosion and profit shifting project undertaken by the Organization for Economic Co-operation and Development, or the OECD. The OECD, which represents a coalition of member countries, has issued recommendations that, in some cases, make substantial changes to numerous long-standing tax positions and principles; many of these changes have been adopted or are under active consideration by OECD members and/or other countries.
Recent changes to the U.S. tax laws impact the tax treatment of foreign earnings by, among other things, creating limits on the ability of taxpayers to claim and utilize foreign tax credits, imposing minimum effective rates of current tax on certain classes of foreign income, and imposing additional taxes in connection with specified payments to related foreign recipients, among other items. While some of these changes may be adverse on a going forward basis, others may provide benefits that may be applicable to us. Due to our existing international business activities, which we anticipate expanding, any additional guidance such as U.S Treasury regulations and administrative interpretations may increase our worldwide effective tax rate and adversely affect our financial condition and operating results.
Effective January 1, 2022, the Tax Cuts and Jobs Act of 2017 requires us to capitalize, and subsequently amortize R&D expenses over five years for research activities conducted in the United States and over fifteen years for research activities conducted outside of the United States. This will result in a material increase to our U.S. income tax liability and net deferred tax assets and a material decrease to our cash flows provided from operations. The actual impact will depend on multiple factors, including the amount of R&D expenses incurred and whether the research activities are performed within or outside of the United States.
We are also subject to the examination of our tax returns by the U.S. Internal Revenue Service, or IRS, and other tax authorities. The final determination of tax audits and any related disputes could be materially different from our historical income tax provisions and accruals and could have an adverse effect on our financial statements for the period or periods for which the applicable final determinations are made.
Risks Related to Financial Reporting
We have incurred substantial indebtedness that may decrease our business flexibility, access to capital, and/or increase our borrowing costs, and we may still incur substantially more debt, which may adversely affect our operations and financial results.
As of December 31, 2022, we had $425 million of indebtedness outstanding. Our indebtedness may:
•limit our ability to obtain additional financing to fund future working capital, capital expenditures, business opportunities, acquisitions or other general corporate requirements;
•require a portion of our cash flows to be dedicated to debt service payments instead of other purposes, thereby reducing the amount of cash flows available for working capital, capital expenditures, business opportunities, acquisitions and other general corporate purposes;
•increase our vulnerability to adverse changes in general economic, industry and competitive conditions;
•expose us to the risk of increased interest rates as the majority of our borrowings are subject to variable rates of interest;
•place us at a competitive disadvantage compared to our less leveraged competitors; and
•increase our cost of borrowing.
In addition, our long-term debt, which includes the Senior Secured UBS Term Loan and the Backstop Notes contain restrictive covenants that limit our ability to engage in activities that may be in our long-term best interest.
Our failure to comply with those covenants could result in an event of default which, if not cured or waived, could permit UBS or the holders of the Backstop Notes to declare all or part of their debt to be immediately due and payable. Any such event would adversely affect our business, results of operations and financial condition.
If our cash flows and capital resources are insufficient to fund our debt service obligations, we could face substantial liquidity problems and may be forced to reduce or delay investments and capital expenditures, or to sell assets, seek additional capital or restructure or refinance our indebtedness. Our ability to restructure or refinance our debt will depend on, among other things, the condition of the capital markets and our financial condition at such times. Any refinancing of our debt could be at higher interest rates and may require us to comply with more onerous covenants, which could further restrict our business operations. In addition, any failure to make payments of interest and principal on our outstanding indebtedness on a timely basis would likely result in a reduction of our credit rating, which could harm our ability to incur additional indebtedness and our financial condition. In the absence of such cash flows and resources, we could face substantial liquidity problems and might be required to dispose of material assets or operations to meet our debt service and other obligations.
We may require additional capital to support our business, and this capital might not be available on acceptable terms, if at all.
We intend to continue to make investments to support our business and may require additional funds. In particular, we may seek additional funds to develop new products and enhance our platform and existing products, expand our operations, including our sales and marketing organizations and our presence outside of the United States, improve our infrastructure or acquire complementary businesses, technologies, services, products and other assets. In addition, we may use a portion of our cash to satisfy tax withholding and remittance obligations related to outstanding restricted stock units. Accordingly, we may need to engage in equity or debt financing to secure additional funds. If we raise additional funds through future issuances of equity or convertible debt securities, our stockholders could suffer significant dilution. Any debt financing that we may secure in the future could involve restrictive covenants relating to our capital raising activities, our ability to repurchase stock, and other financial and operational matters, which may make it more difficult for us to obtain additional capital and to pursue business opportunities. We may not be able to obtain additional financing on terms favorable to us, if at all, particularly during times of market volatility and general economic instability. If we are unable to obtain adequate financing or financing on terms satisfactory to us when we require it, our ability to continue to support our business growth, scale our infrastructure, develop product enhancements and to respond to business challenges could be significantly impaired, and our business, results of operations and financial condition may be adversely affected.
The requirements of being a public company have put a strain on our resources and diverted management’s attention, and the increases in legal, accounting, insurance and compliance expenses are greater than we anticipate.
We are a public company, and as such (and particularly after we are no longer an “emerging growth company”), will incur significant legal, accounting and other expenses that we did not incur prior to the Business Combination. We are subject to the reporting requirements of the Exchange Act, and are required to comply with the applicable requirements of the Sarbanes-Oxley Act and the Dodd-Frank Wall Street Reform and Consumer Protection Act, as well as the rules and regulations subsequently implemented by the SEC and the listing standards of The New York Stock Exchange, including changes in corporate governance practices and the establishment and maintenance of effective disclosure and financial controls. Compliance with these rules and regulations can be burdensome. Our management and other personnel need to devote a substantial amount of time to these compliance initiatives. Moreover, these rules and regulations will increase our historical legal and financial compliance costs and will make some activities more time-consuming and costly. For example, we expect that these rules and regulations may make it more difficult and more expensive for us to attract and retain qualified members of our board of directors as compared to us prior to the Business Combination as well as significantly more expensive to provide the required insurance. In particular, we expect to incur significant expenses and devote substantial management effort toward ensuring compliance with the requirements of Section 404 of the Sarbanes-Oxley Act, which will increase when we are no longer an “emerging growth company.” We have hired and may need to continue to hire additional accounting and financial staff, and engage outside consultants, all with appropriate public company experience and technical accounting knowledge and maintain an internal audit function, which increases our operating expenses.
Moreover, we could incur additional compensation costs in the event that we decide to pay cash compensation closer to that of other public companies, which would increase our general and administrative expenses and could materially and adversely affect our profitability. We are evaluating these, rules and regulations and cannot predict or estimate the amount of additional costs we may incur or the timing of such costs.
We have identified material weaknesses in our internal controls over financial reporting. If remediation of such material weaknesses is not effective, or if we fail to develop and maintain proper and effective internal controls over financial reporting and disclosure controls and procedures, our ability to produce timely and accurate financial statements, comply with applicable laws and regulations, or access the capital markets could be impaired.
We have identified material weaknesses in our internal controls over financial reporting. If we fail to develop and maintain proper and effective internal controls over financial reporting, our ability to produce timely and accurate financial statements, comply with applicable laws and regulations, or access the capital markets could be impaired.
As a public company, we are actively evaluating our internal control over financial reporting in a manner that meets the standards of publicly traded companies required by Section 404(a) of the Sarbanes-Oxley Act, or Section 404. A material weakness is defined as a deficiency, or combination of deficiencies, in internal control over financial reporting, such that there is a reasonable possibility that a material misstatement of our annual or interim financial statements will not be prevented or detected on a timely basis.
We are ultimately responsible for establishing and maintaining adequate internal control over our financial reporting, as defined in Rule 13a-15(f) under the Exchange Act. As disclosed in Item 9A, “Controls and Procedures,” management noted several material weaknesses in our internal control over financial reporting as of December 31, 2022. Refer to “Item 9A. Control and Procedures” for a detailed discussion regarding the material weaknesses identified as well as management’s remediation plans.
We are actively engaged in developing a remediation plan designed to address these material weaknesses, however, we cannot guarantee that these steps will be sufficient or that we will not have material weaknesses in the future. If our remedial measures are insufficient to address the material weaknesses, or if additional material weaknesses in our internal control are discovered or occur in the future, our financial statements may contain material misstatements and we could be required to restate our financial results.
The process of designing and implementing effective internal control over financial reporting is a continuous effort that requires us to anticipate and react to changes in its business and the economic and regulatory environments and to expend significant resources to maintain internal controls over financial reporting that are adequate to satisfy our reporting obligations as a public company. The rules governing the standards that must be met for our management to assess our internal control over financial reporting are complex and require significant documentation, testing and possible remediation. Testing and maintaining our internal control over financial reporting may divert management’s attention from other matters that are important to our business.
Taxing authorities may successfully assert that we should have collected or in the future should collect sales and use, value added or similar taxes, and we could be subject to liability with respect to past or future sales, which could adversely affect our operating results.
We do not collect sales and use, value added or similar taxes in certain jurisdictions in which we have sales, and we have been advised that such taxes are not applicable to certain of our products and services. Sales and use, value added, and similar tax laws and rates vary greatly by jurisdiction. Certain jurisdictions in which we do not collect such taxes may assert that such taxes are applicable, which could result in tax assessments, penalties and interest, to us or our end-customers for the past amounts, and we may be required to collect such taxes in the future. If we are unsuccessful in collecting such taxes from our end customers, we could be held liable for such costs. Such tax assessments, penalties and interest, or future requirements may adversely affect our operating results.
We have a history of losses and may not be able to achieve or sustain profitability in the future.
We have a history of losses, and we may not achieve or maintain profitability in the future. We incurred net losses of $24.8 million in 2021 and $106.2 million in 2022. As of December 31, 2022, we had an accumulated deficit of $248.2 million. We are not certain whether or when we will be able to achieve or sustain profitability in the future. We also expect our expenses to increase in future periods as we continue to invest in growth, which could negatively affect our future results of operations if our revenue does not increase. These investments may not result in increased revenue or profitable growth. Any failure to increase our revenue as we invest in our business, or to manage our costs, could prevent us from achieving or maintaining profitability or positive cash flow. We may also incur significant losses in the future for a number of reasons, including the other risks described in this prospectus, and unforeseen expenses, difficulties, complications, delays, and other unknown events. If we are unable to successfully address these risks and challenges, our business, financial condition, results of operations, and prospects could be materially adversely affected.
Risks Related to our Common Stock
The price of our securities may be volatile.
The trading price of our securities may fluctuate substantially and may be lower than the price at which you purchase such securities. This may be especially true for companies like ours with a small public float. The trading price of our securities may be volatile and subject to wide fluctuations due to a variety of factors, including:
•the success of competitive services or technologies;
•developments related to our existing or any future collaborations;
•regulatory or legal developments in the United States and other countries;
•developments or disputes concerning our intellectual property or other proprietary rights;
•the recruitment or departure of key personnel;
•actual or anticipated changes in estimates as to financial results, development timelines or recommendations by securities analysts;
•variations in our financial results or those of companies that are perceived to be similar to us;
•general economic, industry and market conditions; and
•the other factors described in this “Risk Factors” section.
These market and industry factors may materially reduce the market price of our common stock regardless of our operating performance.
Future resales of our common stock may cause the market price of our securities to drop significantly, even if our business is doing well.
Pursuant to the Investor Rights Agreements (as defined below), the Sponsor and the KORE stockholders party thereto were contractually restricted from selling or transferring any of their shares of our common stock (the “Lock-up Shares”), other than (i) any transfer to an affiliate of a holder, (ii) distribution to profit interest holders or other equity holders in such holder or (iii) as a pledge in a bona fide transaction to third parties as collateral to secure obligations under lending arrangements with third parties. Such restrictions ended on September 30, 2022, twelve months after the Closing. However, following the expiration of the lockup, the Sponsor and the KORE equity holders party to the Investor Rights Agreement are not restricted from selling shares of our common stock held by them, other than by applicable securities laws.
As restrictions on resale end, the sale or possibility of sale of these shares could have the effect of increasing the volatility in our share price or the market price of our common stock could decline if the holders of currently
restricted shares sell them or are perceived by the market as intending to sell them. In addition, we may issue additional shares of our common stock or other equity securities without the approval of investors, which would reduce investors’ proportionate ownership interests and may depress the market price of our common stock.
Reports published by analysts, including projections in those reports that differ from our actual results, could adversely affect the price and trading volume of our common stock.
Securities research analysts may establish and publish their own periodic projections for us. These projections may vary widely and may not accurately predict the results we actually achieve. Our share price may decline if its actual results do not match the projections of these securities research analysts. Similarly, if one or more of the analysts who write reports and downgrades our stock or publishes inaccurate or unfavorable research about our business, our share price could decline. If one or more of these analysts ceases coverage of us or fails to publish reports on us regularly, our securities price or trading volume could decline.
There can be no assurance that we will be able to comply with the continued listing standards of the NYSE.
Our common stock is currently listed on the NYSE. If the NYSE delists our common stock from trading on its exchange for any reason, we and our stockholders could face significant material adverse consequences including:
•a limited availability of market quotations for our securities;
•a determination that our common stock is a “penny stock” which will require brokers trading in our common stock to adhere to more stringent rules, possibly resulting in a reduced level of trading activity in the secondary trading market for our common stock;
•a limited amount of analyst coverage; and
•a decreased ability to issue additional securities or obtain additional financing in the future.
USE OF PROCEEDS
All of the shares of common stock offered by the Selling Securityholders pursuant to this prospectus will be sold by them for their respective accounts. We will not receive any of the proceeds from these sales, except with respect to amounts received by us upon exercise of the warrants to the extent such warrants are exercised for cash. We intend to use any proceeds from the exercise of any warrants for cash for general corporate and working capital purposes.
The Selling Securityholders will pay any underwriting fees, discounts, selling commissions, stock transfer taxes and certain legal expenses incurred by such Selling Securityholders in disposing of their shares of common stock, and we will bear all other costs, fees and expenses incurred in effecting the registration of such securities covered by this prospectus, including, without limitation, all registration and filing fees, NYSE listing fees and fees and expenses of our counsel and our independent registered public accountants.
We will receive up to an aggregate of approximately $102,485,068 from the exercise of all warrants, assuming the exercise in full of all such warrants for cash.
DIVIDEND POLICY
We have not paid any cash dividends on our common stock to date. The payment of cash dividends in the future will be dependent upon our revenue and earnings, if any, capital requirements and general financial condition. The payment of any cash dividends will be within the discretion of our board of directors. Our ability to declare dividends may be limited by the terms of financing or other agreements entered into by us or our subsidiaries from time to time.
BUSINESS
Overview
We offer IoT services and solutions. We are one of the largest global independent IoT enablers, delivering critical services to customers globally to deploy, manage and scale their IoT application and use cases. We provide advanced connectivity services, location-based services, device solutions, managed and professional services used in the development and support of IoT solutions and applications. Our IoT platform is delivered in partnership with the world’s largest mobile network operators and provides secure, reliable wireless connectivity to mobile and fixed devices. This technology enables us to expand our global technology platform by transferring capabilities across the new and existing vertical markets and to deliver complimentary products to channel partners and resellers worldwide. We began operations in 2003. A predecessor entity, of KORE, Maple Holdings Inc., was incorporated under the laws of the State of Delaware on July 29, 2014. After the Closing, Maple Holdings Inc. ceased to exist as a separate legal entity.
We have operating subsidiaries located in Australia, Belgium, Brazil, Canada, the Dominican Republic, Ireland, Malta, Mexico, the Netherlands, New Zealand, Switzerland, the United Kingdom and the United States.
We are one of the largest global enablers of IoT, providing Connectivity and IoT Solutions to enterprise customers across five key industry verticals, comprised of (i) Connected Health, (ii) Fleet Management, (iii) Asset Monitoring, (iv) Retail, Communications Services and (v) Industrial IoT.
On March 26, 2023, we entered into a purchase agreement (the “Purchase Agreement”) with Twilio Inc. (“Twilio”), whereby we agreed to purchase, subject to the satisfaction or waiver of the conditions set forth therein, the “internet of things” business of Twilio through the purchase of certain assets, including certain technology and intellectual property rights, and the assumption of certain liabilities, of Twilio (the “Twilio Transaction”). The Twilio Transaction closed on June 1, 2023.
On February 16, 2022, we acquired Business Mobility Partners, Inc. and Simon IoT LLC which are industry-leading mobile service providers to expand the Company's services and solutions within the healthcare and life sciences industries.
We have built a business at scale with revenue, net loss and adjusted EBITDA as shown in the table below:
| | | | | | | | | | | |
| Three months ended |
| (In thousands, USD) | March 31,
2023 | | March 31,
2022 |
Revenue | $ | 65,975 | | | $ | 68,978 | |
Net loss | (18,490) | | | (11,572) | |
Adjusted EBITDA | 13,328 | | | 15,288 | |
| | | | | | | | | | | |
| Twelve months ended |
| (In thousands, USD) | December 31, 2023 | | December 31, 2022 |
Revenue | $ | 268,447 | | | $ | 248,435 | |
Net loss | (106,200) | | | (24,776) | |
Adjusted EBITDA | 62,835 | | | 60,929 | |
Already a large market, IoT shows the promise and potential to be a significant technological revolution. IoT adoptions often result in significant productivity increases while creating entirely new business models in many cases, and we believe that IoT has the ability to have a significant impact worldwide. We enable this IoT adoption and are at the center of this revolution.
Diverse, Blue-chip Customer Base
We enable mission-critical IoT applications for enterprise and solution provider customers across approximately 15.1 million devices as of March 31, 2023, and 2022, respectively. We enable mission-critical IoT applications for enterprise and solution provider customers across approximately 15.0 million and 14.6 million devices as of December 31, 2022 and 2021, respectively We provided connectivity to over 3,600 customers for each of the years ended December 31, 2022 and 2021. Examples of how our customers use our products and services across our five key verticals are illustrated below:
•Connected Health: IoT enablement of medical device therapies, telehealth, chronic disease management, remote patient monitoring, IoT-enabled clinical drug trials, ePRO / eCOA, biometric sensor data capture, mPERS connected emergency devices, connected medical equipment diagnostics, electronic visit verification, etc.
•Fleet Management: Stolen vehicle recovery location tracking, connected cameras for tracking vehicle driving conditions and driver behavior, connected route optimization, fuel consumption optimization, connected preventive maintenance, usage-based insurance, connected cars.
•Asset Monitoring: Home/business security sensor and camera solutions, offender tracking through ankle bracelets, tank monitoring, supply chain inventory and asset tracking, fuel pipeline flow monitoring.
•Retail/Communication Services: IoT and consumer service providers, carrier IoT business units, enterprise connectivity / failsafe, private networking—We may provide CEaaS for some of these customers.
•Industrial IoT: Smart utilities / meters, smart cities / buildings, smart factories, field service automation, manufacturers of smart or connected products with actionable insights into industrial operations within manufacturing and OEMs.
Across the above-mentioned use cases and others, IoT is already a large and fast-growing industry comprised of IoT hardware, software, connectivity and services.
We enable mission-critical applications for over 3,600 customers comprising over 15.0 million devices. We are a leader in enabling end-to-end IoT solutions for enterprises across high growth end markets including Connected Health, Industrial IoT, Fleet Management and Remote Asset Monitoring. We serve an expansive group of some of the largest blue-chip enterprises with low customer concentration (approximately 300 customers comprising approximately 90% and 89% of our revenue for the years ended December 31, 2022, and 2021, respectively).
Our customers operate in a wide variety of sectors, including healthcare, fleet and vehicle management, asset management, communication services and industrial/manufacturing. Our largest customer, comprising approximately 13% and 18% of our revenue for the quarters ended March 31, 2023, and 2022, respectively, is a large multinational medical device and health care company. The same customer was also our largest customer, comprised approximately 11% and 21% of our revenue for the years ended December 31, 2022, and 2021, respectively
We have a B2B (business to business) model where any given customer may have hundreds, or thousands of devices deployed in the field. The structure of our relationships with our connectivity customers is “sticky,” meaning that any exit by a connectivity customer from our platform generally will take place over an extended period of time.
The difficulty in determining if a customer is moving away from KORE is compounded by the fact that the number of total connections that we have with any particular customer can increase or decrease over time depending on a variety of factors, including pricing, customer satisfaction and fit with a particular customer product. In some cases, customers may choose to allocate a portion of their business to other service providers alongside KORE. This allocation can change from period to period. As a result, a decline in total connections by a customer is not necessarily an indicator that the customer has decided to move away from KORE. Customers often keep their volume allocation decisions confidential in order to prevent us from making commercial adjustments (such as price
increases). We have developed a reliable framework for identifying early signs of potential customer churn and deploying preventative measures to ensure retention.
Key Partners
Our strong customer and partner relationships provide us with the opportunity to expand our market reach and sales. We partner with leading cellular providers to enable our CaaS business. Our IoT ecosystem partners include enterprise-level IoT software providers as application platform partners, top of the line commercial hardware manufacturers as hardware OEM partners, well-known electronics solutions providers as semi-conductor and module OEM partners, globally recognized cloud platforms as cloud providers as well as multinational system integrators as systems integration services partners. These partnerships allow us to provide IoT Solutions to our customers.
Market Opportunity
Key highlights of our market and business opportunities include:
Large and Growing IoT Market. The IoT market is rapidly expanding and we aim to capitalize on this momentum. The addressable IoT market is anticipated by industry analysts to grow from $382 billion, with 12 billion IoT devices in 2020, to $906 billion with 25 billion IoT devices by 2025. The addressable IoT market is projected by industry analysts to be $7 trillion by 2030 with 75 billion IoT devices and an accelerated growth of 50.5% CAGR. In addition to the proliferation of IoT endpoints, the adoption of 5G connectivity and enterprise digital transformation are major drivers for the growth of the IoT market.
Full stack product suite. Our mission is clear, to simplify the complexities of IoT and help clients deploy, manage, and scale their mission critical IoT Solutions. We have built a platform that allows us to be a trusted advisor to our clients in serving them in three areas CaaS, IoT Managed Services/Solutions, and Analytics, which we refer to
as “CSA,” or connectivity, solutions, and analytics. We offer a one-stop shop for enterprise customers seeking to obtain multiple IoT services and solutions from a single provider. Our product scope is as described below:
| | | | | | | | | | | | | | | | | | | | |
Product line | | Products | | Product description | | Primary pricing method |
IoT Connectivity revenue of 66% and 64% for the quarters ended March 31, 2023 and 2022, respectively. IoT Connectivity revenue of 66% and 68% for the fullyears ended 2022 and 2021, respectively. | | IoT Connectivity as a Service (CaaS) | | • IoT Connectivity services offered through our market leading IoT platform ‘KORE One’™ | | |
| | | •Our connectivity solutions allow devices to seamlessly and securely connect anywhere in the world across any connected network, which we call our multiple devices, multiple locations, multiple carriers CaaS multi-value proposition | | Per subscriber per month for lifetime of device (7-10 years and growing) Multi-year contracts with automatic renewals |
| | IoT Connectivity Enablement as a Service (CEaaS) | | • IoT Connectivity Management Platform as a Service (or individual KORE One engine) •Cellular Core Network as a Service (Cloud Native Evolved Packet Core “EPC”) | | |
IoT Solutions revenue of 34% and 36% for the quarters ended March 31, 2023, and 2022, respectively. IoT Solutions revenue of 34% and 32% for the full years ended 2022 and 2021, respectively. | | IoT Device Management Services | | • Outsourced platform-enabled services (e.g., logistics, configuration, device management) •Sourcing of third-party devices globally, device design and selection services | | Upfront fee per device or per device per month |
| IoT Security Location Based Services (LBS) | | •KORE’s SecurityPro® SaaS platform •KORE’s PositionLogic® SaaS platform and LBS APIs | | Per subscriber per month |
IoT Connectivity
IoT Connectivity services represent 66% and 64% of our revenue for the quarters ended March 31, 2023, and 2022, respectively. IoT Connectivity services represent 66% and 68% of our revenue for the years ended December 31, 2022, and 2021, respectively. Our heritage is in delivering IoT Connectivity services, particularly cellular connectivity, which is needed in a large number of IoT use cases. Managing cellular connectivity for IoT devices is complex. Companies deploying IoT devices often do so in multiple countries and continents. Even within an individual country, it is often the case that no single carrier offers 100% network coverage or coverage across all cellular technologies. Among other IoT deployment complexities, this lack of a single carrier across territories often necessitates negotiating, establishing and maintaining a large number of cellular carrier contracts. On a day-to-day level this requires potentially accessing a large number of cellular carrier portals in order to provision, de-provision, maintain, change rate plans for, change states for, and perform other transactions for SIMs deployed in IoT devices. A company deploying IoT would also expect to get multiple cellular carrier bills every month, and to work with multiple customer support organizations when something goes wrong. This complexity is very hard to manage at scale, especially since it is only a part of the complexity of the overall IoT deployment. Our connectivity services simplify this complexity and provide a single connectivity relationship managed through a single source with our KORE One platform which is purpose built for IoT. On the back-end, we leverage 46 carrier integrations with our cellular carrier partners.
KORE IoT Connectivity Services Coverage
We also believe that eSIMs and eUICC technology have significant potential for IoT providers and for KORE in particular. eSIM and eUICC technology are new standards for remote SIM provisioning defined by the Global System for Mobile Communications Association (“GSMA”), the organization that supports and defines cellular standards. The transition from the current standard, where a SIM is “locked in” to a specific cellular carrier, to an “unlocked” eSIM model with eUICC technology that allows a company deploying IoT to switch cellular carriers at the push of a button, “over the air,” without the need to physically change SIM cards, will allow a provider in our position to offer a single eSIM that works across multiple cellular carriers. This evolution will provide our customers with the ability to easily switch cellular carriers, without the need for expensive and labor-intensive physical SIM replacements.
Within IoT Connectivity services, we offer CaaS and CEaaS.
CaaS is cellular connectivity via our IoT platform ‘KORE One’™ and it is offered to enterprise customers such as large medical device manufacturers, or to IoT software and solutions providers such as fleet tracking companies
who may bundle connectivity with their own software and solutions. Fees for CaaS services generally consist of a monthly subscription fee for each connection, and additional data usage fees. Connectivity services also include charges for each SIM sold to a customer and other miscellaneous charges.
CEaaS is provided to communication service providers (such as MVNOs, and telecom carriers), device OEMs or other providers who wish to provide IoT cellular services to the market. The infrastructure software and services offered to such providers are cellular Core Network as a Service (including Cloud Native Evolved Packet Core “EPC”, or “CNaaS”), Connectivity Management Platform as a Service (“CMPaaS”) and Private Networking as a Service (“PNaaS”). Fees for CEaaS generally consist of a monthly subscription fee and other miscellaneous charges.
We have launched OmniSIMTM suite, which includes a multi-IMSI eUICC eSIM and a true eSIM – OmniSIM Reach and OmniSIM Rush. We have been successful in drawing in new customers and equipping existing customers with this future-proofed, global, and GSMA compliant eSIM, which will be a key technology in the decade of IoT. Powered by eSIM and multi-IMSI technology, OmniSIM provides global resilient connectivity with zero-touch provisioning. Now you can leverage connectivity that provides true out-of-the-box, global coverage that ensures it’s always on the right network for the required service needs.
•OmniSIM Reach: OmniSIM Reach is an award-winning solution powered by centralized multi-IMSI technology that truly covers the globe with access to 600 mobile networks in 198 countries.
•OmniSIM Rush: OmniSIM Rush is a cost-effective solution designed with performance and flexibility in mind. Rush delivers for those IoT use cases that require higher data (100MB/month upwards) usage plans in Europe and the United States.
IoT Solutions and Analytics
IoT Solutions represented approximately 34% and 36% of our revenue for the quarters ended March 31, 2023, and 2022, respectively. IoT Solutions represented approximately 34% and 32% of our revenue for the years ended December 31, 2022 and 2021, respectively. Successful deployment of IoT is extremely complex. Some of the significant challenges in IoT deployment include:
Top challenges in IoT deployments
To simplify IoT deployment complexity, we offer a comprehensive portfolio of IoT Solutions capabilities, including:
•IoT Device Management Services: outsourced platform enabled services (logistics, configuration, device management). Among other logistics services, we offer access to a global supply chain and a global supply base at competitive prices which may include custom device design and manufacture;
•Location Based Services: our SaaS cloud-based APIs (Position Logic®) platform for location and asset tracking; and
•IoT Security (SecurityPro®): our SaaS platform for deep-network behavior-mining IoT device security.
We are experienced in providing industry-specific solutions and increasingly with pre-configured industry solutions with a focus on areas such as regulatory and medical device compliance. We offer a one-stop shop for our customers with the capability to deliver large-scale solutions for enterprise customers.
Fees charged for device management services include the cost of the underlying IoT device and the cost of deploying and managing such devices and are usually charged on a fee per deployed IoT device basis, with the ultimate amount of such fee depending on the scope of the underlying services and the IoT device being deployed. Location-based software services and IoT security software services are charged on a per subscriber basis.
Partner Ecosystem
We are a differentiated player providing comprehensive IoT Solutions—CaaS, Solutions & Analytics through our robust partner ecosystem. This partner ecosystem offers us the unique ability to act as a “one-stop-shop” specializing in solutions across the full IoT stack that are secure, cost-efficient and enable our customers a rapid time to market. We partner with mobile carriers around the world as well as application platforms, hardware OEMs, semiconductor and module OEMs, cloud infrastructure providers and systems integrators.
Participation in 5G Adoption
•Massive TAM ( “Total Addressable Market”) and Disruptive End-Market Use Cases. We believe that 5G adoption will result in an addressable market of $13.2 trillion globally by 2035. Market growth is expected to be driven by key segments including smart manufacturing, mobile, smart city, intelligent retail, construction and mining, connected healthcare, and precision agriculture.
•KORE Touchpoints. We expect to be the leading enabler of 5G adoption across 5G IoT, 5G broadband, and 5G ultra reliable segments because we:
•Provide 5G connectivity and simplified management with 5G-ready eSIM and eUICC technology and multi-value proposition enabled by the proprietary KORE One platform.
•Enable seamless transition to 5G with our strength in carrier relationships and experience in managing network transitions.
•Accelerate 5G use cases with pre-configured solutions and industry-specific IoT Managed Services portfolios.
•Enable edge deployments with a roadmap for a fully virtualized multi-carrier gateway on the Edge (KORE Anywhere).
•Enable private network deployments with a fully virtualized core network (Cloud Native Evolved Packet Core “EPC”).
•Leveraging eSIMs coupled with eUICC Technology. eSIMs coupled with eUICC technologies are next-generation technologies driving rapid adoption of Enterprise IoT Connectivity. According to Ericsson, there is a massive growth of new IoT-connected devices expected to come online, with approximately 35 billion devices by 2028. One of the bigger challenges to achieving this growth is current SIM card technology.
Today, the vast majority of cellular connected devices are using SIM cards which are locked into a specific cellular carrier. eSIMs and eUICC technology offers several benefits over traditional SIM card technology, including:
•Enables devices to store multiple operator profiles on a device simultaneously and switch between them remotely.
•Allows remote updates.
•Permits remote SIM provisioning of any mobile device.
•Delivers an effective way to significantly increase data security.
•Offers protection from evolving network technologies, such as the retirement of legacy services like 2G and 3G. In some cases, eSIM technology plays a critical role providing secure out-of-the box connectivity to support IoT. It enables our customers to maintain a flexible approach towards carrier and network management. Moreover, eSIM technology future-proofs devices in the field against changes in network technology. We offer advanced connectivity solutions through our proprietary eSIM offering and believe that it will be a key vector for eSIM volume growth. We shipped approximately 0.5 million eSIMs in 2022 and expect to continue successfully implementing the eSIM technology into customer IoT deployments.
KORE’s Competition and Differentiators
We believe that we are one of the few providers in the current market that can provide IoT enablement services, delivering CaaS, IoT Solutions and Analytics in a comprehensive manner. However, the individual markets for our products and solutions are rapidly evolving and are highly competitive. These markets are likely to continue to be affected by new product introductions and industry participants. Below are some of our key competitors across various segments of our business:
•For IoT Connectivity services: telecom carriers such as T-Mobile and Vodafone; Mobile Virtual Network Operators such as Aeris, and Wireless Logic.
•For IoT Solutions and Analytics: device management services providers such as Velocitor Solutions and Futura Mobility, fleet management SaaS providers such as Fleetmatics and GPS Trackit, and analytics services providers such as Galooli and Intellisite.
We compete in the IoT Connectivity services market on the basis of the number of carrier integrations (46), its KORE One platform (7 engines), ConnectivityPro service and related APIs, the eSIM technology stack/proprietary IP, Cloud Native Evolved Packet Core “EPC”. We compete in the IoT Solutions market on the basis of our deep industry vertical knowledge and experience (e.g., in Connected Health through the U.S. Food and Drug Administration (“FDA”) Facilities Registration, ISO 9001/13485 certification and HIPAA compliance), our breadth of solutions and analytics services and 3,300+ connectivity-only customers that provide cross-selling opportunities of additional IoT managed services.
Sales, Marketing and Growth Strategy
The five pillars of our growth strategy are as follows:
•Significant organic volume growth from existing customer base: Leveraging strong IoT industry momentum with the average customer growing at double digit growth rates, maintaining high customer retention, and leveraging eSIMs to gain wallet share and market share.
•Cross-sell and upsell our growing portfolio of IoT Solutions to our large base of IoT Connectivity services only customers, while continuing to build momentum using our investments in MODGo, High Bandwidth, CHTS solution for cross-sell opportunities.
•Deepening our presence in focused industry sectors: Leverage our presence in Connected Health and Fleet Management, deepen its presence in other verticals in the next 6 to 12 months, and deploying pre-configured industry solutions.
•Enhance “AIoT” (Artificial Intelligence + IoT) and Edge Analytics capabilities in target industries.
•Drive growth through strategic, accretive acquisitions, which add key capabilities.
Intellectual Property
Our approach in building our intellectual property was to focus on creating outcomes for our customers. This enables services that we provide using our IP and for customers to build their own services that lead to meaningful business outcomes, whether it is building a web-based patient monitoring service or a mobile app-based pet tracking service.
Our Technology Stack essentially provides customers with IoT Building Blocks to create their IoT Solution. Our KORE One platform with our seven open, modular and scalable engines sits in the center of all this. The platform not only enables us to create services for our customers, but also for customers to build their own. Our eSIM (OmniSIM) can provide global and local connectivity on a single SIM. Our HyperCore provides us with the core network capabilities to enable us and our customers to drive creative connectivity offerings. Our Pre-Configured solutions offer customers the ability to jump start their IoT journey and reduce their time-to-market from several months to a few weeks.
Key areas of our intellectual property as illustrated above are:
KORE One™ Platform: The KORE One Platform was built using a microservices-based proprietary architecture and consists of seven (7) key engines.
KORE eSIM: We have developed our eSIM which helps in providing global connectivity using a single eSIM which can be remotely updated with a preferred carrier profile over the air, or OTA. The key pieces of intellectual property in this portfolio include our eSIM profile, eSIM Validation Tool, and our APIs.
Cloud Native HyperCore (Cellular Network as a Service): Any cellular network is comprised of a Radio Access Network (“RAN”), fiber optic backhaul and a “core network”, the functions of which constitute the “brains”
of this network (including switching, authentication etc.). Cloud Native HyperCore provides us as well as some of our customers with a cellular “core network” (built on top of a RAN and backhaul from a cellular carrier). Our intellectual property consists of both a traditional and a cloud-native core network component.
IoT Network and Application Services
•ConnectivityPro®: IoT Connectivity Management Platform that provides an array of global IoT Connectivity services such as provisioning connectivity, provisioning users, rating and charging, distribution management, eSIM orchestration, diagnostics and support.
•SecurityPro®: IoT security service that enables deep network traffic monitoring for IoT connections. It helps mitigate the risk of data breaches and provides packet-level visibility into IoT communications. With SecurityPro, customers can set up rules on groups of devices and not only detect anomalies in traffic based on these rules but also take appropriate action upon detection.
•PositionLogic™: Location based services (“LBS”) platform for position mapping, global fleet tracking, intelligent routing and integrated telematics services such as in-vehicle video, cargo monitoring, safety & security etc.
Apart from the intellectual property listed above, we maintain one active patent, several trademarks and ownership of domain and website names, all of which we consider our intellectual property.
We manage our research and development efforts through a structured life-cycle process covering identification of customer requirements, preparing a product roadmap, ongoing agile development, and commercial introduction to eventual phase-out. During product development, emphasis is placed on quality, reliability, performance, time-to-market, meeting industry standards and customer-product specifications, ease of integration, cost reduction, and maintainability.
Employees and Human Capital
Our success depends on our ability to attract, hire, retain and develop highly skilled professionals in a variety of specialties, including finance, technology, compliance, business development, cybersecurity and management.
Workforce
As of December 31, 2022, we had 595 full-time employees.
Talent Management and Culture
Due to the complexity of our business, we compete for talent with other companies, both inside and outside of our industry, and in multiple geographical areas in the United States, Canada, United Kingdom and the Netherlands. In 2022, our human capital efforts focused on further developing our high-performance culture to attract, develop and retain talent by enhancing our performance-management and succession planning efforts, additional talent management programs, recruitment focus to attract underrepresented workforce areas, encourage greater autonomy through thought leadership and innovation and improve quantity and quality of employee communications, so that we can better serve our customers and be recognized as a great place to work. To that end, we seek employees who share our commitment to our core values: Innovation, One Team, Trust and Integrity, Excellence, Results Focused, Supportive and Collaborative.
Compensation and Benefits
To maintain a high-caliber, values-driven workforce that is committed to our culture, we strive to offer total rewards, including compensation, benefits and recognition programs that position our Company as an employer of choice. Our compensation is designed to be performance based and competitive in the markets in which we compete. We closely monitor industry trends and practices to ensure we are able to attract and retain the personnel who are critical to our success. We also monitor internal pay equity to help ensure that our compensation practices are fair and equitable across our organization. Our senior leaders have an opportunity to receive a portion of their
compensation in our equity, and, subject to a cap, we match the contributions of all of our employees to our retirement savings plan to help support their long-term financial goals.
To help our employees feel supported, we offer an array of benefits intended to meet the diverse needs of our employees and their eligible dependents. From healthcare to holidays, our aim is to help our employees enjoy happy and healthy lifestyles, while maintaining good work-life balance. Our benefits, which are overseen by our Total Rewards team, are available to all full-time employees and part-time employees working at least 30 hours per week. Our health and welfare benefits include, among other things: medical coverage; dental and vision coverage; healthcare and dependent-care flexible spending accounts, Health Savings Accounts, an Employee Assistance Program, including counseling and work/life services for employees and their families; accident and critical illness coverage; life and accidental death and dismemberment insurance, as well as short-term and long-term disability insurance.
Training and Development
We believe in our employees’ potential and provide training and development opportunities intended to maximize their performance and professional growth. To ensure that new employees integrate into our culture and their daily work, we provide a robust new-hire experience, as well as extensive ongoing training for our employees to acquaint them with our business. We require all our employees to complete courses in key regulatory areas, and we offer opportunities for professional development through training sessions and cross-departmental workshops. In addition, we have a mentorship program that pairs newer employees with more experienced professionals, giving mentees access to experience, expertise and guidance as they chart their career paths.
Employee Safety
We aim to provide a safe, inclusive environment for our employees where they feel engaged in our business, supported in who they are and empowered to succeed. We are committed to providing a workplace that is free from violence, harassment and other unsafe or disruptive conditions and require our personnel to attend regular training sessions and workshops on those topics.
Diversity, Equity and Inclusion
We believe that well-being is more than just physical safety and that our employees should feel welcome and supported as who they are. We seek to foster diversity and a culture of inclusivity. In addition, our professional development and recruitment efforts have focused on improving the diversity of our employee population, including through targeted outreach to and collaborations with organizations that serve diverse populations. We also offer two scholarships per annum to students at Georgia Tech University for underrepresented workforce candidates, in particular women studying technology and engineering.
Continuous improvement is a pillar of our culture, and we regularly solicit employee feedback on the effectiveness and quality of our support programs and their level of engagement with our business. We use this feedback to improve our programs and processes and inform decisions about our business. In addition, we closely monitor employee turnover, both in the aggregate and in key subcategories such as diversity and levels within the Company, to evaluate our effectiveness in retaining critical personnel.
We are committed to an inclusive work environment to encourage and cultivate diversity of thought and ideas within the Company to leverage the individual talents, perspectives and experiences of our employees to position us for continued growth and success.
Deployment Operations, Training and Customer Support
IoT deployments are extremely complex. Our mission is to simplify the complexities of IoT and help clients deploy, manage and scale their mission-critical IoT Solutions.
In the CaaS business, we deploy connectivity solutions using local SIMs, eSIMs and in certain cases core network platforms for customers to manage their connectivity base. We ship custom configured SIMs/eSIMs from
our Rochester, New York and Woerden, the Netherlands facilities. We deliver our core network services with our staff based out of the Netherlands and the United Kingdom.
Our IoT Solutions include IoT device management services, IoT location-based services software, and IoT device security services software for the Machine-to-Machine market. Our IoT Solutions ensure that customer operations, whether built on asset trackers, telematics equipment, routers, gateways, tablets or smartphones, have devices and equipment fully assembled and configured when they reach eventual users.
We offer IoT device management services for deployment and sustainment of devices, including sourcing, configuration, mobile data management, and device lifecycle management. Configuration services include software configuration, SIM card installation, firmware updates, mobile data management, accessory integration, and custom component packaging.
We have key IoT Solutions configuration centers located in Pittsford, New York, and Ulestraten, the Netherlands which act as bases of operations before products and devices are sent to customers for final installation before use.
In addition, we also have the ability to bring partners required for site assessments in evaluating deployment locations prior to installation in order to validate and remediate RF signal strength, network performance, and other key metrics.
We train our customers using our customer success group which helps onboard the customers on our platform, conduct periodic refresher training, educate customers about our products and also conduct additional training sessions. We offer ongoing customer support through a number of functions, including customer success teams that help train and support the customers at the start of their engagement with us, call center for triage support (to resolve issues quickly and easily by troubleshooting malfunctioning endpoints), technical support, network operations center to monitor network and notify customers, and support for returns management of IoT devices. Our customer support teams are spread across the world.
Facilities
Our corporate headquarters is located in Atlanta, Georgia and consists of approximately 16,403 square feet of office space. During 2022 our Rochester facility was moved and expanded with approximately 10,000 square feet located in Pittsford, New York. The BMP and Simon IOT acquisition added approximately 10,000 square feet in Westbury, New York. Our Pittsford and Ulestraten facilities are ISO-9001/13485 certified. In addition, Pittsford facility holds a FDA Facilities Registration, and is HIPAA compliant. We believe that our existing properties are in good condition and are sufficient and suitable for the conduct of our business in the foreseeable future. To the extent our needs change as our business grows, we expect that additional space and facilities will be available.
Principal Suppliers
Our principal suppliers include IoT connectivity and IoT solutions providers such as AT&T Inc., JACS Solutions and Verizon Communication, Inc.
Legal Proceedings
From time to time, we may be involved in litigation relating to claims arising out of its operations in the ordinary course of business. There are no material legal proceedings, other than routine litigation incidental to the business, to which we or any of our subsidiaries are a party or of which any of ours or our subsidiaries property is subject as of the filing date of this registration statement.
Government Regulations and Compliance
We are required to comply with increasingly complex and changing federal, state and international laws, regulations and industry standards regarding privacy, data protection and data security, including those related to the collection, storage, use, transmission and security of personally identifiable information, health information and individual credit data, for various business purposes, including medical reasons and promotional and marketing
purposes. Such privacy and data protection laws and regulations, including the HIPAA, as well as industry standards, in each case relating to the collection, use, retention, security and transfer of personally identifiable information, health information and individual credit data. Several jurisdictions have passed laws in this area, and other jurisdictions are considering imposing additional restrictions. These laws continue to develop and may be inconsistent from jurisdiction to jurisdiction. Any entities covered by HIPAA (including entities such as KORE which track health-related data) are required by the HIPAA Privacy Rule to protect and prevent the unauthorized disclosure of patient health information known as protected health information. HIPAA also requires that covered entities comply with the HIPAA Security Rule which requires, among other things that, all covered entities (i) ensure the confidentiality, integrity and availability of all electronic protected health information; (ii) detect and safeguard against anticipated threats to the security of the information; (iii) protect against anticipated impermissible uses or disclosures; and (iv) certify compliance by their workforce.
KORE’S MANAGEMENT’S DISCUSSION AND ANALYSIS OF FINANCIAL CONDITION AND RESULTS OF OPERATIONS
The following discussion and analysis of the financial condition and results of operations of KORE Group Holdings, Inc. should be read together with the Company’s Annual Report on Form 10-K for the fiscal year ended December 31, 2022, and unaudited interim consolidated financial statements as of and for the three months ended March 31, 2023, together with related notes thereto and the consolidated financial statements as of and for the years ended December 31, 2022, and 2021. A detailed discussion comparing our results of operations for the years ended December 31, 2021, and 2020 are not included here and can be found in “Management’s Discussion and Analysis of Financial Condition and Results of Operations” in Part II, Item 7 of the Company’s Annual Report on Form 10-K for the fiscal year ended December 31, 2021. This discussion may contain forward-looking statements based on current expectations that involve risks and uncertainties. Our actual results may differ materially from those projected in these forward-looking statements as a result of various factors, including those set forth under “Risk Factors” on the Annual Report on Form 10-K for the period ending December 31, 2022. Unless the context otherwise requires, all references in this section to “the Company” “KORE,” “us,” “our” or “we” refer to KORE Group Holdings, Inc.
Overview and highlights three months ended March 31, 2023
•First quarter 2023 revenue of $66.0 million declined 4.4% year-over-year. On a sequential basis, revenue increased 5.7% from the fourth quarter of 2022 and was slightly ahead of our expectations primarily due to stronger-than-expected growth in the connected health vertical and sequential growth of 19.7% in IoT Solutions revenue.
•Gross margin in the first quarter of 2023 increased over 500 basis points to 54.0% , versus 48.9% in the first quarter of 2022, and was up slightly on a sequential basis from the fourth quarter of 2022 due to improved carrier optimization, the absence of LTE transition project revenue from our largest customer, and a lower mix of hardware sales.
•KORE’s sales funnel, which KORE defines as opportunities the KORE sales team is actively pursuing, included over 1,400 opportunities with an estimated potential Total Contract Value (TCV) of over $500 million.
•KORE’s eSIM solution, OmniSIM™ SAFE was selected as a winner of the M2M Product of the Year by IoT Breakthrough. OmniSIM™ SAFE pairs the global zero-touch provisioning capabilities of eSIM with industry standard security design, allowing for device level security to meet the challenge of international, carrier agnostic, secure connectivity for IoT use cases.
•On March 26, 2023, KORE entered into an agreement to acquire Twilio's IoT business unit for 10 million shares of KORE common stock to be issued to Twilio. This acquisition expands KORE's existing Deploy, Manage, and Scale capabilities by adding Build services to our one-stop shop and, importantly, bolsters KORE's global, independent IoT Connectivity leadership position. Completion of the acquisition transaction was subject to customary closing conditions and closed in the late second quarter of 2023.
Overview and 2022 Highlights
•We ended 2022 with $34.6 million in cash compared to $86.0 million at the end of 2021. During the year, we generated $16.4 million from operating activities as compared to $14.8 million used in 2021.
•Due to improvements in cash generated by operating activities in 2022, we did not draw on our revolving credit facility. During 2021, we drew and repaid $25.0 million of our revolving credit facility.
•The acquisition of strategically aligned Business Mobility Partners and Simon IoT expanded our capabilities in the rapidly growing Life Sciences space.
•Launched KORE connected hub for Connected Health that streamlines integration of medical devices and sensors furthering our Connected Health telemetry solutions.
•Launched Pro AI, the first “plug-and-play” camera, to the integrated in-vehicle video platform. Pro AI has been well received by customers, and we expect this innovative product to drive sales of our video telematics solution.
•We announced a multi-year alliance with Google Cloud to offer IoT capabilities to global businesses, simplifying the complexities of IoT deployment while leveraging Google Cloud infrastructure and our IoT Solutions. The partnership aims to bring a range of value-added features to customers and expand new paths to market for industries such as healthcare, logistics, and retail/communications service providers.
•We are the only independent IoT Connectivity provider to be named a leader in Managed IoT Connectivity by Gartner in the 2022 Magic Quadrant report for the third consecutive year. We were also listed as a leader by IDC MarketScape, highlighting the breadth and scale of our solutions.
•We were named a 2022 Global Competitive Strategy Leader in the Internet of Things Professional Services Industry by research and consulting firm Frost & Sullivan.
•We were added as a member of the broad-market Russell 3000® Index.
Components of Results of Operations
Revenue
We derive revenue from:
–Services: IoT Connectivity services and IoT Solutions services.
–Products: SIMs (IoT Connectivity) and IoT devices (IoT Solutions).
We view our business as being constituted of two services lines: IoT Connectivity and IoT Solutions.
The fees for IoT Connectivity generally consist of a monthly subscription fee and additional data usage fees that are part of a bundled solution which enable other Providers and Enterprise customers to complete their platform for solutions to provide IoT Connectivity. IoT Connectivity also includes charges for each subscriber identity module (SIMs) sold to a customer.
In IoT Solutions, we derive revenue from IoT device management services, location-based software services and IoT security software services. Fees charged for device management services include the cost of the underlying IoT device and the cost of deploying and managing such devices. Fees charged for device management services are generally billed on a fee per deployed IoT device basis which depends on the scope of the underlying services and the IoT device being deployed. Location based software services and IoT security software services are charged on a per-subscriber basis.
Costs and Expenses
Cost of Revenue
Cost of revenue consists primarily of costs associated with IoT Connectivity and those associated with IoT Solutions. IoT Connectivity costs include carrier costs, network operations, technology licenses, and other costs such as shipping a SIM. IoT Solution costs include the cost of devices, shipping costs, warehouse lease and related facilities expenses, and personnel costs. Total cost of revenue excludes depreciation and amortization.
Operating expenses
We incur expenses associated with sales, marketing, customer support, and administrative activities related to the operation of our business, which are generally included as part of selling, general and administrative expenses. We also incur significant charges for depreciation and amortization of our intangible assets (including intangible assets we acquired or developed), other acquired intellectual property, as well as our fixed assets which support the deployment of our IoT Connectivity services and IoT Solutions services. We also incur engineering expenses
developing and supporting the operation of our communications systems and the early stage engineering work on new products and services that are not yet determined to be technologically feasible.
Key Metrics
We review a number of metrics to measure our performance, identify trends affecting our business, prepare financial projections, and make strategic decisions. The calculation of the key metrics and other measures discussed below may differ from other similarly titled metrics used by other companies, securities analysts, or investors.
Number of Connections
Total connections constitute the total of all KORE IoT Connectivity services connections, including both CaaS and CEaaS connections, but excluding certain connections where mobile carriers license our subscription management platform from us. Total connections include the contribution of eSIMs and is the principal measure used by management to assess the performance of the business on a periodic basis.
DBNER as of March 31, 2023
DBNER (Dollar Based Net Expansion Rate) tracks the combined effect of cross-sales of IoT Solutions to KORE’s existing customers, its customer retention and the growth of its existing business. KORE calculates DBNER by dividing the revenue for a given period (“given period”) from existing go-forward customers by the revenue from the same customers for the same period measured one year prior (“base period”).
The revenue included in the current period excludes revenue from (i) customers that are non-go-forward customers, meaning customers that have either communicated to KORE before the last day of the current period their intention not to provide future business to KORE or customers that KORE has determined are transitioning away from KORE based on a sustained multi-year time period of declines in revenue and (ii) new customers that started generating revenue after the end of the base period. For example, to calculate our DBNER for the trailing 12 months ended March 31, 2023, we divide (i) revenue, for the trailing 12 months ended March 31, 2023, from go-forward customers that started generating revenue on or before March 31, 2022, by (ii) revenue, for the trailing 12 months ended March 31, 2022, from the same cohort of customers. For the purposes of calculating DBNER, if KORE acquires a company during the given period or the base period, then the revenue of a customer before the acquisition but during either the given period or the base period is included in the calculation. Further, it is often difficult to ascertain which customers should be deemed not to be go-forward customers for purposes of calculating DBNER. Customers are not required to give notice of their intention to transition off of the KORE platform, and a customer’s exit from the KORE platform can take months or longer, and total connections of any particular customer can at any time increase or decrease for any number of reasons, including pricing, customer satisfaction or product fit—accordingly, a decrease in total connections may not indicate that a customer is intending to exit the KORE platform, particularly if that decrease is not sustained over a period of several quarters. DBNER would be lower if it were calculated using revenue from non-go-forward customers.
KORE defines “Non-Core Customers” to be customers that management has judged to be lost as a result of the integration of Raco, Wyless and other acquisitions completed during the 2014-2017 period, but which continue to have some connections (and account for some revenue) each year with KORE. Non-Core Customers no longer existed as of December 31, 2022, with the substantial completion of the 2G and 3G network sunsets in the United States.
DBNER is used by management as a measure of growth at KORE’s existing customers (i.e., “same store” growth). It is not intended to capture the effect of either new customer wins or the declines from non-go-forward customers on KORE’s total revenue growth. This is because DBNER excludes new customers who started generating revenue after the base period and also excludes any customers who are non-go-forward customers on the last day of the current period. Revenue increases from new customer win, and a decline in revenue from non-go-forward customers are also important factors in assessing KORE’s revenue growth, but these factors are independent of DBNER.
DBNER as of December 31, 2022
DBNER tracks the combined effect of cross-sales of IoT Solutions to KORE’s existing customers, its customer retention and the growth of its existing business. KORE calculates DBNER by dividing the revenue for a given period (“given period”) from existing go-forward customers by the revenue from the same customers for the same period measured one year prior (“base period”).
The revenue included in the current period excludes revenue from (i) customers that have either communicated to us before the last day of the current period their intention not to provide future business to us or customers that we have determined are transitioning away from us based on a sustained multi-year time period of declines in revenue and (ii) new customers that started generating revenue after the end of the base period. For example, to calculate our DBNER for the trailing 12 months ended December 31, 2022, we divide (i) revenue, for the trailing 12 months ended December 31, 2022, from go-forward customers that started generating revenue on or before December 31, 2021 by (ii) revenue, for the trailing 12 months ended December 31, 2021, from the same cohort of customers. For the purposes of calculating DBNER, if we acquire a company during the given period or the base period, then the revenue of a customer before the acquisition but during either the given period or the base period is included in the calculation. Further, it is often difficult to ascertain which customers should be deemed not to be go-forward customers for purposes of calculating DBNER. Customers are not required to give notice of their intention to transition off of the KORE platform, and as discussed above in “Information about KORE—Customer and Key Partners”, a customer’s exit from the KORE platform can take months or longer, and total connections of any particular customer can at any time increase or decrease for any number of reasons, including pricing, customer satisfaction or product fit – accordingly, a decrease in total connections may not indicate that a customer is intending to exit the KORE platform, particularly if that decrease is not sustained over a period of several quarters. DBNER would be lower if it were calculated using revenue from customers not planning on subscribing in the future.
As of December 31, 2022, and 2021, DBNER excludes approximately 0.3 million and 0.6 million connections, respectively, from non-go-forward customers, in each case, the vast majority of which are connections from Non-Core Customers.
We define “Non-Core Customers” to be customers that management has judged to be lost as a result of the integration of Raco, Wyless and other acquisitions completed during in the 2014-2017 period, but which continue to have some connections (and account for some revenue) each year with us. Non-Core Customers are a subset of customers not planning on subscribing in the future.
DBNER is used by management as a measure of growth at our existing customers (i.e., “same store” growth). It is not intended to capture the effect of either new customer wins or the declines from non-go-forward customers on our total revenue growth. This is because DBNER excludes new customers who started generating revenue after the base period, and also excludes any customers which are non-go-forward customers on the last day of the current period. Revenue increases from new customer wins, and a decline in revenue from non-go-forward customers are also important factors in assessing our revenue growth, but these factors are independent of DBNER.
For the twelve months ended December 31, 2022, our DBNER was 92% compared to 122% in the twelve months ended December 31, 2021. Most of the decline is coming from our largest customer and the conclusion of their significant LTE transition project in early 2022.
TCV
Total Contract Value (TCV) represents our estimated value of a revenue opportunity. TCV for an IoT Connectivity opportunity is calculated by multiplying by forty the estimated revenue expected to be generated during the twelfth month of production. TCV for an IoT Solutions opportunity is either the actual total expected revenue opportunity, or if it is a longer-term "programmatically recurring revenue" program, calculated for the first 36 months of the delivery period.
As of March 31, 2023, our sales funnel, which we define as opportunities our sales team is actively pursuing, included over 1,400 opportunities with an estimated potential TCV of over $500 million.
As of December 31, 2022, our sales funnel, included over 1,400 opportunities with an estimated potential TCV of over $434 million.
Results of Operations for the three months ended March 31, 2023, and 2022
Revenue
The tables below present our revenue for the three months ended March 31, 2023, and 2022, respectively, together with the percentage of total revenue represented by each revenue category:
| | | | | | | | | | | | | | | | | | | | | | | | | | | | | | | | | | | |
| Three months ended March 31, | | Change |
| (In thousands, USD) | 2023 | | 2022 | | $ | | % |
Services | $ | 47,550 | | | 72 | % | | $ | 47,543 | | | 69 | % | | $ | 7 | | | — | % |
Products | 18,425 | | | 28 | % | | 21,435 | | | 31 | % | | (3,010) | | | (14) | % |
Total Revenue | $ | 65,975 | | | 100 | % | | $ | 68,978 | | | 100 | % | | $ | (3,003) | | | (4) | % |
For the three months ended March 31, 2023, services revenue did not change significantly compared to the same period in fiscal 2022. The revenue increases were primarily due to organic growth in revenue from existing customers and the growth of their connected device base year-over-year. The increases in revenue were partially offset by the expected decline in revenue from Non-Core Customers, declines in deployment revenue, mainly from our largest customer’s one-time LTE transition project that concluded in early 2022, and overall price reductions to existing customers due to the migration of their 2G and 3G connections to LTE. These migrations were completed at the end of 2022.
For the three months ended March 31, 2023, products revenue decreased by $3.0 million compared to the same period in fiscal 2022. The decline in revenue was primarily from our largest customer and the conclusion of their one-time LTE transition project in early 2022.
The tables below present how management views our revenue for the three months ended March 31, 2023, and 2022, together with the percentage of total revenue represented by each revenue category:
| | | | | | | | | | | | | | | | | | | | | | | | | | | | | | | | | | | |
| Three months ended March 31, | | Change |
| (In thousands, USD) | 2023 | | 2022 | | $ | | % |
IoT Connectivity | $ | 43,545 | | | 66 | % | | $ | 44,135 | | | 64 | % | | $ | (590) | | | (1) | % |
IoT Solutions | 22,430 | | | 34 | % | | 24,843 | | | 36 | % | | (2,413) | | | (10) | % |
Total Revenue | $ | 65,975 | | | 100 | % | | $ | 68,978 | | | 100 | % | | $ | (3,003) | | | (4) | % |
| | | | | | | | | | | |
| Three months ended March 31, |
| 2023 | | 2022 |
Period End Connections | 15.1 | million | | 15.3 | million |
Average Connections Count for the Period | 15.1 | million | | 15.1 | million |
For the three months ended March 31, 2023, IoT Connectivity revenue did not change significantly compared to the same period in fiscal 2022. The revenue decreased primarily due to the expected decline in revenue from Non-Core Customers and overall price reductions to existing customers due to the migration of their 2G and 3G connections to LTE, which was completed at the end of 2022. These declines in IoT Connectivity revenue were offset by organic growth from existing customers and the growth of their connected device base year-over-year.
For the three months ended March 31, 2023, IoT Solutions revenue decreased by $2.4 million compared to the same period in fiscal 2022. The decline in revenue was primarily from our largest customer and the conclusion of their one-time LTE transition project in early 2022.
KORE’s DBNER was 107% for the twelve months ended March 31, 2023, as compared to 122% for the twelve months ended March 31, 2022. The decrease was mainly due to a decline in revenue from our largest customer upon the conclusion of their LTE transition project. Excluding our largest customer, DBNER was 126% for the twelve months ended March 31, 2023, as compared to 114% for the twelve months ended March 31, 2022.
Costs of revenue, exclusive of depreciation and amortization
The table below represents our cost of revenue for the three months ended March 31, 2023, and March 31, 2022, respectively:
| | | | | | | | | | | | | | | | | | | | | | | | | | | | | | | | | | | |
| Three months ended March 31, | | Change |
| (In thousands, USD) | 2023 | | 2022 | | $ | | % |
Services | $ | 16,543 | | | 55 | % | | $ | 17,550 | | | 50 | % | | $ | (1,007) | | | (6) | % |
Products | 13,774 | | | 45 | % | | 17,723 | | | 50 | % | | (3,949) | | | (22) | % |
Total cost of revenue | $ | 30,317 | | | 100 | % | | $ | 35,273 | | | 100 | % | | $ | (4,956) | | | (14) | % |
| | | | | | | | | | | |
| Three months ended March 31, |
| Gross margin rate | 2023 | | 2022 |
Services | 65 | % | | 63 | % |
Products | 25 | % | | 17 | % |
Total gross margins | 54 | % | | 49 | % |
For the three months ended March 31, 2023, the cost of services decreased by $1.0 million compared to the same period in fiscal 2022. The decline in costs was primarily due to decreases in carrier costs from improved optimization and lower deployment costs from lower IoT Solutions volumes.
For the three months ended March 31, 2023, the cost of products decreased by $3.9 million compared to the same period in fiscal 2022. The decline was primarily due to lower volumes associated with the decline in IoT Solutions revenue.
The table below presents how management views our costs of revenue for the three months ended March 31, 2023, and 2022, exclusive of depreciation and amortization:
| | | | | | | | | | | | | | | | | | | | | | | | | | | | | | | | | | | |
| Three months ended March 31, | | Change |
| (In thousands, USD) | 2023 | | 2022 | | $ | | % |
IoT Connectivity | $ | 15,155 | | | 50 | % | | $ | 16,891 | | | 48 | % | | $ | (1,736) | | | (10) | % |
IoT Solutions | 15,162 | | | 50 | % | | 18,382 | | | 52 | % | | (3,220) | | | (18) | % |
Total cost of revenue | $ | 30,317 | | | 100 | % | | $ | 35,273 | | | 100 | % | | $ | (4,956) | | | (14) | % |
| | | | | | | | | | | |
| Three months ended March 31, |
| Gross margin rate | 2023 | | 2022 |
IoT Connectivity | 65 | % | | 62 | % |
IoT Solutions | 32 | % | | 26 | % |
Total gross margins | 54 | % | | 49 | % |
For the three months ended March 31, 2023, the cost of IoT Connectivity decreased by $1.7 million compared to the same period in fiscal 2022. The decline was primarily due to decreases in carrier costs from improved optimization.
For the three months ended March 31, 2023, the cost of IoT Solutions decreased by $3.2 million compared to the same period in fiscal 2022. The decline was primarily due to lower volumes associated with the decline in IoT
Solutions revenue, which was mainly from our largest customer, and the completion of their one-time LTE transition project in early 2022.
Selling, general, and administrative expenses
| | | | | | | | | | | | | | | | | | | | | | | |
| Three months ended March 31, | | Change |
| (In thousands, USD) | 2023 | | 2022 | | $ | | % |
Selling, general, and administrative | 30,200 | | | $ | 27,717 | | | $ | 2,483 | | | 9 | % |
Selling, general, and administrative (“SG&A”) expenses relate primarily to expenses for general management, sales and marketing, finance, audit and legal fees and general operating expenses.
The increase in SG&A expenses for the three months ended March 31, 2023, compared to the same period in fiscal 2022, was primarily driven by increases in headcount-related costs partially offset by savings in directors' and officers' insurance.
Depreciation and amortization
| | | | | | | | | | | | | | | | | | | | | | | |
| Three months ended March 31, | | Change |
| (In thousands, USD) | 2023 | | 2022 | | $ | | % |
Depreciation and amortization | $ | 14,125 | | | $ | 13,175 | | | $ | 950 | | | 7 | % |
The increase in depreciation and amortization expense for the three months ended March 31, 2023, as compared to the same period in fiscal 2022 was mainly due to additions to property and equipment.
Other (income) expense
| | | | | | | | | | | | | | | | | | | | | | | |
| Three months ended March 31, | | Change |
| (In thousands, USD) | 2023 | | 2022 | | $ | | % |
Interest expense, including amortization of deferred financing costs, net | $ | 10,195 | | | $ | 6,624 | | | $ | 3,571 | | | 54 | % |
Change in fair value of warrant liability | (3) | | | (27) | | | 24 | | | (90) | % |
Total other expense | $ | 10,192 | | | $ | 6,597 | | | $ | 3,595 | | | 54 | % |
The increase in other expense for the three months ended March 31, 2023, compared to the same period in fiscal 2022, was due to an increase in interest expenses due to higher interest rates, partially offset by a reduction in the gain on the private placement warrants.
Income taxes
| | | | | | | | | | | | | | | | | | | | | | | |
| Three months ended March 31, | | Change |
| (In thousands, USD) | 2023 | | 2022 | | $ | | % |
Income tax benefit | $ | (369) | | | $ | (2,212) | | | $ | 1,843 | | | (83) | % |
The decrease in income tax benefit for the three months ended March 31, 2023, compared to the same period in fiscal 2022, was primarily due to changes in the jurisdictional mix of earnings and the impact of the valuation allowance maintained against certain deferred tax assets.
Results of Operations for the Years ended December 31, 2022, and 2021
Revenue
| | | | | | | | | | | | | | | | | | | | | | | |
| Years Ended | | Change 2022 |
| (in thousands USD) | December 31, 2022 | | December 31, 2021 | | $ | | % |
Services | $ | 188,985 | | | $ | 188,180 | | | $ | 805 | | | — | % |
Products | 79,462 | | | 60,255 | | | 19,207 | | | 32 | % |
Total Revenue | $ | 268,447 | | | $ | 248,435 | | | $ | 20,012 | | | 8 | % |
Total revenue for the year ended December 31, 2022, increased by $20.0 million, or 8%, to $268.4 million from $248.4 million in 2021.
Services revenue growth of $0.8 million was driven by organic growth from existing customers and $8.5 million from the BMP Acquisition. These increases were partially offset by revenue decreases from Non-Core Customers, declines in deployment revenue, mainly from our largest customer upon the conclusion of their significant LTE transition project in early 2022 and the migration of customers from 2G and 3G technologies to LTE cellular technologies. The rate plans under LTE platforms are typically lower in price than legacy 2G and 3G rate plans. Therefore, the migration resulted in lower revenue per unit connection.
Products revenue growth of $19.2 million was driven primarily by an increase in the number of devices we deployed related to our IoT Solutions. This included revenue of $37.6 million from the BMP Acquisition, which was partially offset by a decrease in revenue from existing IoT Solutions customers. Much of this decline came from our largest customer and the conclusion of their significant LTE transition project in early 2022.
The table below presents how management views our revenue for the years ended December 31, 2022, and 2021, together with the percentage of total revenue represented by each revenue category:
| | | | | | | | | | | | | | | | | | | | | | | |
| Years Ended | | Change 2022 |
| (in thousands USD) | December 31, 2022 | | December 31, 2021 | | $ | | % |
IoT Connectivity | $ | 175,942 | | | $ | 169,022 | | | $ | 6,920 | | | 4 | % |
IoT Solutions | 92,505 | | | 79,413 | | | 13,092 | | | 16 | % |
Total Revenue | $ | 268,447 | | | $ | 248,435 | | | $ | 20,012 | | | 8 | % |
| | | | | | | | | | | |
| Years Ended |
| (in millions) | December 31, 2022 | | December 31, 2021 |
Period End Connections | 15.0 | | | 14.6 | |
Average Connections Count for the Period | 15.2 | | | 13.4 | |
Total revenue for the year ended December 31, 2022, increased by $20.0 million, or 8%, to $268.4 million from $248.4 million for the year ended December 31, 2021.
IoT Connectivity growth of $6.9 million, which includes SIM revenue, was driven by the organic growth of our existing IoT customers as well as $8.3 million from the BMP Acquisition. These increases were offset by a decrease in revenue from Non-Core Customers as well as the migration of customers from 2G and 3G technologies to LTE cellular technologies. The rate plans under LTE platforms are typically lower in price than legacy 2G and 3G rate plans. Therefore, the migration resulted in lower revenue per connection.
We grew our total number of connections from 14.6 million on December 31, 2021, to 15.0 million on December 31, 2022. The 0.4 million increase in the total number of connections is net of approximately 1.2 million connections that were forced to churn due to the 2G/3G sunsets in the United States. Approximately 0.2 million of
these connections were forced to churn on the last day of 2022 when these sunsets for the most part were completed by the end of 2022.
IoT Solutions’ growth of $13.1 million included revenue of $37.5 million from the BMP Acquisition, which was offset by a decline in revenue from existing IoT Solutions customers. Much of this decline came from our largest customer and the conclusion of their significant LTE transition projected in early 2022.
Costs of revenue, exclusive of depreciation and amortization, and gross margins
| | | | | | | | | | | | | | | | | | | | | | | |
| Years Ended | | Change 2022 |
| (in thousands USD) | December 31, 2022 | | December 31, 2021 | | $ | | % |
Cost of services | $ | 67,268 | | | $ | 69,385 | | | $ | (2,117) | | | (3) | % |
Cost of products | 61,886 | | | 51,975 | | | 9,911 | | | 19 | % |
Total cost of revenue | $ | 129,154 | | | $ | 121,360 | | | $ | 7,794 | | | 6 | % |
| | | | | | | | | | | |
| Years Ended |
| Gross margin rate | December 31, 2022 | | December 31, 2021 |
Services | 64.4 | % | | 63.1 | % |
Products | 22.1 | % | | 13.7 | % |
Total gross margins | 51.9 | % | | 51.2 | % |
Total cost of revenue for the year ended December 31, 2022, increased $7.8 million, or 6%, to $129.2 million from $121.4 million for the year ended December 31, 2021.
Cost of services decreased by $2.1 million for the year ended December 31, 2022, compared to the year ended December 31, 2021. This included an increase in carrier costs of $3.6 million from the BMP Acquisition which was more than offset by decreases in carrier costs associated with existing IoT Connectivity revenue and deployment costs as a result of lower deployment revenue.
During fiscal 2022, the gross margin percentage of our services business increased 130 basis points compared to the same period in fiscal 2021. The increase was due to continued improved optimization of our carrier costs.
Cost of products increased by $9.9 million for the year ended December 31, 2022, compared to the year ended December 31, 2021. This included an increase of $24.4 million from the BMP Acquisition which was partially offset by a decrease in the costs of devices associated with lower sales volume from existing IoT Solutions customers.
During fiscal 2022, the gross margin percentage of our products business increased 840 basis points compared to the same period in fiscal 2021. The increase was mainly due to lower volumes from our largest customer’s LTE transition project in fiscal 2022 which came with lower hardware margins.
The table below presents how management views our costs of revenue for the years ended December 31, 2022, and 2021, exclusive of depreciation and amortization:
| | | | | | | | | | | | | | | | | | | | | | | |
| Years Ended | | Change 2022 |
| (in thousands USD) | December 31, 2022 | | December 31, 2021 | | $ | | % |
Cost of IoT Connectivity | $ | 63,051 | | | $ | 65,703 | | | $ | (2,652) | | | (4) | % |
Cost of IoT Solutions | 66,103 | | | 55,657 | | | 10,446 | | | 19 | % |
Total cost of revenue | $ | 129,154 | | | $ | 121,360 | | | $ | 7,794 | | | 6 | % |
| | | | | | | | | | | |
| Years Ended |
| Gross margin rate | December 31, 2022 | | December 31, 2021 |
IoT Connectivity | 64.2 | % | | 61.1 | % |
IoT Solutions | 28.5 | % | | 29.9 | % |
Total gross margins | 51.9 | % | | 51.2 | % |
Total cost of revenue for the year ended December 31, 2022, increased $7.8 million, or 6%, to $129.2 million from $121.4 million for the year ended December 31, 2021.
Cost of IoT Connectivity decreased by $2.7 million for the year ended December 31, 2022, compared to the year ended December 31, 2021. This included an increase in carrier costs of $3.7 million from the BMP Acquisition which was more than offset by decreases in existing carrier costs associated with existing IoT Connectivity revenue.
During fiscal 2022, the gross margin percentage of IoT Connectivity increased 310 basis points compared to the same period in fiscal 2021.The increase in gross margin was due to continued optimization of our carrier costs.
Cost of IoT Solutions increased by $10.4 million for the year ended December 31, 2022, compared to the year ended December 31, 2021. This included an increase of $24.3 million from the BMP Acquisition which was partially offset by decreases in costs associated with lower IoT Solutions revenue from existing customers.
In fiscal 2022, the gross margin percentage of IoT Solutions declined 140 basis points as compared to the same period last year. The decline was mainly due to a greater mix of hardware revenue.
Selling, general, and administrative expenses
| | | | | | | | | | | | | | | | | | | | | | | |
| Years Ended | | Change 2022 |
| (in thousands USD) | December 31, 2022 | | December 31, 2021 | | $ | | % |
Selling, general, and administrative | $ | 112,220 | | | $ | 92,303 | | | $ | 19,917 | | | 22 | % |
Selling, general, and administrative (“SG&A”) expenses relate primarily to expenses for general management, sales and marketing, finance, audit and legal fees and general operating expenses. The increase in SG&A expenses for the year ended December 31, 2022, compared to the year ended December 31, 2021, was primarily driven by salaries and benefits, contractor costs, travel related costs, professional services fees, stock-based compensation, Directors' and Officers' insurance, channel commissions, and internal IT and software license related expenses.
Depreciation and amortization
| | | | | | | | | | | | | | | | | | | | | | | |
| Years Ended | | Change 2022 |
| (in thousands USD) | December 31, 2022 | | December 31, 2021 | | $ | | % |
Depreciation and amortization | $ | 54,499 | | | $ | 50,331 | | | $ | 4,168 | | | 8 | % |
The increase in depreciation and amortization expense was mainly due to the amortization of acquired intangibles from the BMP acquisition.
Goodwill impairment
| | | | | | | | | | | | | | | | | | | | | | | |
| Years Ended | | Change 2022 |
| (in thousands USD) | December 31, 2022 | | December 31, 2021 | | $ | | % |
Goodwill impairment | $ | 58,074 | | | $ | — | | | $ | 58,074 | | | 100 | % |
During the fourth quarter of 2022, we identified circumstances subsequent to the annual goodwill test that would more likely than not reduce the fair value of the reporting unit (the entity) below its carrying value. These impairment indicators included increased interest rates impacting our weighted average cost of capital, an increase in the Company's specific risk premium, an increase in debt-free net working capital needs and a sustained decline in our share price from the third quarter. Our share price dropped significantly from the third quarter of 2022. Given the results of this analysis, we proceeded to perform a goodwill impairment test and determined that the carrying value of our reporting unit exceeded its estimated fair value. Consequently, we recorded a non-cash goodwill impairment charge of $58.1 million in the fourth quarter. This charge does not affect our liquidity or debt covenants.
Other (income) expense
| | | | | | | | | | | | | | | | | | | | | | | |
| Years Ended | | Change 2022 |
| (in thousands USD) | December 31, 2022 | | December 31, 2021 | | $ | | % |
Interest expense, including amortization of deferred financing costs, net | $ | 31,371 | | | $ | 23,260 | | | $ | 8,111 | | | 35 | % |
Change in fair value of warrant liability | (254) | | | (5,267) | | | 5,013 | | | (95) | % |
Total other (income) expense | $ | 31,117 | | | $ | 17,993 | | | $ | 13,124 | | | 73 | % |
The increase in other (income) expense was primarily due to an increase in interest expenses due to higher interest rates and a decrease in income related to the change in fair value of our warrant liability.
Income tax benefit
| | | | | | | | | | | | | | | | | | | | | | | |
| Years Ended | | Change 2022 |
| (in thousands USD) | December 31, 2022 | | December 31, 2021 | | $ | | % |
Income tax benefit | $ | (10,417) | | | $ | (8,776) | | | $ | (1,641) | | | 19 | % |
The increase to the income tax benefit for the year ended December 31, 2022, compared to the income tax benefit for the year ended December 31, 2021, was primarily due to an increase in pre-tax losses and other permanent differences in our foreign jurisdictions partially offset by increases in valuation allowances and increases in taxes due to the permanent disallowance of a portion of the goodwill impairment expense.
Liquidity and Capital Resources
Overview
Our liquidity requirements arise from our working capital needs, our obligations to make scheduled payments of interest and principal on our indebtedness, and our need to fund capital expenditures to support our current operations and to facilitate growth and expansion. We have financed operations and expansion with a combination of debt and equity.
At March 31, 2023, we had total equity of $164.7 million, net of an accumulated deficit of $266.7 million. Our primary sources of liquidity consist of cash totaling $30.6 million and a revolving credit facility of $30.0 million of which the full $30.0 million was available for use for working capital and general business purposes. We believe this will be sufficient to provide working capital, make interest payments and make capital expenditures to support operations and facilitate growth and expansion for the next twelve months.
Our ability to pay dividends on our common stock is limited by restrictions under the terms of the agreements governing our indebtedness. Subject to the full terms and conditions under the agreements governing our indebtedness, we may be permitted to make dividends and distributions under such agreements if there is no event of default and certain pro-forma financial ratios (as defined by such agreements) are met.
Cash Flows as of March 31, 2023
Cash flows provided by operating activities
Net cash provided by operating activities in the three months ended March 31, 2023, improved primarily from changes in working capital driven by impacts from decreased inventory and increases in accounts payable and accrued liabilities due to the timing of payments.
Cash flows used in investing activities
Cash used in investing activities for the three months ended March 31, 2023, was primarily for investments in capital expenditures related to technology equipment, software licenses, and internally developed software.
Cash flows used in financing activities
Cash used in financing activities in the three months ended March 31, 2023, was primarily for loan principal repayments for the term loan and the Premium Financing Agreement.
Cash Flows as of December 31, 2022
Cash flows provided by operating activities
For the year ended December 31, 2022, cash provided by operating activities was $16.4 million. Our operating cash flows improved primarily due to decreases in accounts receivable and inventories, of $9.0 million and $6.5 million, respectively. Accounts receivable decreased due to improved collections of outstanding receivables from customers and inventory decreased due to the conclusion of our largest customer’s LTE transition project. Cash paid for interest increased by $9.3 million in the year ended December 31, 2022, as compared to the year ended December 31, 2021 due to higher interest rates.
For the year ended December 31, 2021, cash used in operating activities was $14.8 million. For the year ended December 31, 2021, our operating cash flows decreased primarily due to increases in accounts receivable and inventories, of $12.1 million and $9.9 million, respectively. These increases were to support the growth of the business, which included a significant investment in inventory for our largest customer’s LTE transition project. Additionally, $8.2 million of payments were made to reduce our outstanding vendor payables.
Cash flows used in investing activities
Cash used in investing activities for the year ended December 31, 2022, was primarily for a cash payment of $46.0 million for the BMP Acquisition. In addition, investments in capital expenditures related to technology equipment, software licenses, and internally developed software resulted in increased cash outflows.
Cash used in investing activities in the year ended December 31, 2021, was $13.4 million, resulting primarily from capital expenditures during the period related to technology equipment, software licenses, and internally developed software.
Cash flows used in financing activities
Cash used in financing activities in the year ended December 31, 2022, was $4.7 million, resulting primarily from a repayment of $3.2 million of long-term debt.
Cash provided by our financing activities in the year ended December 31, 2021, was $104.1 million. For the year ended December 31, 2021, our financing cash flows increased primarily due to the net proceeds from the issuance of common stock of $224.0 million, the receipt of approximately $119.6 million proceeds from the Backstop Notes (net of issuance costs). These cash inflows were partially offset by the $229.9 million settlement of preferred stock, the $3.2 million repayment of long-term debt and repayment of related party notes of $1.5 million, and payment of capital lease obligations of $0.8 million.
Future Liquidity and Capital Resource Requirements
As of March 31, 2023, the Company has $21.2 million in purchase commitments for the remainder of the 2023 fiscal year. Additionally, as of March 31, 2023, the Company has $2.4 million of scheduled principal payments relating to the UBS term loan for the remainder of the 2023 fiscal year.
As of March 31, 2023, the Company has $30.0 million in purchase commitments for the fiscal years 2024 through 2027. The Company also has scheduled principal payments relating to the UBS term loan of $2.4 million for the first three quarters of the fiscal year 2024, with all outstanding principal due on December 24, 2024. Further, the Company has semi-annual interest payments due on $120.0 million related to the Backstop Notes. All outstanding principal on the Backstop Notes is due in full in September 2028.
From 2023 to 2027, we expect to fund supplier and carrier-related purchase and lease commitments (all of which are costs of operating the business) entirely from cash inflows from our customers. We currently expect that the excess cash flows after paying the above-mentioned contractual commitments, as well as other costs of business, such as payroll, costs incurred on suppliers and carrier spend (which is not currently committed contractually in addition to the committed spend), interest and taxes, will be sufficient to meet outstanding debt principal payments in 2023 and 2024.
Our available cash, together with our cash from the results of operations and revolving credit facility are expected to be sufficient to meet our operating expenses, debt service payments, capital requirements and other obligations for at least the next 12 months. However, to increase available liquidity or to fund acquisitions or other strategic activities, we may seek additional financing. We have no commitments for any additional financing and have no lines of credit or similar sources of financing, other than the borrowings available under the Credit Facilities, and the Bank Overdraft Facility. We cannot be sure that we can obtain additional financing on favorable terms, if at all, through the issuance of equity securities or the incurrence of additional debt. Additional equity financing may dilute our stockholders, and debt financing, if available, may restrict our ability to repurchase common stock or debt, declare and pay dividends, raise future capital and make acquisitions. If we are unable to obtain additional needed financing, it may prohibit us from refinancing existing indebtedness and making acquisitions, capital expenditures and/or investments, which could materially and adversely affect our business. We may require additional capital to fund future mergers & acquisitions.
Non-GAAP Financial Measures
In addition to our results determined in accordance with GAAP, we believe the following non-GAAP measures are useful in evaluating our operational performance. We use the following non-GAAP financial information to evaluate our ongoing operations and for internal planning and forecasting purposes. We believe that non-GAAP financial information, when taken collectively, may be helpful to investors in assessing our operating performance. Non-GAAP financial information is presented for supplemental informational purposes only, should not be considered a substitute for financial information presented in accordance with generally accepted accounting principles, and may be different from similarly-titled non-GAAP measures used by other companies.
EBITDA and Adjusted EBITDA
“EBITDA” is defined as net income (loss) before interest expense or interest income, income tax expense or benefit, and depreciation and amortization. “Adjusted EBITDA” is defined as EBITDA adjusted for unusual and other significant items that management views as distorting the operating results from period to period. Such adjustments may include stock-based compensation, integration and acquisition-related charges, tangible and intangible asset impairment charges, certain contingent liability reversals, transformation, and foreign currency transaction gains and losses. EBITDA and Adjusted EBITDA are intended as supplemental measures of our performance that are neither required by, nor presented in accordance with, GAAP. We believe that the use of EBITDA and Adjusted EBITDA provides an additional tool for investors to use in evaluating ongoing operating results and trends and in comparing our financial measures with those of comparable companies, which may present similar non-GAAP financial measures to investors. However, you should be aware that when evaluating EBITDA and Adjusted EBITDA we may incur future expenses similar to those excluded when calculating these measures. In addition, our presentation of these measures should not be construed as an inference that our future results will be
unaffected by unusual or non-recurring items. Our computation of Adjusted EBITDA may not be comparable to other similarly titled measures computed by other companies, because all companies may not calculate Adjusted EBITDA in the same fashion.
Because of these limitations, EBITDA and Adjusted EBITDA should not be considered in isolation or as a substitute for performance measures calculated in accordance with GAAP. We compensate for these limitations by relying primarily on our GAAP results and using EBITDA and Adjusted EBITDA on a supplemental basis. You should review the reconciliation of net loss to EBITDA and Adjusted EBITDA below and not rely on any single financial measure to evaluate our business.
The following table reconciles net loss to EBITDA and Adjusted EBITDA for the periods shown:
| | | | | | | | | | | |
| Three months ended March 31, |
| (In thousands, USD) | 2023 | | 2022 |
Net loss | $ | (18,490) | | | $ | (11,572) | |
Income tax benefit | (369) | | | (2,212) | |
Interest expense | 10,195 | | | 6,624 | |
Depreciation and amortization | 14,125 | | | 13,175 | |
EBITDA | 5,461 | | | 6,015 | |
Change in fair value of warrant liability (non-cash) | (3) | | | (27) | |
Transformation expenses | 1,864 | | | 1,565 | |
Acquisition and integration-related restructuring costs | 3,207 | | | 5,293 | |
Stock-based compensation (non-cash) | 2,570 | | | 2,050 | |
Foreign currency loss (non-cash) | 112 | | | (3) | |
Other | 117 | | | 395 | |
Adjusted EBITDA | $ | 13,328 | | | $ | 15,288 | |
Transformation expenses are related to the implementation of our strategic transformation plan, which includes the costs of a re-write of our core technology platform, expenses incurred to design certain new IoT Solutions, and “go-to-market” capabilities. These expenses are expected to be completed by the end of 2023.
Acquisition and integration-related restructuring costs for the three months ended March 31, 2023, and 2022 are costs associated with legal, accounting diligence, quality of earnings, valuation, and search expenses related to an acquisition or acquisitions. In 2022, they included the BMP Acquisition and in 2023, they included the acquisition of Twilio's IoT business unit. In addition to the costs associated with the acquisitions are costs related to the integration of these acquisitions. They include but are not restricted to professional service costs related to ERP and related systems integrations and migrations, data migration, and finance process integrations. They also include any identified duplicative costs that will eventually be eliminated or are expected to be eliminated in the next 12 months from the acquisition date. Finally, these costs also include discrete costs related to employee severance or retention bonuses attributed to acquisitions or building the current senior management team. In 2022, additional incremental costs related to the initial setup of our SOX program were also included.
The following table reconciles net loss to EBITDA and Adjusted EBITDA for the periods shown:
| | | | | | | | | | | |
| Years Ended |
| (in thousands, USD) | December 31, 2022 | | December 31, 2021 |
Net loss | $ | (106,200) | | | $ | (24,776) | |
Income tax benefit | (10,417) | | | (8,776) | |
Interest expense | 31,371 | | | 23,260 | |
Depreciation and amortization | 54,499 | | | 50,331 | |
EBITDA | (30,747) | | | 40,039 | |
Goodwill impairment loss | 58,074 | | | — | |
Change in fair value of warrant liability (non-cash) | (254) | | | (5,267) | |
Transformation expenses | 8,302 | | | 8,937 | |
Acquisition and integration-related restructuring costs | 16,214 | | | 11,287 | |
Stock-based compensation (non-cash) | 10,296 | | | 4,564 | |
Foreign currency loss (non-cash) | 4 | | | 344 | |
Other | 946 | | | 1,025 | |
Adjusted EBITDA | $ | 62,835 | | | $ | 60,929 | |
Transformation expenses are related to the implementation of our strategic transformation plan, which include the costs of a re-write of our core technology platform, expenses incurred to design certain new IoT Solutions and “go-to-market” capabilities. These expenses are expected to be completed by the end of 2023.
Acquisition and integration-related restructuring costs for the years ended December 31, 2022 and 2021 are costs associated with legal, accounting diligence, quality of earnings, valuation and search expenses related to an acquisition or acquisitions. In 2021, they included the Integron acquisition and in 2022 they included the BMP Acquisition. In addition to the costs associated with the acquisitions are costs related to the integration of these acquisitions. They include but are not restricted to professional service costs related to ERP and related systems integrations and migrations, data migration, and finance process integrations. They also include any identified duplicative costs that will eventually be eliminated or expected to be eliminated in the next 12 months from the acquisition date. Finally, these costs also include discrete costs related to employee severance or retention bonuses attributed to acquisitions or building the current senior management team. In both 2021 and 2022, additional incremental legal and finance costs related to the preparation of our going public or initial setup of our SOX program were also included.
Concentration of Credit Risk and Off-Balance Sheet Arrangements
Cash is a financial instrument that is potentially subject to concentrations of credit risk. Our cash is deposited in accounts at large financial institutions, and amounts may exceed federally insured limits. We believe it is not exposed to significant credit risk due to the financial strength of the depository institutions in which the cash is held.
We have a total of $51.2 million of purchase commitments payable that are not recorded as liabilities on the balance sheet as of March 31, 2023. We have no other financial instruments or commitments with off-balance-sheet risk of loss.
We had a total of $29.0 million of purchase commitments payable that are not recorded as liabilities on the balance sheet as of December 31, 2022. We did not have other financial instruments or commitments with off-balance-sheet risk of loss.
Critical Accounting Estimates
Our discussion and analysis of our results of operations, liquidity and, capital resources are based on our consolidated financial statements which have been prepared in conformity with GAAP. The preparation of these
financial statements requires us to make estimates and assumptions that affect the reported amounts of assets and liabilities and the disclosure of contingent assets and liabilities as of the date of the financial statements, as well as the reported expenses incurred during the reporting periods. Our estimates are based on our historical experience and on various other factors that we believe are reasonable under the circumstances, the results of which form the basis for making judgments about the carrying value of assets and liabilities that are not readily apparent from other sources.
Actual results may differ from these estimates under different assumptions or conditions. We believe that the accounting policies discussed below are critical to understanding our historical and future performance, as these policies relate to the more significant areas involving management’s judgments and estimates.
While our significant accounting policies are described in the notes to our consolidated financial statements, we believe that the following accounting policies are most critical to understanding our financial condition and historical and future results of operations:
Revenue Recognition
We derive revenue primarily from IoT Connectivity and IoT Solutions. IoT Connectivity arrangements provide customers with secure and reliable wireless connectivity to mobile and fixed devices through various mobile network carriers. Revenue from IoT Connectivity consists of monthly recurring charges MRCs and overage/usage charges, and contracts are generally short-term in nature (i.e., month-to-month arrangements). Customers generally may cancel with 30 days’ notice without substantive cost or fees. Revenue for MRCs and overage/usage charges are recognized over time as we satisfy the performance obligation (generally starting when an enrolled device is activated on our platform). MRCs are billed monthly in advance (generally in the last week of a month); any amounts billed for which the service has not been provided as of the balance sheet dates are reported as a contract liability and components of deferred revenue. Overage/usage charges are billed in arrears on a monthly cycle. Overage/usage charges are evaluated on a monthly basis, and any overage/usage charges determined by management as unlikely to be collected due to a customer disputing the charge or due to a concession are reserved. Reserved items are written off when deemed uncollectible or recognized as revenue if collected. Certain IoT Connectivity customers also have the option to purchase products and/or equipment (e.g., subscriber identification module or “SIM” cards, routers, phones, or tablets) from us on an as needed basis. Sales of products IoT Connectivity customers are recognized when control is transferred to the customer, which is typically upon shipment of the product.
IoT Solutions arrangements include device solutions (including connectivity), deployment services, and/or technology-related professional services. We evaluate each IoT Solutions arrangement to determine the contract for accounting purposes. For arrangements with multiple performance obligations, which represent promises within an arrangement that are distinct, we allocate revenue to all distinct performance obligations based on their relative stand-alone selling price ("SSPs"). When available, we use observable prices to determine SSPs. When observable prices are not available, SSPs are established that reflect our best estimates of what the selling price of the performance obligations would be if they were sold regularly on a stand-alone basis. Our process for estimating SSPs without observable prices consider multiple factors that may vary depending upon the unique facts and circumstances related to each performance obligation including, where applicable, prices charged by us for similar offerings, market trends in the pricing for similar offerings, product-specific business objectives and the estimated cost to provide the performance obligation. Hardware, deployment services, and connectivity services generally have readily observable prices. The standalone selling price of our warehouse management services (which is associated with our bill-and-hold inventory and determined to be immaterial as discussed below) was determined using a cost-plus-margin approach with the primary assumptions including Company profit objectives, internal cost structure, and current market trends. Device and other hardware sales in IoT Solutions arrangements are generally accounted for as separate contracts since the customer is not obligated to purchase additional services when committing to the purchase of any products. Such sales are typically recognized upon shipment to the customer. However, in certain contracts, the customer has requested us to hold the products ordered for later shipment to the customer’s remote location or to the customer’s end user as a part of a vendor managed inventory model. In these situations, we have concluded that transfer of control to the customer occurs prior to shipment. In these “bill-and-hold” arrangements, the right to invoice, transfer of legal title and transfer of the risk and rewards associated with
the products occurs when we receive the hardware from a third-party vendor and have deemed it to be functional. Additionally, the products are identified both physically and systematically as belonging to a specific customer, are usable by the customer, and are only shipped, used, or disposed as directed by the specific customer. Based on these factors, we recognize revenue on bill-and-hold hardware when the hardware is received by us and deemed functional.
Deployment services consist of us preparing hardware owned by a customer for use by a customer’s end user. Deployment and connectivity may both be included within a single IoT Solutions contract and are considered separate performance obligations. While consideration for deployment services is generally fixed when ordered by the client, consideration for connectivity services is variable and solely related to the connectivity services. Therefore, the fixed consideration is allocated to the deployment services and is recognized as revenue when the services are provided (i.e., when the related hardware is shipped to the customer). Connectivity within IoT Solutions contracts are recognized similar to the IoT Connectivity as described above, since such contracts are generally short term in nature and variability is resolved each month as the services are provided.
Professional services are generally provided over a contract term of one to two months. Revenue is recognized over time on an input method basis (typically, based on hours completed to date and an estimate of total hours to complete the project).
Internal Use Software
Certain costs of platform and software applications developed for internal use are capitalized as intangible assets. Capitalization of costs begins when two criteria are met: (i) the preliminary project stage is completed (i.e., application development stage) and (ii) it is probable that the software will be completed and used for its intended function. We also capitalize costs related to specific upgrades and enhancements when it is probable the expenditures will result in additional functionality. Costs incurred for maintenance, minor upgrades and enhancements are recorded under selling, general and administrative expenses in the consolidated statement of operations as incurred. Costs related to preliminary project activities and post implementation operating activities are also recorded under selling, general and administrative expenses in the consolidated statement of operations as incurred. We amortize the capitalized costs on a straight-line basis over the useful life of the asset. The average useful life for capitalized internal use computer software is between 3-5 years. Capitalized internal use computer software, net of accumulated amortization, was $30.2 million and $25.2 million as of December 31, 2022 and 2021, respectively, and was included in intangible assets.
Accounting for Business Combinations
We account for acquired businesses using the acquisition method of accounting, which requires that assets acquired and liabilities assumed be recorded at their respective fair values on the date of acquisition. We assign fair value of the consideration paid to the underlying net assets of the acquired business based on their respective fair values. Any excess of the purchase price over the estimated fair value of the net assets acquired is recorded to goodwill. Intangible assets are amortized over the expected life of the asset. We recognize acquisition-related expenses and restructuring costs separately from the business combination and expense as incurred. All changes in accounting for deferred tax asset valuation allowances and acquired income tax uncertainties after the measurement period are recognized as a component of provision for income taxes. We make significant assumptions and estimates in determining the preliminary estimated purchase price and the preliminary allocation of the estimated purchase in the consolidated financial statements. These preliminary estimates and assumptions are subject to change as we finalize the valuations. The final valuations may change significantly from the preliminary estimates. Fair value determinations and useful life estimates are based on, among other factors, estimates of expected future cash flows from revenue of the intangible assets acquired, estimates of appropriate discount rates used to calculate the present value of expected future cash flows, estimated useful lives of the intangible assets acquired, customer attrition rates, future changes in technology and brand awareness, and other factors. Although we believe the assumptions and estimates we have made have been reasonable and appropriate, they are based, in part, on historical experience, information obtained from the management of the acquired companies and future expectations. For these and other reasons, actual results may vary significantly from estimated results. During the preliminary purchase price measurement period, which may be up to one year from the business combination date, we will record adjustments
to the provisional amounts recognized at the acquisition date to reflect new information obtained about facts and circumstances that existed as of the acquisition date, with a corresponding offset to goodwill. After the preliminary purchase price measurement period, we will record adjustments to assets acquired or liabilities assumed subsequent to the purchase price measurement period in our operating results in the period in which the adjustments were determined.
Goodwill
Goodwill is not amortized but tested for impairment on an annual basis and between annual tests whenever events or changes in circumstances indicate that the carrying amount may not be recoverable. Goodwill is tested for impairment at the reporting unit level, which is defined as an operating segment, or one level below the operating segment. We operate in one operating segment, which is our only reporting unit.
We test for an indication of goodwill impairment on October 1st of each year or when indicators of impairment exist. A significant amount of judgment is involved in determining if an indicator of impairment has occurred. We perform a qualitative assessment to determine whether the existence of events or circumstances leads to a determination that it is more likely than not the fair value of the reporting units is less than its carrying amount. Qualitative factors that we consider include macroeconomics conditions such as geographical location and fluctuations in foreign exchange, industry and market conditions, financial performance, a significant adverse change in legal factors or in the business climate, unanticipated competition, entity-specific events and share price trends. If, based on the qualitative assessment, it is determined that it is more likely than not the fair value of the reporting unit is less than its carrying amount, then a quantitative test is performed and an impairment loss is recognized in an amount equal to the excess of the carrying value over the fair value of the reporting unit, limited to the total amount of goodwill allocated to that reporting unit
During the year, we experienced a decline in our stock price and market capitalization that represented an indicator of impairment as the observed declines were substantial and sustained. Increasing interest rates also impacted the Company’s weighted cost of capital, the company-specific risk premium, and its debt-free net working capital needs, of which all attributed to additional indicators of impairment. As such, we performed qualitative and quantitative goodwill impairment tests during the third and fourth quarters.
At the end of the fourth quarter, we concluded that the carrying value of our reporting unit exceeded its estimated fair value and recorded a goodwill impairment loss of $58.1 million. The fair value of goodwill was estimated by equally weighing the results of the income approach and the market approach. When performing the income approach, the projected financial information and discount rate were developed using market participant-based assumptions. The cash-flow projections were based on a 12-year financial forecast developed by management that included revenue projections, capital spending trends, and investment in working capital to support anticipated revenue growth, which are updated at least annually and reviewed by management. The selected discount rate considered the risk and nature of the respective cash flows, and the rates of return market participants would require investing their capital in our reporting unit. The key assumptions used in the impairment analysis included long term growth rate of 3.5% and revenue growth rate margins ranging from 5.6% to 23.7%, a discount rate of 20% and market factors such as earnings multiples from comparable publicly traded companies. Fair value determinations require considerable judgment and are sensitive to changes in underlying assumptions and factors. As a result, there can be no assurance that the estimates and assumptions made for the purposes of the impairment tests will prove to be an accurate prediction of the future.
Income Taxes
We account for income taxes using the asset and liability method. Under this method, deferred tax assets and liabilities are recognized for the future tax consequences of temporary differences between the carrying amounts and tax bases of assets and liabilities using enacted rates. The effect of a change in tax rates on deferred taxes is recognized in income in the period that includes the enactment date.
Management judgment is required in determining our provision for income taxes, our deferred tax assets and liabilities, and any valuation allowance recorded against our deferred tax assets.
A valuation allowance is recorded to reduce deferred income tax assets to an amount, which in the opinion of management is more likely than not to be realized. We consider factors such as the cumulative income or loss in recent years; reversal of deferred tax liabilities; projected future taxable income exclusive of temporary differences; the character of the income tax asset, including income tax positions; tax planning strategies and the period over which we expect the deferred tax assets to be recovered in the determination of the valuation allowance. In the event that actual results differ from these estimates or we adjust our estimates in the future, we may need to adjust our valuation allowance, which could materially impact our financial position and results of operations.
We recognize the financial statement effect of an uncertain income tax position when it is more likely than not, based on the technical merits, that the position will be sustained upon examination. Recognized income tax positions are measured at the largest amount that is greater than 50% likely to be realized. We are subject to income taxes in the U.S. and numerous foreign jurisdictions. The evaluation of our uncertain tax positions involves significant judgment in the interpretation and application of GAAP and complex domestic and international tax laws, including the Tax Cuts and Jobs Act of 2017 and matters related to the allocation of international taxation rights between countries including intercompany transactions and obligations. Although management believes our reserves are reasonable, no assurance can be given that the final outcome of these uncertainties will not be different from that which is reflected in our reserves. Reserves are adjusted considering changing facts and circumstances, such as the closing of a tax examination. Resolution of these uncertainties in a manner inconsistent with management’s expectations could have a material impact on our financial condition and operating results.
Recent accounting pronouncements
As an emerging growth company (“EGC”), the JOBS Act allows us to delay adoption of new or revised accounting pronouncements applicable to public companies until such pronouncements are applicable to private companies. We have elected to use this extended transition period under the JOBS Act until such time that we no longer considered to be an EGC.
See notes to the accompanying consolidated financial statements for more information about recent accounting pronouncements, the timing of their adoption, and our assessment, to the extent we have made one, of their potential impact on our financial condition and our results of operations.
MANAGEMENT
The following sets forth certain information, as of the date hereof, concerning the persons who serve as our directors and executive officers.
| | | | | | | | | | | | | | |
| Name | | Age | | Title |
Romil Bahl | | 54 | | President, Chief Executive Officer and Director |
Paul Holtz | | 46 | | Executive Vice President and Chief Financial Officer and Treasurer |
Tushar Sachdev | | 50 | | Executive Vice President and Chief Technology Officer |
Louise Winstone | | 44 | | Executive Vice President and Chief Human Resources Officer |
Bryan Lubel | | 58 | | Executive Vice President, Connected Health |
Jack W. Kennedy Jr. | | 47 | | Executive Vice President, Chief Legal Officer and Secretary |
Cheemin Bo-Linn | | 69 | | Director |
Timothy M. Donahue | | 74 | | Director (Chair) |
H. Paulett Eberhart | | 69 | | Director |
James Geisler | | 56 | | Director |
Robert P. MacInnis | | 56 | | Director |
Michael K. Palmer | | 37 | | Director |
Mark Neporent | | 65 | | Director |
Tomer Yosef-Or | | 43 | | Director |
Executive Officers
Romil Bahl. Mr. Bahl serves as our President, Chief Executive Officer and as a member of our Board. Mr. Bahl brings 30 years of experience delivering high growth among SaaS and IoT companies and has served as President and Chief Executive Officer of KORE since October 2017. Prior to joining KORE, Mr. Bahl served as President and Chief Executive Officer of Lochbridge, a leading technology consulting and solutions provider in the IoT and digital enablement space, from November 2015 to October 2017. Mr. Bahl is also a member of the board of directors of Perficient, Inc., a global digital consulting company. Previously, he served as Executive Vice President and General Manager, Global Industries for Computer Sciences Corporation, a global provider of information technology and professional services and solutions, where he managed a ~$9B business from April 2014 to November 2015, and as Chief Executive officer of PRGX Global, Inc., a data focused analytics company, from January 2009 to November 2013. Mr. Bahl has also had leadership roles at A.T. Kearney, Infosys and Deloitte Consulting. Mr. Bahl holds a Masters of Business Administration from The University of Texas at Austin and a Bachelor of Engineering degree from the Directorate of Marine Engineering & Technology in Kolkata, West Bengal, India.
Mr. Bahl’s qualifications to serve as a member of our board of directors include his nearly 30 years of experience working with SaaS and IoT companies, his deep expertise in managing companies in the IoT and technology solutions space and his leadership skills developed over his career with various companies.
Paul Holtz. Mr. Holtz serves as our Executive Vice President, Chief Financial Officer and Treasurer. Mr. Holtz’s role at KORE supports our focus on service delivery and to help optimize financial performance. As Chief Financial Officer, Mr. Holtz is responsible for managing all aspects of the organization’s financial operations. From November 2021 to March 2022 Mr. Holtz served as Interim Chief Financial Officer and as a Vice President of Corporate Performance, Planning and Analytics since May 2017. Prior to joining KORE, Mr. Holtz held a number of senior positions, most recently as Head of Finance for the Office of the COO at BlackBerry. Mr. Holtz CPA, CA received his Honours Bachelor’s Degree in Business Administration and Accounting from Wilfrid Laurier University. He is also a member of the Chartered Professional Accountants of Canada (CPA Canada).
Tushar Sachdev. Mr. Sachdev serves as Chief Technology Officer and Executive Vice President, Analytics, where he oversees current technology and sets KORE’s future technology vision, strategy, and roadmap. Mr. Sachdev joined KORE in February 2018. From April 2010 to February 2018, Mr. Sachdev served in various roles with PRGX Global, Inc., a multinational provider of recovery audit, consulting and software services, most notably
Senior Vice President & Chief Technology Officer starting in July 2013. Mr. Sachdev also previously worked as a Principal Architect with Infosys Technologies Limited from November 2000 to August 2009 and has previously worked with other global outsourcing organizations, including Mastek and NIIT. He has a Bachelor’s Degree in engineering from the University of Mumbai and also a Master’s Degree in economics from the University of London.
Louise Winstone. Ms. Winstone serves as our Executive Vice President and Chief Human Resources Officer, where she is responsible for leading the global Human Resources function. Louise brings more than 15 years of international human resources experience to KORE, having most recently served as the Chief Human Resources Officer at PRGX, where she oversaw the global HR function in 27 countries. Prior to PRGX, Louise was with Barclays Bank in London and has held a number of HR roles within Financial and Professional Services firms in the UK. Louise holds a Bachelor’s Degree and Master’s Degree in HR Management from Middlesex University.
Bryan Lubel. Mr. Lubel serves as our Executive Vice President of Connected Health. Mr. Lubel has served as Executive Vice President of Connected Health since January 2021, and Executive Vice President of IoT Managed Services at KORE from November 2019 to December 2020. Prior to joining KORE, Mr. Lubel served as President of Integron Inc., a leading IoT Managed Services provider in the healthcare and life sciences market, from January 2008 to November 2019. Previously, he served as Vice President and General Manager of North American Office Services-Xerox Global Services, the leading provider of enterprise document managed services, from April 2006 to January 2008. Mr. Lubel served as President and Chief Executive Officer of Gyricon, LLC, a technology spinout of Xerox’s famed PARC laboratories (Palo Alto Research Center) where SmartPaperTM was developed from August 2003 to January 2006. Mr. Lubel has also had leadership roles at Xerox Corp., The Sutherland Group Ltd, Ziff-Davis Education Inc. and Compaq Computer Corp. Mr. Lubel holds a B.S. of Business Administration—Management Information Systems from The State University of New York at Fredonia.
Jack W. Kennedy Jr. Mr. Kennedy serves as our Executive Vice President, Chief Legal Officer and Secretary. Mr. Kennedy joined KORE in October 2021. From 2009 to 2013 and from November 2016 to October 2021, he was Vice President and Corporate Counsel for PRGX Global, Inc., a multinational provider of recovery audit, consulting and software services, where he provided legal advice on all aspects of the company’s operations. In 2013, Mr. Kennedy started as Senior Vice President & Chief Legal Officer at Streamline Health Solutions, Inc., a provider of healthcare information technology services, where he later became Senior Vice President, Administration and served until 2016. Mr. Kennedy has also served as in-house counsel for Stiefel Laboratories, Inc., a specialty pharmaceutical company. Prior to his in-house legal career, Mr. Kennedy practiced at the law firms of Troutman Sanders LLP in Atlanta, Georgia and Akin Gump Strauss Hauer & Feld LLP in Houston, Texas. He received a JD from Tulane University and a BA and BS from Mercer University and is admitted to the state bars of Texas and Georgia.
Non-Employee Directors
Cheemin Bo-Linn. Bo-Linn serves as a member of our Board. She has operational experience as a Chief Executive Officer, and in multiple Vice President roles at a Fortune 100 company. Her governance expertise includes her previous election as board of director of seven public companies including as Lead Independent Director and Chair of every major committee including Chair of the Audit Committee at three publicly traded companies. From January 2013 through early 2023, Dr. Bo-Linn was the Chairperson and Chief Executive Officer of Peritus Partners Inc., a global analytics and valuation accelerator company which provides strategy and operations expertise in technology, cybersecurity, financial structures, and digital transformation. From September 2010 to November 2012, Dr. Bo-Linn was Chief Marketing Officer and Chief Revenue Officer at NetLine Corporation, the largest B2B internet digital content syndication network, and mobile applications company. Prior to NetLine Corporation, Dr. Bo-Linn held multiple C-suite and M&A partner roles at various companies including at IBM as Vice-President growing multi-billion-dollar P&L businesses. Dr. Bo-Linn presently serves as Lead Independent Director at Blackline Safety Corp. (IoT SaaS connected worker technologies and gas detection), and a member of the Board of Directors at each of Flux Power (energy commerce electrification) and Lake Resources (lithium technology). She is a former member of the Board of Directors of BMCH (now Builders FirstSource), Data IO (security), Sphere 3d (enterprise data services and cryptocurrency mining) and Violin Memory (technology). Dr. Bo-Linn has been recognized with the “Top 50” Directors award from the National Association of Corporate Directors,
was inducted into the 2015 “Hall of Fame for Women in Technology”, and recognized as a Financial Times 2021 “Top 100 Diverse Director”. Dr. Bo-Linn holds a Doctorate of Education in “Computer-based Management Information Systems and Organizational Change” from the University of Houston and is a graduate of Stanford University Graduate School of Business Executive Certificate Program.
Dr. Bo-Linn’s qualifications to serve as a member of our board of directors include her extensive knowledge of the IoT industry and experience as audit chair and executive and director of private and public high growth technology and SaaS companies.
Timothy M. Donahue. Mr. Donahue serves as member of our Board. Mr. Donahue served as the Chief Executive Officer of Nextel Communications Inc., a nationwide wireless telecommunications company, from 1999 until 2005, when Nextel was merged with Sprint Corporation to form Sprint Nextel Corporation. Thereafter, and until 2006, Mr. Donahue was the Executive Chairman of Sprint Nextel and the Chairman of the Sprint Nextel Corporation. From 1996 until his appointment as Chief Executive Officer, Mr. Donahue served as the President and Chief Operating Officer of Nextel. During his tenure at Nextel, Nextel experienced significant improvements in financial performance, including significant growth in revenue and EBITDA. Over that same period, the market capitalization of the company increased from approximately $16 billion to approximately $40 billion. Mr. Donahue started his telecommunications career with McCaw Cellular in 1986 as president of its paging division. Mr. Donahue is currently a member of the board of directors of Ligado Networks (wireless network), and AURA Network Systems (communications), and former member of the board of directors of NVR Inc. (home builder). Mr. Donahue is a former director of ADT Corporation (home security); Covidien plc (medical devices); Eastman Kodak Company (imaging); Nextel Partners Inc. (telecommunications); and Tyco International Ltd. (diversified). Mr. Donahue also served on the board of John Carroll University and is the former chairman of the Cellular Telecommunications & Internet Association. In 2004, Institutional Investor Magazine honored Mr. Donahue as the best chief executive officer in the telecommunications services and wireless sector based on ratings by investors and brokerage firm analysts. Mr. Donahue received his BA in English Literature from John Carroll University.
Mr. Donahue’s qualifications to serve as a member of our board of directors include his deep IoT industry knowledge and experience in leadership roles at numerous wireless and telecommunications companies. Mr. Donahue has previously served on the boards of both public and private companies.
H. Paulett Eberhart. Ms. Eberhart serves as a member of our Board. Ms. Eberhart is Chairman and Chief Executive Officer of HMS Ventures, a privately-held business involved with technology services and the acquisition and management of real estate, since 2014. Previously, she was President and Chief Executive Officer of CDI Corp., a provider of engineering and information technology outsourcing and professional staffing services, from 2011 through 2014; Chairman and Chief Executive Officers of HMS Ventures from 2009 to 2011; and President and Chief Executive Officer from Invensys Process Systems, Inc., a process automation company, from 2007 to 2009. Ms. Eberhart had an extensive career at Electronic Data Systems (EDS) serving in various executive financial and operational roles. Ms. Eberhart is a Certified Public Accountant and is also a director of LPL Financial Holdings Inc., Valero Energy Corporation and Fluor Corporation. She is a former director of Anadarko Petroleum Corporation, serving as lead director, Advanced Micro Devices (AMD) and Cameron International Corporation.
Ms. Eberhart’s qualifications to serve as a member of our board of directors include her significant experience as an executive and director of technology companies.
James Geisler. Mr. Geisler serves as a member of our Board. Mr. Geisler has been an independent consultant since May 2021. From 2014 through May 2021, Mr. Geisler was a Senior Operating Partner of Cerberus Operations & Advisory Company (“COAC”), where he led due diligence matters and operational initiatives. Mr. Geisler is Chairman of National Dentex Labs and Audit Committee Chairman of SubCom. Mr. Geisler has previously been a member of the board of directors of DynCorp International, PaxVax, Keane Group and Your Community Bank. Prior to joining COAC, Mr. Geisler was co-Chief Financial Officer for United Technologies Corporation (“UTC”) from 2004 to 2008 and responsible for UTC’s acquisition strategy and activity. Mr. Geisler graduated from summa cum laude from the University of Kentucky with B.B.A. in finance and earned a MBA at the University of Virginia’s Darden Graduate School of Business Administration.
Mr. Geisler’s qualifications to serve as a member of our board of directors include his significant previous experience as a public company director.
Robert P. MacInnis. Mr. MacInnis serves as a member of our Board. Mr. MacInnis has worked at ABRY Partners since December 1998 where he is currently a Partner. Mr. MacInnis also currently serves on the board of directors of Aegis Sciences Corp. and Automated Healthcare Solutions. In the past, Mr. MacInnis has served on the board of Consolidated Theatres, RCN Cable, Sidera Networks, Network Communications, Inc., XAnd, Datapipe, North American Dental Group, Muzak LLC, Proquest, Psychological Services, Inc., and several others. Prior to working at ABRY Partners, Mr. MacInnis was a senior manager at PricewaterhouseCoopers LLP from June 1991 through May 1997. Mr. MacInnis graduated summa cum laude from Merrimack College with a B.S. in business and received an M.B.A. summa cum laude from Boston University.
Mr. MacInnis’ qualifications to serve as a member of our board of directors include his significant transactional and management experience developed over his career with ABRY Partners.
Michael K. Palmer. Mr. Palmer serves as a member of our Board. Mr. Palmer is a Managing Director at Cerberus within Cerberus’ private equity platform, which invests in global companies across various industries and geographies. In this role, Mr. Palmer helps support Cerberus’ private equity investments in healthcare, telecommunications and technology companies. Mr. Palmer has assisted in the identification of opportunities to collaborate with innovative managers and invest in sectors undergoing transformation. Mr. Palmer has also contributed to the development of Cerberus’ investing practice in emerging markets and he currently serves on Cerberus’ Emerging Markets Investment Committee. Mr. Palmer is also on the board of directors of Stratolaunch, an American aerospace company that develops and operates technologies to fulfill national priorities; and AURA Network Systems, a company focused on developing a dedicated nationwide air-to-ground wireless communications network. Mr. Palmer previously served on the board of directors of Steward Health Care (an accountable care organization), Covis Pharma (a specialty pharmaceuticals company), PaxVax Global (a global specialty vaccines business), and Print Media Holdings (a division of YP Holdings, which was an advertising solutions platform that Cerberus carved out of AT&T). Mr. Palmer is a graduate of Duke University.
Mr. Palmer’s qualifications to serve as a member of our board of directors include his significant management experience developed over his career with Cerberus and prior service on the boards of various companies.
Mark Neporent. Mr. Neporent serves as a member of our Board. Mr. Neporent has been Chief Operating Officer of Cerberus Capital Management, L.P. since 1998, where he has also served as Senior Legal Counsel since January 2019. He was previously General Counsel of Cerberus Capital Management, L.P. from 1998 until January 2019. Mr. Neporent is a director of The Hamburg Commercial Bank and FirstKey Homes LLC and a member of the Executive Committee of the Board of Trustees for Syracuse University. Mr. Neporent is a former director of MCI WorldCom, SuperValu Inc. SSA Global Technologies, AMC Corporation, Ally Financial (formerly GMAC), and Chrysler Holdings (parent of Chrysler Financial Corp.), among others.
Mr. Neporent’s qualifications to serve as a member of our board of directors include his significant experience as a public company director.
Tomer Yosef-Or. Mr. Yosef-Or serves as a member of our Board. Mr. Yosef-Or is a Partner at ABRY Partners and joined the firm in 2005. Prior to joining ABRY Partners, Mr. Yosef-Or was a member of the Financial Institution Group at Bear Stearns Investment Banking Department. Previously, he was a member of the Securitization Transaction Group at Deloitte & Touche. Mr. Yosef-Or is involved in media, communications technology, and software services investments in the internet infrastructure, IoT, managed cloud, capital markets solutions, satellite communication, digital media, contact center software, and healthcare software sectors. Mr. Yosef-Or previously served on the boards of Alvaria, Basefarm, CapRock, Casamba, CyrusOne, Datapipe, Emerging Markets Communications, Hosted Solutions, MobileHelp, Options IT, Root Datacenters, Telx, Q9 Networks, and Xand. Mr. Yosef-Or is an honors graduate of the Rutgers Business School New Brunswick Undergraduate Program.
Mr. Yosef-Or’s qualifications to serve as a member of our board of directors include his ability to provide the insight and perspectives of a former investment banker at one of the world’s largest investment banks. He brings
experience with financing and capitalization strategies. His service on the boards of several private companies in diverse industries allows him to offer a broad perspective on risk management and operating issues facing corporations today.
Family Relationships
There are no family relationships among our directors and executive officers.
Composition of the Board of Directors
In accordance with the terms of our amended and restated bylaws, our board of directors may establish the authorized number of directors from time to time by resolution. Our board of directors consists of 9 members. In accordance with our charter, our board of directors is divided into three classes with staggered three-year terms. At each annual meeting of stockholders, the successors to directors whose terms then expire will be elected to serve from the time of election and qualification until the third annual meeting following election. Our directors are divided among the three classes as follows:
•the Class I directors are Timothy Donahue, Cheemin Bo-Linn and James Geisler and their terms will expire at the annual meeting of stockholders to be held in 2025;
•the Class II directors are Michael Palmer, Mark Neporent and H. Paulett Eberhart and their terms will expire at the annual meeting of stockholders to be held in 2023; and
•the Class III directors are Robert MacInnis, Tomer Yosef-Or and Romil Bahl and their terms will expire at the annual meeting of stockholders to be held in 2024.
As nearly as possible, each class will consist of one-third of the directors. From 2028, the board of directors will no longer be classified under Section 141(d) of the General Corporation Law of the State of Delaware (the “DGCL”) and the directors shall no longer be divided into three classes.
Timothy Donahue serves as Chairman of our board of directors.
Director Independence
The Board assesses the independence of each director annually, and of each director nominee, in accordance with our Corporate Governance Guidelines and NYSE listing standards. The independence guidelines in the Corporate Governance Guidelines are consistent with the independence requirements in the NYSE listing standards and include guidelines as to categories of relationships that are considered not material for purposes of director independence.
A majority of the members of the Audit Committee, the Nominating and Corporate Governance Committee, and the Compensation Committee must be independent under NYSE listing standards and our Corporate Governance Guidelines. Pursuant to the charters of the Audit Committee and the Compensation Committee, respectively, members of these committees also must satisfy separate independence standards based on requirements of the SEC and NYSE, respectively.
The Board has determined that a majority (eight of nine) of our directors are independent. Each member, including the chair, of each of the Audit Committee, the Nominating and Corporate Governance Committee and the Compensation Committee qualifies as independent. In making its determinations as to the independence of the directors, the Board reviewed relationships between the Company and each of them, including ordinary course commercial relationships in the last three years. The Board has determined the following directors to be independent: Timothy M. Donahue, Cheemin Bo-Linn, Robert P. MacInnis, Michael K. Palmer, Tomer Yosef-Or, Mark Neporent, H. Paulett Eberhart and James Geisler.
Committees of the Board of Directors
Our board of directors directs the management of our business and affairs, as provided by Delaware law, and conducts its business through meetings of the board of directors and standing committees. We have a standing audit committee, compensation committee and nominating and corporate governance committee, each of which operate under a written charter.
In addition, from time to time, special committees may be established under the direction of the board of directors when the board deems it necessary or advisable to address specific issues. Copies of our committee charters will be posted on our website, www.korewireless.com, as required by applicable SEC and NYSE rules. The information on or available through any of such website is not deemed incorporated in this prospectus and does not form part of this prospectus.
Audit Committee
Our audit committee consists of Cheemin Bo-Linn, H. Paulett Eberhart and James Geisler, with Cheemin Bo-Linn serving as the chair of the committee. Our board of directors has determined that each of Dr. Bo-Linn, Ms. Eberhart and Mr. Geisler meet the independence requirements of the Sarbanes-Oxley Act, or the Sarbanes-Oxley Act, Rule 10A-3 under the Exchange Act and the applicable listing standards of NYSE. At the time of listing, the audit committee needs at least one independent director. However, within 90 days of listing, the audit committee shall be comprised by a majority of independent directors and at the one year anniversary of listing the audit committee will need to be comprised of all independent directors. In such regard, the board will appoint one new member to meet the independence criteria to comply with the listing requirements. Each member of our audit committee can read and understand fundamental financial statements in accordance with NYSE audit committee requirements. In arriving at this determination, the board has examined each audit committee member’s scope of experience and the nature of their prior and/or current employment.
Our board of directors has determined that Cheemin Bo-Linn qualifies as an audit committee financial expert within the meaning of SEC regulations and meets the financial literacy requirements of the NYSE rules. In making this determination, our board has considered Cheemin Bo-Linn’s formal education and previous and current experience in financial and accounting roles. Both our independent registered public accounting firm and management periodically will meet privately with our audit committee.
Our Audit Committee’s responsibilities include:
•to review, oversee, and discuss with the independent registered public accounting firm their annual audit plan, including the timing and scope of audit activities, and monitor such plan’s progress and results during the year;
•discuss with our independent registered public accounting firm their independence from management;
•to elect, retain, compensate, oversee, and, if necessary, terminate, any independent registered public accounting firm engaged for the purpose of preparing or issuing an audit report or performing other audit, review, or attest services for the Company;
•to review and discuss the annual audited financial statements and quarterly financial statements, the form of audit opinion to be issued by the auditors, and the Company’s disclosures;
•oversee the financial reporting process and discussing with management and our independent registered public accounting firm the interim and annual financial statements that we file with the SEC;
•review and monitor our accounting principles, accounting policies, financial and accounting controls and compliance with legal and regulatory requirements; and
•establish procedures for (i) the receipt, retention, and treatment of complaints received by the Corporation regarding accounting, internal accounting controls, or auditing matters and (ii) the confidential, anonymous submission by employees of concerns regarding questionable accounting or auditing matters.
Compensation Committee
Our compensation committee consists of Timothy M. Donahue, Cheemin Bo-Linn, Robert P. MacInnis and Michael K. Palmer, with Mr. Donahue serving as the chair of the committee. All of the committee members are non-employee directors, as defined in Rule 16b-3 promulgated under the Exchange Act. Our board of directors has determined that at the time of listing Mr. Donahue, Dr. Bo-Linn and Mr. MacInnis are “independent” as defined under the applicable NYSE listing standards, including the standards specific to members of a compensation committee. At the time of listing, the compensation committee needs at least one independent director. However, within 90 days of listing, the compensation committee shall be comprised by a majority of independent directors and at the one year anniversary of listing the compensation committee will need to be comprised of all independent directors. In such regard, the board will appoint new members to meet the independence criteria to comply with the listing requirements.
Our Compensation Committee’s responsibilities include:
•to review at least annually the goals and objectives of the Company’s executive compensation plans, and modify these goals and objectives if the Committee deems it appropriate;
•to evaluate annually the performance of the Chief Executive Officer in light of the goals and objectives of the Corporation’s executive compensation plans;
•to evaluate at least annually the performance of the other executive officers of the Company in light of the goals and objectives of the Company’s executive compensation plan;
•to review and recommend to the Board the adoption of or changes to the compensation of the Corporation’s independent directors; and
•to review and approve all perquisites, special cash payments and other special compensation and benefit arrangements or other personal benefits to the Company’s executive officers and directors and recommend any changes to the Board with respect to directors.
We believe that the composition and functioning of our compensation committee meets the requirements for independence under the current NYSE listing standards.
Nominating and Corporate Governance Committee
Our Nominating and Corporate Governance Committee’s responsibilities include:
•identifying individuals qualified to become members of the Board and ensure that the Board has the requisite expertise and that its membership consists of persons with sufficiently diverse and independent backgrounds;
•developing and recommending to the Board for approval standards for determining whether a director is independent;
•developing the criteria to be used by the Committee in recommending directors to the Board;
•overseeing the periodic self-evaluations of the Board and its committees;
•overseeing engagement with stockholders and proxy advisory firms; and
•reviewing and discussing with management disclosure of the Company’s corporate governance practices, including information regarding the operations of the Board committees, director independence and the director nominations process, and to recommend that this disclosure be included in the Company’s proxy statement or annual report on Form 10-K.
The members of the Nominating and Corporate Governance Committee are Robert P. MacInnis, H. Paulett Eberhart, Mark Neporent and Tomer Yosef-Or, each of whom qualifies as an independent director according to the
rules and regulations of the SEC and NYSE with respect to nominating and governance committee membership. Mr. MacInnis serves as the Chair of the committee.
Code of Ethics
We have a code of ethics that applies to all of our executive officers, directors and employees, including our principal executive officer, principal financial officer, principal accounting officer or controller or persons performing similar functions. The code of ethics is available on our website at ir.korewireless.com/corporate-governance/governance-documents. We intend to make any legally required disclosures regarding amendments to, or waivers of, provisions of our code of ethics on our website rather than by filing a current report on Form 8-K.
Anti-Hedging Policy
Our Board has adopted an Insider Trading Policy, which applies to all of our directors, officers and employees. The policy prohibits our directors, officers and employees and any entities they control from purchasing financial instruments such as prepaid variable forward contracts, equity swaps, collars, and exchange funds, or otherwise engaging in transactions that hedge or offset, or are designed to hedge or offset, any decrease in the market value of the Company’s equity securities, or that may cause an officer, director, or employee to no longer have the same objectives as our other stockholders.
Corporate Governance Guidelines
We have corporate governance guidelines in accordance with the corporate governance rules of the NYSE that serve as a flexible framework within which our board of directors and its committees operate. These guidelines cover a number of areas including board membership criteria and director qualifications, director responsibilities, board agenda, roles of the chairman of the board, chief executive officer and presiding director, meetings of independent directors, committee responsibilities and assignments, board member access to management and independent advisors, director communications with third parties, director compensation, director orientation and continuing education, evaluation of senior management and management succession planning. The corporate governance guidelines are available on our website at ir.korewireless.com/corporate-governance/governance-documents.
Compensation Committee Interlocks and Insider Participation
None of the current or past members of our Compensation Committee is or has been an officer or employee of the Company. None of our executive officers currently serves, or in the past year has served, as a member of the Compensation Committee (or other board committee performing equivalent functions or, in the absence of any such committee, the entire board) or director of any entity that has one or more executive officers serving on our Compensation Committee or the Board.
EXECUTIVE AND DIRECTOR COMPENSATION
We are currently considered an “emerging growth company”, as defined in the Jumpstart Our Business Startups Act of 2012, or the JOBS Act, for purposes of the SEC’s executive compensation disclosure rules. In accordance with such rules, we are required to provide a Summary Compensation Table and an Outstanding Equity Awards at Fiscal Year End Table, as well as limited narrative disclosures.
This section discusses the material components of the executive compensation program for our “named executive officers”. For the fiscal year ended December 31, 2022, our named executive officers and their positions with us were as follows:
Romil Bahl, President and Chief Executive Officer;
Bryan Lubel, Executive Vice President, Connected Health; and
Tushar Sachdev, Executive Vice President and Chief Technology Officer.
2022 Summary Compensation Table
The following table sets forth information concerning the compensation of the named executive officers for the fiscal years ended December 31, 2022 and December 31, 2021:
| | | | | | | | | | | | | | | | | | | | | | | | | | | | | | | | | | | | | | | | | | | | |
| Name and Principal Position | | Year | | Salary ($) | | Bonus ($)(1) | | Stock Awards ($)(2) | | Non-Equity Incentive Plan Compensation ($) | | All Other Compensation ($)(3) | | Total ($) |
Romil Bahl | | 2022 | | 750,000 | | | 281,250 | | | 14,344,674 | | | — | | | 16,366 | | | 15,392,290 | |
President and Chief Executive Officer | | 2021 | | 750,000 | | | — | | | 2,000,000 | | | 978,750 | | | 2,015,538 | | | 5,744,288 | |
Bryan Lubel | | 2022 | | 330,000 | | | — | | | 1,963,372 | | | — | | | 17,450 | | | 2,310,822 | |
Executive Vice President, Connected Health | | 2021 | | 330,000 | | | — | | | 375,000 | | | 430,650 | | | 389,808 | | | 1,525,458 | |
Tushar Sachdev | | 2022 | | 300,000 | | | 112,500 | | | 1,963,372 | | | — | | | 7,082 | | | 2,382,954 | |
Executive Vice President and Chief Technology Officer | | 2021 | | 300,000 | | | — | | | 375,000 | | | 391,500 | | | 388,588 | | | 1,455,088 | |
__________________
(1)The amounts reported in this column represent discretionary cash bonuses awarded to Messrs. Bahl and Sachdev in respect of their service with the Company during fiscal year 2022, as further described in the section below titled “Narrative to 2022 Summary Compensation Table —Annual Cash Bonuses.”
(2)The amounts reported in this column represent the aggregate grant date fair value, computed in accordance with FASB ASC Topic 718, of the stock awards that were granted to each of our named executive officers under the Incentive Plan (as defined below) in fiscal year 2022. The amounts reported in this column in respect of the performance stock awards granted in fiscal year 2022 reflect the Company’s determination of the probable outcome of the performance-vesting conditions. Assuming maximum performance for the stock awards that are subject to performance conditions, the grant date fair value included in this column would increase for Messrs. Bahl, Lubel and Sachdev to approximately $15,739,000, $2,209,000 and $2,209,000, respectively. Please see the section below titled “Narrative to 2022 Summary Compensation Table – Long-Term Equity Compensation” and the “Outstanding Equity Awards at 2022 Fiscal Year-End” table below for further details on these grants.
(3)The amounts reported in this column represent, for fiscal year 2022, the following: (a) the aggregate matching contributions to the KORE 401(k) Retirement Savings Plan made by the Company that vested in fiscal year 2022 for Mr. Bahl ($9,150) and Mr. Lubel ($9,150); (b) health insurance and other welfare benefit premiums paid by the Company in fiscal year 2022 on behalf of Mr. Bahl ($7,216) and Mr. Sachdev ($7,082); (c) the contribution made by the Company in fiscal year 2022 to the health savings account for Mr. Lubel ($8,300).
Narrative to 2022 Summary Compensation Table
Base Salaries
In fiscal year 2022, the named executive officers received an annual base salary to compensate them for services rendered to the Company. The base salary payable to each named executive officer is intended to provide a fixed
component of compensation reflecting the executive’s skill set, experience, role and responsibilities. The annual base salaries for Messrs. Bahl, Lubel and Sachdev for fiscal year 2022 were $750,000, $330,000 and $300,000, respectively, and the actual base salaries earned by our named executive officers for fiscal year 2022 are set forth above in the “2022 Summary Compensation Table.”
Annual Cash Bonuses
We incentivize our named executive officers with performance-based annual cash bonuses that are intended to reward the achievement of corporate performance objectives, which for fiscal year 2022 included Company revenue and adjusted EBITDA objectives established by our Compensation Committee in February 2022. The target percentage amounts for the annual cash bonuses for each of our named executive officers are set forth in the applicable executive’s employment agreement. Messrs. Bahl, Lubel and Sachdev were each eligible to receive annual target cash bonuses of up to 75% of their 2022 base salaries.
Based on the Company’s fiscal year 2022 performance, the corporate performance objectives described above were not achieved, and therefore our named executive officers did not receive a performance-based annual cash bonus in respect of fiscal year 2022. However, our Compensation Committee decided to award discretionary cash bonuses to Messrs. Bahl and Sachdev to compensate them for their overall performance and efforts on behalf of the Company during fiscal year 2022, with the amounts of such discretionary bonuses set forth above in the “2022 Summary Compensation Table” in the column entitled “Bonus.”
Long-Term Equity Compensation
In connection with the Business Combination, Maple Holdings Inc. entered into an option cancellation agreement with each of the named executive officers under which each named executive officer agreed to forfeit all vested and unvested stock options granted under our 2014 equity incentive plan in return for cash and shares of our common stock, effective as of consummation of the Business Combination.
Equity Incentive Plan
In connection with the Business Combination, our Board adopted, and our stockholders approved, the KORE Group Holdings, Inc. 2021 Long-Term Stock Incentive Plan, as it may be amended from time to time (the “Incentive Plan”) in order to facilitate the grant of cash and equity incentives to directors, employees (including our named executive officers), consultants and other service providers of our Company and certain of our affiliates, and to enable us to obtain and retain services of these individuals, which is essential to our long-term success.
We did not grant any equity awards to the named executive officers under the Incentive Plan in fiscal year 2021.
Equity Grants in 2022
We granted restricted stock units (“RSUs”) to our named executive officers under the Incentive Plan on January 4, 2022, the date that the underlying shares of our common stock were registered under the Securities Act pursuant to an S-8 filing. These grants of RSUs included the IPO RSUs, the Tranche I RSUs, the Tranche II RSUs, and for Mr. Bahl, the Stock Price RSUs, each as defined and described below.
Each of our named executive officers received a grant of RSUs on January 4, 2022 under the Incentive Plan that vest as follows (the “IPO RSUs”): (i) 25% vests on the second anniversary of September 30, 2021, (ii) 25% vests on the third anniversary of September 30, 2021, and (iii) 50% vests on the fourth anniversary of September 30, 2021, in each case, subject to continued employment or service through each such vesting date.
Each of our named executive officers received a grant of RSUs on January 4, 2022 under the Incentive Plan that vest as follows (the “Tranche I RSUs”): (i) 50% of the Tranche I RSUs are subject to time-based vesting, and vest as to one-third on each of the first three anniversaries of the grant date, subject to continuous employment or service through each such vesting date, and (ii) 50% of the Tranche I RSUs are subject to time-based and performance-based vesting and (x) time-vest 50% at the end of the first calendar quarter of 2024 and 50% at the end of the first calendar quarter of 2025, subject to continuous employment or service through each such time-vesting date, and (y) performance-vest 50% based on Company revenue and 50% based on Company EBITDA, each as measured during
the three-year performance period commencing on January 1, 2021, subject to continued employment or service through the date the Board certifies the performance achievement.
Each of our named executive officers received a grant of RSUs on January 4, 2022 under the Incentive Plan that vest as follows (the “Tranche II RSUs”): (i) 50% of the Tranche II RSUs are subject to time-based vesting, and vest as to one-third on each of the first three anniversaries of the grant date, subject to continuous employment or service through each such vesting date, and (ii) 50% of the Tranche II RSUs are subject to performance-based vesting and 50% vests based on Company revenue and 50% vests based on Company EBITDA, each as measured during the three-year performance period commencing on January 1, 2022, subject to continued employment or service through the date the Board certifies the performance achievement.
Mr. Bahl was also granted RSUs on January 4, 2022 under the Incentive Plan that vest based on the attainment of a specified closing price of our common stock determined on a per share basis over any 20-trading days within any 30 consecutive trading day period (the “Stock Price RSUs”). Upon our common stock attaining a closing price equal to or greater than (i) $13 per share, 26,538 RSUs will vest, (ii) $15 per share, 89,667 RSUs will vest, and (iii) $18 per share, 55,556 RSUs will vest, in each case, subject to Mr. Bahl’s continued employment or service through each such vesting date.
In addition, on June 30, 2022, Mr. Bahl received the following three grants of RSUs under the Incentive Plan, which vest as follows: (i) one grant of RSUs vests 100% on June 30, 2025, subject to continuous employment or service through such vesting date, (ii) one grant of RSUs vests 100%, if at all, on the earlier of (x) the date our Compensation Committee certifies that the Company’s revenue for fiscal year 2023 was equal to at least $315 million and (y) the date our Compensation Committee certifies that the Company’s revenue for fiscal year 2024 was equal to at least 115% of the Company’s revenue for fiscal year 2023 and the Company’s revenue for fiscal year 2023 was equal to at least $300 million, subject to continued employment or service through the applicable vesting date, and (iii) one grant of RSUs vests 100%, if at all, on the date our Compensation Committee certifies that the Company’s revenue for fiscal year 2024 was equal to at least 115% of Company revenue for fiscal year 2023, subject to continued employment or service through such vesting date.
Other Elements of Compensation
Retirement Plans
In fiscal year 2022, the named executive officers participated in a 401(k) retirement savings plan maintained by KORE. The Code allows eligible employees to defer a portion of their compensation, within prescribed limits, on a pre-tax basis through contributions to the 401(k) plan. In fiscal year 2022, contributions made by participants in the Company’s 401(k) plan were matched up to a specified percentage of the employee contributions on behalf of the named executive officers. These matching contributions are generally unvested as of the date on which the contribution is made, and vest 25% over a four-year period, subject to continued service. Our named executive officers will continue to participate in the Company’s 401(k) plan on the same terms as other full-time employees.
Employee Benefits and Perquisites
Health/Welfare Plans
In fiscal year 2022, the named executive officers participated in health and welfare plans maintained by KORE, including:
•medical, dental and vision benefits for which the Company pays the full amount of the premiums on behalf of our named executive officers;
•medical and dependent care flexible spending accounts;
•short-term and long-term disability insurance and accidental death and dismemberment insurance;
•life insurance; and
•vacation and paid holidays.
No Tax Gross-Ups
In fiscal year 2022, KORE did not make gross-up payments to cover the named executive officers’ personal income taxes that may pertain to any of the compensation or perquisites paid or provided by KORE.
Employment Agreements
Romil Bahl Employment Agreement
On September 22, 2017, Mr. Bahl entered into an employment agreement with KORE Wireless to serve as Chief Executive Officer, which was subsequently amended and restated on November 17, 2021. Mr. Bahl’s employment agreement provides for an initial five-year term subject to automatic one-year renewal terms thereafter, unless either the Company or Mr. Bahl provides 30 days’ advance written notice of its or his intent not to renew the term.
Pursuant to his employment agreement, Mr. Bahl is entitled to an annual base salary of $750,000, which will be reviewed annually by our Board solely for upward adjustment at the Board’s discretion. The employment agreement also provides that Mr. Bahl is eligible to earn an annual bonus, with a target bonus opportunity of 75% of his base salary.
Pursuant to the terms of his employment agreement, Mr. Bahl is entitled to receive severance payments and benefits in certain limited circumstances. Such severance payments and benefits are described in more detail below in the section titled “Potential Payments Upon Termination or Change in Control”.
Bryan Lubel and Tushar Sachdev Employment Agreements
On November 22, 2019, Mr. Lubel entered into an employment agreement with KORE Wireless to serve as Executive Vice President, Healthcare IoT Solutions & Managed Services, which was subsequently amended and restated on March 15, 2022 (which, among other things, provided for a title of Executive Vice President of Connected Health).
On February 19, 2018, Mr. Sachdev entered into an employment agreement with KORE Wireless to serve as Executive Vice President and Chief Technology Officer, which was subsequently amended and restated on March 15, 2022.
Each of Messrs. Lubel’s and Sachdev’s employment agreements provide for an initial five-year term subject to automatic one-year renewal terms thereafter, unless either the Company or the applicable executive provides 30 days’ advance written notice of its or his intent not to renew the term.
Pursuant to their respective employment agreement, each executive is entitled to the following salaries: for Mr. Lubel, $330,000, and for Mr. Sachdev, $300,000. Each executive’s salary will be reviewed annually by our Board solely for upward adjustment at the Board’s discretion. Each of Messrs. Lubel’s and Sachdev’s employment agreements also provide that each such executive is eligible to earn an annual bonus, with a target bonus opportunity of 75% of his base salary.
Pursuant to the terms of their respective employment agreement, each of Messrs. Lubel and Sachdev are entitled to receive severance payments and benefits in certain limited circumstances. Such severance payments and benefits are described in more detail below in the section titled “Potential Payments Upon Termination or Change in Control.”
Outstanding Equity Awards at 2022 Fiscal Year-End
The following table reflects information regarding outstanding equity-based awards held by our named executive officers as of December 31, 2022.
| | | | | | | | | | | | | | | | | | | | | | | | | | | | | | | | | | | | | | |
| | Stock awards |
| Name | | Grant date | | Number of shares or units of stock that have not vested (#) | | Market value of shares or units of stock that have not vested ($)(1) | | Equity incentive plan awards: number of unearned shares, units or other rights that have not vested (#) | | Equity incentive plan awards: market value of unearned shares, units or other rights that have not vested ($)(1) |
Romil Bahl | | 1/4/2022 | | 800,000 | | (2) | | 1,008,000 | | | | | | |
| | 1/4/2022 | | 200,000 | | (3) | | 252,000 | | | | | | |
| | 1/4/2022 | | | | | | | 200,000 | | (4) | | 252,000 | |
| | 1/4/2022 | | 200,000 | | (5) | | 252,000 | | | | | | |
| | 1/4/2022 | | | | | | | 200,000 | | (6) | | 252,000 | |
| | 1/4/2022 | | | | | | | 171,761 | | (7) | | 216,419 | |
| | 6/30/2022 | | 216,666 | | (8) | | 272,999 | | | | | | |
| | 6/30/2022 | | | | | | | 216,667 | | (9) | | 273,000 | |
| | 6/30/2022 | | | | | | | 216,667 | | (10) | | 273,000 | |
Bryan Lubel | | 1/4/2022 | | 140,845 | | (2) | | 177,465 | | | | | | |
| | 1/4/2022 | | 35,211 | | (3) | | 44,366 | | | | | | |
| | 1/4/2022 | | | | | | | 35,211 | | (4) | | 44,366 | |
| | 1/4/2022 | | 35,211 | | (5) | | 44,366 | | | | | | |
| | 1/4/2022 | | | | | | | 35,211 | | (6) | | 44,366 | |
Tushar Sachdev | | 1/4/2022 | | 140,845 | | (2) | | 177,465 | | | | | | |
| | 1/4/2022 | | 35,211 | | (3) | | 44,366 | | | | | | |
| | 1/4/2022 | | | | | | | 35,211 | | (4) | | 44,366 | |
| | 1/4/2022 | | 35,211 | | (5) | | 44,366 | | | | | | |
| | 1/4/2022 | | | | | | | 35,211 | | (6) | | 44,366 | |
__________________
(1)Calculated based on the closing price for our common stock on December 30, 2022, which was $1.26.
(2)Represents the IPO RSUs granted to our named executive officers, each of which vests as follows: (i) 25% vests on the second anniversary of September 30, 2021, (ii) 25% vests on the third anniversary of September 30, 2021, and (iii) 50% vests on the fourth anniversary of September 30, 2021, in each case, subject to continued employment or service through each such vesting date.
(3)Represents 50% of the Tranche I RSUs granted to our named executive officers, each of which vests as to one-third on each of the first three anniversaries of the grant date, subject to continuous employment or service through each such vesting date.
(4)Represents 50% of the Tranche I RSUs granted to our named executive officers, each of which (i) time-vests 50% at the end of the first calendar quarter of 2024 and 50% at the end of the first calendar quarter of 2025, subject to continuous employment or service through each such time-vesting date, and (ii) performance-vests 50% based on Company revenue and 50% based on Company EBITDA, each as measured during the three-year performance period commencing on January 1, 2021, subject to continued employment or service through the date the Board certifies the performance achievement. The values of these awards reported in this table are based on achieving target performance goals.
(5)Represents 50% of the Tranche II RSUs granted to our named executive officers, each of which vests as to one-third on each of the first three anniversaries of the grant date, subject to continuous employment or service through each such vesting date.
(6)Represents 50% of the Tranche II RSUs granted to our named executive officers, each of which vests based on Company EBITDA, each as measured during the three-year performance period commencing on January 1, 2022, subject to continued employment or service through the date the Board certifies the performance achievement. The values of these awards reported in this table are based on achieving target performance goals.
(7)Represents the Stock Price RSUs granted to Mr. Bahl, which vests based on the attainment of a specified closing price of our common stock determined on a per share basis over any 20-trading days within any 30 consecutive trading day period. Upon our common stock attaining a
closing price equal to or greater than (i) $13 per share, 26,538 RSUs will vest, (ii) $15 per share, 89,667 RSUs will vest, and (iii) $18 per share, 55,556 RSUs will vest, in each case, subject to Mr. Bahl’s continued employment or service through each such vesting date.
(8)Represents a grant of RSUs to Mr. Bahl which vests 100% on June 30, 2025, subject to Mr. Bahl’s continued employment or service through such vesting date.
(9)Represents a grant of RSUs to Mr. Bahl which vests 100%, if at all, on the earlier of (i) the date our Compensation Committee certifies that the Company’s revenue for fiscal year 2023 was equal to at least $315 million and (ii) the date our Compensation Committee certifies that the Company’s revenue for fiscal year 2024 was equal to at least 115% of the Company’s revenue for fiscal year 2023 and the Company’s revenue for fiscal year 2023 was equal to at least $300 million, subject to Mr. Bahl’s continuous employment or service through the applicable vesting date.
(10)Represents a grant of RSUs to Mr. Bahl which vests 100%, if at all, on the date our Compensation Committee certifies that the Company’s revenue for fiscal year 2024 was equal to at least 115% of Company revenue for fiscal year 2023, subject to Mr. Bahl’s continuous employment or service through such vesting date.
Potential Payments Upon Termination or Change in Control
Mr. Bahl is entitled to receive severance payments and benefits upon a qualifying termination of his employment by the Company “without cause” (as defined in the employment agreement and which includes a termination due to non-extension of the employment term by the Company) or by Mr. Bahl for “good reason” (as defined in the employment agreement) consisting of the following, in addition to accrued benefits:
•any annual bonus earned but unpaid with respect to the Company’s fiscal year ending on or preceding the date of termination;
•payment of base salary in effect immediately preceding the date of termination (or, if greater, Mr. Bahl’s base salary in effect immediately preceding a material reduction in Mr. Bahl’s then current base salary, for which Mr. Bahl has terminated his employment for good reason) equal to the greater of (i) 18 months or (ii) the sum of four weeks for each full year of continuous service with the Company, payable in accordance with the established payroll practices of the Company;
•a prorated annual bonus for the fiscal year in which the termination occurs, calculated based on actual achievement and paid at the same time annual bonuses are generally paid to other executives for the relevant year;
•continuation of any health care (medical, dental and vision) plan coverage provided to Mr. Bahl and his dependents during the severance period (or cash payments in lieu of such benefits if such continuation is not feasible under the terms of the plan or program pursuant to which coverage is provided or the Company reasonably determines that such continuation would adversely affect the tax status of such plan or program); provided that such continued coverage will terminate in the event Mr. Bahl becomes eligible for coverage under another employer’s plans;
•(i) all unvested equity or equity-based awards in the Company or its affiliates that vest solely based on passage of time will automatically vest, (ii) all unvested equity or equity-based awards in the Company or its affiliates that vest based on achievement of EBITDA and/or revenue criteria will remain outstanding and eligible to vest based on the Company’s achievement of such performance criteria as if Mr. Bahl’s employment had not terminated and (iii) if not already vested as of the date of termination, the awards of 26,538 restricted stock units and 23,000 restricted stock units that vest upon the Company’s common stock attaining a closing price, on a per share basis, equal to or greater than $13 per share and $15 per share, respectively, and in each case, over any 20-trading days within any 30 consecutive training day period, will remain outstanding and vest upon the Company attaining such closing prices, as if Mr. Bahl’s employment had not terminated; and
•payment of one year of outplacement services from an outplacement service provider of Mr. Bahl’s choice, limited to $20,000 in total.
In the event such qualifying termination occurs within the 24 months preceding a “change in control” (as defined in the employment agreement), Mr. Bahl is entitled to the severance payments and benefits described above, except that the severance period will be extended to the greater of (i) 24 months and (ii) the sum of four weeks for each full year of continuous service with the Company.
If Mr. Bahl’s employment terminates by reason of his death or “disability” (as defined in the employment agreement), in addition to any accrued benefits, Mr. Bahl is entitled to receive payment of any prior year annual bonus, the prorated annual bonus described above, and the equity vesting treatment described above, as well as any benefits to which he is entitled by law (at Mr. Bahl’s sole expense) pursuant to COBRA.
Any severance benefits or payments payable to Mr. Bahl pursuant to his employment agreement are subject to his execution of a release of claims and continued compliance with the applicable restrictive covenants. Pursuant to his employment agreement, while employed by the Company (or any subsidiary or affiliate of the Company) and during the 24-month period following termination, Mr. Bahl is subject to non-competition and non-solicitation of customers and employees covenants, as well as perpetual confidentiality.
Each of Messrs. Lubel and Sachdev is entitled to receive severance payments and benefits upon a qualifying termination of the applicable executive’s employment by the Company “without cause” (as defined in the applicable employment agreement and which includes a termination due to non-extension of the employment term by the Company) or by the applicable executive for “good reason” (as defined in the Employment Agreements) consisting of the following, in addition to accrued benefits:
•any annual bonus earned but unpaid with respect to the Company’s fiscal year ending on or preceding the date of termination;
•payment of base salary in effect immediately preceding the date of termination (or, if greater, such executive’s base salary in effect immediately preceding a material reduction in such executive’s then current base salary, for which such executive has terminated his employment for good reason) equal to 12 months, payable in accordance with the established payroll practices of the Company;
•a prorated annual bonus for the fiscal year in which the termination occurs, calculated based on actual achievement and paid at the same time annual bonuses are generally paid to other executives for the relevant year;
•continuation of any health care (medical, dental and vision) plan coverage provided to such executive and his dependents during the severance period (or cash payments in lieu of such benefits if such continuation is not feasible under the terms of the plan or program pursuant to which coverage is provided or the Company reasonably determines that such continuation would adversely affect the tax status of such plan or program); provided that such continued coverage (or payments, as applicable) will terminate in the event such executive becomes eligible for coverage under another employer’s plans; and
•all unvested equity or equity-based awards in the Company or its affiliates that vest solely based on passage of time will automatically vest.
If the applicable executive’s employment terminates by reason of his death or “disability” (as defined in the applicable employment agreements), in addition to any accrued benefits, such executive (or such executive’s estate, as applicable) is entitled to receive payment of any prior year annual bonus and the prorated annual bonus described above, as well as any benefits to which he is entitled by law (at such executive’s sole expense) pursuant to COBRA.
Any severance benefits or payments payable pursuant to the applicable executive under his respective employment agreement are subject to his execution of a release of claims. Pursuant to the applicable employment agreement, while employed by the Company (or any subsidiary or affiliate of the Company) and during the 24-month period following termination, each of Messrs. Lubel and Sachdev is subject to non-competition and non-solicitation of customers and employees covenants, as well as perpetual confidentiality.
Director Compensation
The Company maintains a director compensation policy for its non-employee directors (the “Director Compensation Policy”) that is designed to provide competitive compensation necessary to attract and retain high quality non-employee directors. The Director Compensation Policy provides for the following:
•An annual cash retainer of $40,000 for each non-employee director;
•An annual cash retainer of $50,000 for the non-employee director serving as the non-executive chair of the Board, if any;
•An annual cash retainer of $15,000 for the non-employee director serving as the lead independent director of the Board, if any;
•An annual cash retainer of $10,000 for each non-employee director serving on the Audit Committee, the Compensation Committee or the Nomination and Corporate Governance Committee (effective as of April 2022);
•An annual cash retainer of $20,000 for each non-employee director chairing the Audit Committee, the Compensation Committee or the Nominating and Corporate Governance Committee;
•An annual RSU award with a grant date fair value of $150,000 granted as of the date of the annual meeting of stockholders of the Company, with each such award vesting upon the earlier of one year following the grant date or the date of the immediately subsequent annual meeting of stockholders of the Company, subject to continued service through such vesting date; and
•An initial RSU award granted to a newly appointed or elected non-employee director, with a grant date fair value of $150,000, granted as of the date on which such director is appointed or elected to serve on the Board, with such award vesting in equal annual installments on each of the first three anniversaries of the grant date, subject to continued service through each such vesting date.
Each annual retainer described above is paid quarterly and is subject to pro-ration for partial quarters served. The RSU awards described above are subject to accelerated vesting in the event of a change of control of the Company if the grantee is not retained as a director following such change of control.
In addition, each non-employee director serving on the Board as of the date of the Closing was entitled to receive (i) 15,000 RSUs, each of which vests in equal annual installments on each of the first three anniversaries of the Closing, subject to continued service through each such vesting date, and (ii) 21,126 RSUs, each of which vested in full on the one-year anniversary of the Closing.
The following table presents information regarding compensation earned by our non-employee directors for their Board service during the year ended December 31, 2022.
__________________
(1)The amounts reported in this column represent the aggregate grant date fair value, computed in accordance with FASB ASC Topic 718, of stock awards granted to certain of our non-employee directors. As of December 31, 2022, certain of our non-employee directors held outstanding awards of RSUs in the following amounts: Mr. Donahue and Dr. Bo-Linn, each 51,436, and Ms. Eberhart and Mr. Geisler, each 68,560.
(2)Ms. Eberhart was appointed to the Board effective as of February 16, 2022.
(3)Mr. Geisler was appointed to the Board effective as of February 16, 2022.
(4)Mr. Galbato resigned from the Board effective as of February 16, 2022.
(5)Each of Messrs. Galbato, MacInnis, Palmer, Neporent and Yosef-Or declined to receive compensation in respect of their service on our Board during fiscal year 2022.
(6)Mr. Neporent was appointed to the Board effective as of February 16, 2022.
PRINCIPAL STOCKHOLDERS
The following table sets forth information regarding the beneficial ownership of our voting shares by:
•each person who is known to be the beneficial owner of more than 5% of our voting shares;
•each of our executive officers and directors; and
•all of our executive officers and directors as a group.
Beneficial ownership is determined according to the rules of the SEC, which generally provide that a person has beneficial ownership of a security if he, she or it possesses sole or shared voting or investment power over that security, including options and warrants that are currently exercisable or exercisable within 60 days. A person is also deemed to be a beneficial owner of any securities of which that person has a right to acquire beneficial ownership within 60 days, provided that any person who acquires any such right with the purpose or effect of changing or influencing the control of the issuer, or in connection with or as a participant in any transaction having such purpose or effect, immediately upon such acquisition shall be deemed to be the beneficial owner of the securities which may be acquired through the exercise of such right. Under these rules, more than one person may be deemed to be a beneficial owner of the same securities.
Percentage ownership of our voting securities is based on 86,538,821 shares of our common stock issued and outstanding as of June 6, 2023.
Unless otherwise indicated, we believe that all persons named in the table below have sole voting and investment power with respect to the voting securities beneficially owned by them.
| | | | | | | | | | | | | | |
Name and Address of Beneficial Owner | | Number of KORE Shares | | % |
Entities affiliated with ABRY Partners LLC(1)(2) | | 24,252,912 | | | 28.0 | % |
Wood River Capital, LLC(3) | | 10,000,000 | | | 11.6 | % |
Twilio | | 10,000,000 | | | 11.6 | % |
Fortress Investment Group LLC(4)(5) | | 8,343,954 | | | 9.6 | % |
CTAC Sponsor(6) | | 6,970,342 | | | 8.1 | % |
Terrdian CCPC(7) | | 4,983,527 | | | 5.8 | % |
Dotmar Investments Limited(8) | | 4,018,575 | | | 4.6 | % |
Directors and Executive Officers | | | | |
Romil Bahl | | 330,004 | | | * |
Paul Holtz | | 19,736 | | | * |
Tushar Sachdev | | 48,236 | | | * |
Bryan Lubel | | 31,817 | | | * |
Cheemin Bo-Linn | | 67,562 | | | * |
Timothy M. Donahue | | 67,562 | | | * |
H. Paulett Eberhart | | 50,477 | | | * |
James Geisler | | 50,477 | | | * |
Robert P. MacInnis | | 104,500 | | | * |
Tomer Yosef-Or | | 50,263 | | | * |
Michael K. Palmer | | — | | | * |
Mark Neporent | | — | | | * |
All current KORE directors and executive officers as a group (15 individuals) | | 637,494 | | | * |
__________________
*Less than one percent
(1)21,500,782 of the shares reported herein are owned directly by ABRY Partners VII, L.P. 1,240,202 of the shares reported herein are owned directly by ABRY Partners VII Co-Investment Fund, L.P. 24,316 of the shares reported herein are owned directly by ABRY Investment Partnership, L.P. 1,288,506 of the shares reported herein are owned directly by ABRY Senior Equity IV, L.P. and 199,106 of the shares reported herein are owned directly by ABRY Senior Equity Co-Investment Fund IV, L.P.P.
(2)ABRY Partners VII, L.P., ABRY Partners VII Co-Investment Fund, L.P., ABRY Investment Partnership, L.P., ABRY Senior Equity IV, L.P. and ABRY Senior Equity Co-Investment Fund IV, L.P. (collectively the “ABRY Funds”) are managed and/or controlled by ABRY Partners, LLC (“ABRY I”) and ABRY Partners II, LLC (“ABRY II”) and/or their respective affiliates. ABRY I and ABRY II are investment advisors registered with the SEC. Royce Yudkoff, as managing member of ABRY I and sole member of certain of its affiliates, has the right to exercise investment and voting power on behalf of ABRY Investment Partnership, L.P. Peggy Koenig and Jay Grossman, as equal members of ABRY II and of certain of its affiliates, have the right to exercise investment and voting power on behalf of the ABRY Funds. Each of the Messrs. Yudkoff, Messrs. Grossman and Mses. Koenig disclaims any beneficial ownership of the securities held by the ABRY Funds other than to the extent of any pecuniary interest he may have therein, directly or indirectly. The business address of ABRY is 888 Boylston Street, Suite 1600, Boston, Massachusetts.
(3)Wood River Capital, LLC (“Wood River”) is beneficially owned by SCC Holdings, LLC (“SCC”), SCC is beneficially owned by KIM, LLC (“KIM”), KIM is beneficially owned by Koch Investments Group, LLC (“KIG”), KIG is beneficially owned by Koch Investments Group Holdings, LLC (“KIGH”), and KIGH is beneficially owned by Koch Industries, Inc. (“Koch Industries”), in each case by means of ownership of all voting equity instruments. Koch Industries, SCC, KIM, KIG, and KIGH may be deemed to beneficially own the shares held by Wood River by virtue of (i) Koch Industries’ beneficial ownership of KIGH, (ii) KIGH’s beneficial ownership of KIG, (iii) KIG’s beneficial ownership of KIM, (iv) KIM’s beneficial ownership of SCC and (v) SCC’s beneficial ownership of Wood River but each of them disclaims beneficial ownership thereof. The business address of each of the foregoing entities and persons is 4111 E. 37th Street North, Wichita, KS 67220.
(4)The shares reported herein consist of shares of common stock held of record by Drawbridge Special Opportunities Fund LP (“DBSO”), Fortress Lending II Holdings LP (“FL II LP”) and Drawbridge Special Opportunities Advisors LLC (“DBSO Advisors”). DBSO Advisors is the investment adviser to certain investment funds, including DBSO. Drawbridge Special Opportunities GP LLC (“DBSO GP”), a Delaware limited liability company, is the general partner of DBSO. Fortress Principal Investment Holdings IV LLC, a Delaware limited liability company (“FPI IV”), is the managing member of DBSO GP. DBSO TRG Fund (A) Advisors LLC (“TRG Advisors”), is the investment manager of TRG, and TRG’s general partner is DBSO TRG Fund (A) GP LLC (“TRG GP”). Fortress Vintage Securities Fund Advisors LLC (“Vintage Advisors”), is the investment manager of Vintage and Fortress Vintage Securities Fund GP LLC (“Vintage GP”) is the general partner of Vintage. FLA Advisors II, a Delaware limited liability company, is the investment adviser to FL II LP. FLF II MACRPTF Advisors LLC, a Delaware limited liability company (“FLF II Advisors”) is the investment manager of CRPTF. Fortress Principal Investment Holdings IV LLC, a Delaware limited liability company (“FPI IV”), is the managing member of DBSO GP. FIG LLC, a Delaware limited liability company, is the holder of all membership interests in investment advisers, including DBSO Advisors and FLA Advisors II. Hybrid GP Holdings LLC, a Delaware limited liability company (“Hybrid GP”), is the sole member of TRG GP and Vintage GP. Fortress Operating Entity I LP, a Delaware limited partnership (“FOE I”), is (i) the holder of all of the issued and outstanding membership interests of FIG LLC and (ii) the indirect parent of the general partners (including DBSO GP). FIG Corp., a Delaware Corporation (“FIG Corp”), is the general partner of FOE I. Fortress Investment Group LLC, a Delaware limited liability company (“Fortress”), is the holder of all of the issued and outstanding shares of FIG Corp. As the Co-Chief Investment Officers of DBSO Advisors, TRG Advisors and Vintage Advisors, each of Peter L. Briger, Jr., Dean Dakolias, Drew McKnight and Joshua Pack participate in the voting and investment decisions with respect to the shares held by DBSO, DBSO Ltd, TRG and Vintage, but each of them disclaims beneficial ownership thereof. As the Co-Chief Investment Officers of FLA Advisors II and FLF II Advisors, each of Andrew McKnight, Joshua Pack, Dominick Ruggiero and Aaron Blanchette participates in the voting and investment decisions with respect to the shares held by Lending Fund and CRPFT, but each of them disclaims beneficial ownership thereof. The business address of each of the foregoing entities and persons is 1345 Avenue of the Americas, 46th Floor, New York, NY 10105.
(5)Under the terms of the Exchangeable Notes, the holder thereof may not exercise the option to exchange the Exchangeable Notes for common stock to the extent such exercise would cause such holder, together with its attribution parties, to beneficially own a number of shares of common stock which would exceed 9.99% of our then outstanding common stock following such exercise (the “Blocker”), excluding for purposes of such determination shares of common stock issuable upon exercise of such Exchangeable Notes which have not been exercised. The table shows the number of shares of common stock that would be issuable upon the exercise in full of the Exchangeable Notes and does not give effect to the Blocker.
(6)Sponsor is the recordholder of the shares reported herein. The Sponsor is controlled by a board of managers comprised of Stephen A. Feinberg and Frank W. Bruno. Messrs. Feinberg and Bruno, as members of the board of managers of the Sponsor, have the sole right to exercise voting power with respect to the common stock held of record by the Sponsor, and have the sole right to consent to the transfer of such shares of common stock. The business address of the Sponsor is 875 Third Avenue, New York, New York 10022.
(7)Ontario 2833075 is the recordholder of the shares reported herein. Ontario 2833075 is a wholly-owned subsidiary of Terrdian CCPC. Terence Jarman, as President of Terrdian CCPC and Administrator of TDJ Company LLC, has the right to exercise investment and voting power on behalf of each of Terrdian CCPC and TDJ LLC. Mr. Jarman disclaims any beneficial ownership of the securities held by the TDJ Company LLC, other than to the extent of any pecuniary interest he may have therein, directly or indirectly. The business address of the foregoing persons is 10 High Point Rd, Toronto, Ontario M3B 2A4, Canada.
(8)The number of shares reported herein consists of 4,018,575 shares of common stock held of record by Dotmar Investments Limited and Richard Burston. Richard Burston, as Chairman of Dotmar Investments Limited, has the right to exercise investment and voting power on behalf of Dotmar Investments Limited. Richard Burston disclaims any beneficial ownership of the securities held by the Dotmar Investments Limited other than to the extent of any pecuniary interest he may have therein, directly or indirectly. The business address of Dotmar Investments Limited is First Floor, 7 Esplanade, St Helier, Jersey JE2 3QA Channel Islands.
SELLING SECURITYHOLDERS
We are registering the resale of common stock to permit each of the Selling Securityholders identified below to resell or otherwise dispose of the common stock in the manner contemplated under “Plan of Distribution” in this prospectus (as may be supplemented and amended). The Selling Securityholders may from time to time offer and sell any or all of the shares of common stock set forth below pursuant to this prospectus and any accompanying prospectus supplement. When we refer to the “Selling Securityholders” in this prospectus, we mean the persons listed in the table below, and the pledgees, donees, transferees, assignees, successors, designees and others who later come to hold any of the Selling Securityholders’ interest in the common stock other than through a public sale.
The following table is prepared based on information provided to us by the Selling Securityholders. The following table sets forth, as of the date of this prospectus, the names of the Selling Securityholders, and the aggregate number of shares of common stock that the Selling Securityholders may offer pursuant to this prospectus.
Except as set forth in the footnotes below, to our knowledge, the Selling Securityholders listed in the table below do not have, and during the three years prior to the date of this prospectus have not had, any position, office, or other material relationships with us or any of our affiliates other than as a stockholder, noteholder and warrantholder.
Please see the section titled “Plan of Distribution” in this prospectus for further information regarding the Selling Securityholder’s method of distributing these shares.
| | | | | | | | | | | | | | | | | | | | | | | | | | | | | |
| | | | | | | | | |
| | | Before Offering | | After Offering |
| Name | | Number of
Shares of
Common
Stock
Beneficially
Owned
Prior to the
Offering | | Number of
Shares of
Common
Stock
Offered
Hereby | | Number of Shares of Common Stock Beneficially Owned After this Offering(2) | | Percentage
of
Outstanding
Shares of
Common
Stock |
Drawbridge Special Opportunities Fund LP(3) | | 4,364,898 | | | 3,475,040 | | (1) | | 676,443 | | | * |
Drawbridge Special Opportunities Fund Ltd.(4) | | 1,089,487 | | | 621,680 | | (1) | | 352,474 | | | * |
DBSO TRG Fund (A) L.P.(5) | | 279,772 | | | 162,320 | | (1) | | 88,512 | | | * |
Fortress Vintage Securities Fund LP(6) | | 489,702 | | | 284,160 | | (1) | | 154,897 | | | * |
Fortress Lending Fund II Holdings LP(7) | | 4,623,665 | | | 4,576,000 | | (1) | | 47,665 | | | * |
Fortress Lending Fund II MA-CRPTF LP(8) | | 485,809 | | | 480,800 | | (1) | | 5,009 | | | * |
Cowen Investments II LLC(9) | | 186,326 | | | 186,326 | | | | — | | | * |
Total | | 11,519,659 | | | 9,786,326 | | | | 1,325,000 | | | 1.5% |
__________________
*Less than 1%
(1)Represents shares of common stock underlying Exchangeable Notes. Assumes for each $1,000 in principal amount of the Exchangeable Notes an exchange ratio, as of the date of this prospectus, of 80,000 ordinary shares (based on the initial exchange price of $12.50 per share) upon exchange and full physical settlement of the $120,000,000 in aggregate initial principal amount of Exchangeable Notes. The number of common stock issuable upon exchange is subject to adjustment upon the occurrence of certain events set forth in the indenture governing the Exchangeable Notes and described herein. The number of common stock registered pursuant to the registration statement of which this prospectus forms a part includes an indeterminate number of common stock that may be issued in connection with any share split, share dividend, dividend or other distribution, recapitalization or similar event or pursuant to the anti-dilution provisions set forth in the indenture governing the Exchangeable Notes in addition to such additional common stock potentially issuable in payment of interest on the Exchangeable Notes. However, additional common stock potentially issuable as a result of the foregoing or other adjustments to the exchange price are not included in the share amounts set forth in the table. Further, under the terms of the Exchangeable Notes, the holder thereof may not exercise the option to exchange the Exchangeable Notes for common stock to the extent such exercise would cause such holder, together with its attribution parties, to beneficially own a number of shares of common stock which would exceed 9.99% of our then outstanding common stock following such exercise (the “Blocker”), excluding for purposes of such determination shares of common stock issuable upon exercise of such Exchangeable Notes which have not been exercised. The table shows the number of shares of common stock that would be issuable upon the exercise in full of the Exchangeable Notes and does not give effect to the Blocker.
(2)Assumes the sale of all common stock registered pursuant to this prospectus, although the Selling Securityholders are under no obligation known to us to sell any common stock at this time.
(3)The number of shares reported herein consists of (i) 676,443 shares of common stock; (ii) 213,415 shares of common stock underlying warrants; and (iii) 3,475,040 shares of common stock underlying the Exchangeable Notes held by Drawbridge Special Opportunities Fund LP (“DBSO”). Drawbridge Special Opportunities Advisors LLC, a Delaware limited liability company (“DBSO Advisors”), is the investment manager of DBSO. As the Co-Chief Investment Officers of DBSO Advisors, each of Peter L. Briger, Jr., Dean Dakolias, Drew McKnight and Joshua Pack participates in the voting and investment decisions with respect to the shares held by DBSO, but each of them disclaims beneficial ownership thereof.. The business address of each of the foregoing entities and persons is 1345 Avenue of the Americas, 46th Floor, New York, NY 10105.
(4)The number of shares reported herein consists of (i) 352,474 shares of common stock; (ii) 115,333 shares of common stock underlying warrants; and (iii) 621,680 shares of common stock underlying the Exchangeable Notes held by Drawbridge Special Opportunities Fund Ltd. (“DBSO Ltd”). Drawbridge Special Opportunities Advisors LLC, a Delaware limited liability company (“DBSO Advisors”), is the investment manager of DBSO Ltd. As the Co-Chief Investment Officers of DBSO Advisors, each of Peter L. Briger, Jr., Dean Dakolias, Drew McKnight and Joshua Pack participates in the voting and investment decisions with respect to the shares held by DBSO Ltd, but each of them disclaims beneficial ownership thereof. The business address of each of the foregoing entities and persons is 1345 Avenue of the Americas, 46th Floor, New York, NY 10105.
(5)The number of shares reported herein consists of (i) 88,512 shares of common stock; (ii) 28,940 shares of common stock underlying warrants; and (iii) 162,320 shares of common stock underlying warrants; and (iii) 162,320 shares of common stock underlying the Exchangeable Notes held by DBSO TRG Fund (A) L.P. (“TRG”). DBSO TRG Fund (A) Advisors LLC (“TRG Advisors”), is the investment manager of TRG, and TRG’s general partner is DBSO TRG Fund (A) GP LLC (“TRG GP”). As the Co-Chief Investment Officers of TRG Advisors and TRG GP, each of Peter L. Briger, Jr., Dean Dakolias, Drew McKnight and Joshua Pack participates in the voting and investment decisions with respect to the shares held by TRG, but each of them disclaims beneficial ownership thereof. The business address of each of the foregoing entities and persons is 1345 Avenue of the Americas, 46th Floor, New York, NY 10105.
(6)The number of shares reported herein consists of (i) 154,897 shares of common stock; (ii) 50,645 shares of common stock underlying warrants; and (iii) 284,160 shares of common stock underlying the Exchangeable Notes held by Fortress Vintage Securities Fund LP (“Vintage”). Fortress Vintage Securities Fund Advisors LLC (“Vintage Advisors”) is the investment manager of Vintage and Fortress Vintage Securities Fund GP LLC (“Vintage GP”) is the investment manager of Vintage and Fortress Vintage Securities Fund GP LLC (“Vintage GP”) is the general partner of Vintage. As the Co-Chief Investment Officers of Vintage Advisors and Vintage GP, each of Peter L. Briger, Jr., Dean Dakolias, Drew McKnight and Joshua Pack participates in the voting and investment decisions with respect to the shares held by Vintage, but each of them disclaims beneficial ownership thereof. The business address of each of the foregoing entities and persons is 1345 Avenue of the Americas, 46th Floor, New York, NY 10105.
(7)The number of shares reported herein consists of (i) 47,665 shares of common stock; and (ii) 4,576,000 shares of common stock underlying the Exchangeable Notes held by Fortress Lending Fund II Holdings LP (“Lending Fund”). Fortress Lending Advisors II LLC (“FLA Advisors II”) is the investment manager of Lending Fund. As the Co-Chief Investment Officers of FLA Advisors II, each of Andrew McKnight, Joshua Pack, Dominick Ruggiero and Aaron Blanchette participates in the voting and investment decisions with respect to the shares held by the Lending Fund, but each of them disclaims beneficial ownership thereof. The business address of each of the foregoing entities and persons is 1345 Avenue of the Americas, 46th Floor, New York, NY 10105.
(8)The number of shares reported herein consists of (i) 5,009 shares of common stock; and (ii) 480,800 shares of common stock underlying the Exchangeable Notes held by Fortress Lending Fund II MA-CRPTF LP (“CRPTF”). FLF II MA-CRPTF Advisors LLC, a Delaware limited liability company (“FLF II Advisors”) is the investment manager of CRPTF. As the Co-Chief Investment Officers of FLF II Advisors, each of Andrew McKnight, Joshua Pack, Dominick Ruggiero and Aaron Blanchette participates in the voting and investment decisions with respect to the shares held by CRPTF, but each of them disclaims beneficial ownership thereof. The business address of each of the foregoing entities and persons is 1345 Avenue of the Americas, 46th Floor, New York, NY 10105.
(9)The common stock reported herein is held by Cowen Investments II LLC. As the sole member of Cowen Investments II LLC, RCG LV Pearl LLC may be deemed to beneficially own the securities owned directly by Cowen Investments II LLC. As the sole member of RCG LV Pearl LLC, Cowen Inc. may be deemed to beneficially own the securities owned directly by Cowen Investments II LLC. As Chief Executive Officer of Cowen Inc., Mr. Jeffrey Solomon may be deemed to beneficially own the securities owned directly by Cowen Investments II LLC. Mr. Solomon disclaims beneficial ownership. The business address of each of the foregoing entities and persons is 599 Lexington Ave., New York, NY 10022. Cowen Investments II LLC is an affiliate of Cowen and Company, LLC, a registered broker-dealer and FINRA member. Cowen and Company, LLC was engaged by KORE to act as KORE’s exclusive financial advisor in connection with the Business Combination and received customary fees and expense reimbursements in connection therewith, including the 186,326 shares of common stock offered by Cowen Investments II LLC hereby.
CERTAIN RELATIONSHIPS AND RELATED PERSON TRANSACTIONS
Indemnification Agreements
On September 30, 2021, we entered into indemnification agreements with each of our directors and executive officers. Under the terms of such indemnification agreements, we are required to indemnify each of our directors and executive officers, to the fullest extent permitted by the laws of the state of Delaware, if the basis of the indemnitee’s involvement was by reason of the fact that the indemnitee is or was our director or officer or was serving at our request in an official capacity for another entity. We must indemnify our directors and executive officers against all reasonable direct and indirect costs, fees and expenses of any type or nature whatsoever, including all other disbursements, obligations or expenses of the types customarily incurred in connection with prosecuting, defending, preparing to prosecute or defend, investigating, being or preparing to be witness in, settlement or appeal of, or otherwise participating in any threatened, pending or completed action, suit, claim, counterclaim, cross claim, arbitration, mediation, alternate dispute resolution mechanism, investigation, inquiry, administrative hearing or any other actual, threatened or completed proceeding. The indemnification agreements also require us to advance, to the extent not prohibited by law, all direct and indirect costs, fees and expenses that such director or executive officer incurred, provided that such person will return any such advance if it is ultimately determined that such person is not entitled to indemnification by us.
Leasing and Professional Services Agreement
KORE TM Data Brasil Processamento de Dados Ltda., a wholly owned subsidiary of the Company, maintains a lease and a professional services agreement with a company controlled by a key member of our management team.
Aggregated related party transactions, which have been recorded at the exchange amount, representing the amount of consideration established and agreed by the related parties, was $0.3 million and $0.2 million for the years ended December 31, 2022, and 2021, respectively. The amount was recorded under selling, general and administrative expenses in the consolidated statements of operations.
Business Mobility Partners, Inc. (“BMP, Inc.”) a wholly owned subsidiary of the Company, has an informal services agreement with BMP Brasil Locacoes Ltda (“BMP Brasil”), located in Sao Paulo, Brazil, which is controlled by two key members of our management team. We do not have any ownership interest or control over BMP Brasil.
BMP Brasil renders technical assistance services to purchase and deliver telecommunication equipment to BMP, Inc.’s clients in Brazil. For the services agreed upon, BMP Brasil was paid a nominal monthly fixed fee plus a fee of 7% of the gross amount of each cost incurred to purchase and deliver telecommunication equipment to our clients in Brazil. Since BMP, Inc.’s acquisition on February 16, 2022, we have incurred and paid $2.3 million to BMP Brasil for hardware and services rendered during 2022.
Engagement and Employment
KORE Wireless, Inc, a wholly owned subsidiary of the Company, employs the son of H. Paulett Eberhart. Effective December 1, 2021, Ms. Eberhart’s son was employed as Senior Analyst with a salary of $120,000 per year, and he received a signing bonus of $20,000. Prior to being employed by KORE Wireless, Inc., Ms. Eberhart’s son was an independent contractor of KORE Wireless, Inc., and he received an aggregate of $109,000 during 2021 in connection with such services.
Investor Rights Agreement
On September 30, 2021, in connection with the consummation of the Business Combination and as contemplated by the Merger Agreement, we thereto entered into an Investor Rights Agreement with the Sponsor, certain stockholders of KORE, and the other parties (the “Investor Rights Agreement”), setting forth the parties’ rights and obligations with respect to the designation, removal and replacement of our directors and the registration for resale of certain shares of our common stock and other equity securities of KORE that are held by the parties thereto from time to time.
Policies and Procedures for Related Person Transactions
We have adopted a written related person transaction policy that sets forth the following policies and procedures for the review and approval or ratification of related person transactions. A “related person transaction” is a transaction, arrangement or relationship in which we or any of our subsidiaries were, are or will be a participant, the amount of which involved exceeds $120,000, and in which any related person had, has or will have a direct or indirect material interest. A “related person” means:
•any person who is, or at any time during the applicable period was, one of our executive officers or directors;
•any person who is known by us to be the beneficial owner of more than 5% of our voting stock;
•any immediate family member of any of the foregoing persons, which means any child, stepchild, parent, stepparent, spouse, sibling, mother-in-law, father-in-law, son-in-law, daughter-in-law, brother in-law or sister-in-law of a director, executive officer or a beneficial owner of more than 5% of our voting stock, and any person (other than a tenant or employee) sharing the household of such director, executive officer or beneficial owner of more than 5% of our voting stock; and
•any firm, corporation or other entity in which any of the foregoing persons is a partner or principal, or in a similar position, or in which such person has a 10% or greater beneficial ownership interest.
We have policies and procedures designed to minimize potential conflicts of interest arising from any dealings it may have with its affiliates and to provide appropriate procedures for the disclosure of any real or potential conflicts of interest that may exist from time to time. Specifically, pursuant to its audit committee charter, the audit committee has the responsibility to review related party transactions.
DESCRIPTION OF OUR SECURITIES
The following summary of certain provisions of our securities does not purport to be complete and is subject to the Certificate of Incorporation, the Bylaws, the Warrant Agreement and the provisions of applicable law. Copies of the Certificate of Incorporation, the Bylaws and the Warrant Agreement are attached as exhibits to the registration statement of which this prospectus is a part.
Capital Stock
Authorized and Outstanding Stock
Our amended and restated certificate of incorporation authorizes the issuance of 350,000,000 shares of capital stock, each with a par value of $0.0001, consisting of (a) 315,000,000 shares of common stock and (b) 35,000,000 shares of preferred stock.
Voting Power
Except as otherwise required by law or as otherwise provided in any certificate of designation for any series of preferred stock, under the amended and restated certificate of incorporation, the holders of common stock shall be entitled to vote on each matter submitted to a vote of stockholders and shall be entitled to one vote for each share of common stock held of record by such holder as of the record date for determining stockholders entitled to vote on such matter, including the election or removal of directors. The holders of common stock will at all times vote together as one class on all matters submitted to a vote of common stock under the amended and restated certificate of incorporation.
Dividends
Subject to applicable law and the rights and preferences of any holders of any outstanding shares of preferred stock, under the amended and restated certificate of incorporation, dividends and distributions may be declared and paid ratably on the common stock out of our assets that are legally available for this purpose at such times and in such amounts as our Board in its discretion shall determine.
Liquidation, Dissolution and Winding Up
Subject to applicable law and the rights and preferences of any holders of any shares of any outstanding series of preferred stock, in the event of any liquidation, dissolution, or winding-up, whether voluntary or involuntary, after payment or provision for payment of the debts and other liabilities of the company and subject to the rights, if any, of the holders of any outstanding series of preferred stock or any class or series of stock having a preference over or the right to participate with the common stock with respect to the distribution of assets upon such dissolution, liquidation or winding up of the company, the holders of common stock will be entitled to receive all the remaining assets of the company available for distribution to stockholders, ratably in proportion to the number of shares of common stock held by each such holder.
Preemptive or Other Rights
The holders of common stock do not have preemptive or other subscription rights and there will be no sinking fund or redemption provisions applicable to common stock.
Warrants
Each whole warrant entitles the registered holder to purchase one share of our common stock at a price of $11.50 per share, subject to adjustment as discussed below. Pursuant to the terms of the Warrant Agreement, a warrant holder may exercise its warrants only for a whole number of shares of our common stock. This means only a whole warrant may be exercised at a given time by a warrant holder. The warrants will expire five years after the completion of the Business Combination at 5:00 p.m., New York City time, or earlier upon redemption or liquidation.
We are not obligated to deliver any shares of our common stock pursuant to the exercise of a warrant and have no obligation to settle such warrant exercise unless a registration statement under the Securities Act covering the issuance of the shares of our common stock issuable upon exercise of the warrants is then effective and a current prospectus relating to those shares of common stock is available, subject to our satisfying our obligations described below with respect to registration. No warrant will be exercisable for cash or on a cashless basis (unless permitted by us in certain circumstances specified in the Warrant Agreement), and we are not obligated to issue any shares to holders seeking to exercise their warrants, unless the issuance of the shares upon such exercise is registered or qualified under the securities laws of the state of the exercising holder, or an exemption from registration is available. In the event that the conditions in the two immediately preceding sentences are not satisfied with respect to a warrant, the holder of such warrant will not be entitled to exercise such warrant and such warrant may have no value and expire worthless. In the event that a registration statement is not effective for the exercised warrants, the purchaser of a unit containing such warrant will have paid the full purchase price for the unit solely for the share of our common stock underlying such unit.
Redemption of Warrants for Cash when the price per share of our common stock equals or exceeds $10.00
Once the warrants become exercisable, we may call the warrants for redemption:
•in whole and not in part;
•at $0.10 per warrant upon a minimum of 30 days’ prior written notice of redemption provided that holders will be able to exercise their warrants on a cashless basis prior to redemption and receive that number of shares determined by reference to the table below, based on the redemption date and the “fair market value” of shares of our common stock except as otherwise described below; and
•if, and only if, the closing price of our common stock equals or exceeds $10.00 per public share (as adjusted for stock splits, stock recapitalizations, reorganizations, recapitalizations and the like) for any 20 trading days within the 30-trading day period ending three trading days before we send the notice of redemption to the warrant holders.
Beginning on the date the notice of redemption is given until the warrants are redeemed or exercised, holders may elect to exercise their warrants on a cashless basis. The numbers in the table below represent the number of shares of our common stock that a warrant holder will receive upon such cashless exercise in connection with a redemption by us pursuant to this redemption feature, based on the “fair market value” of shares of our common stock on the corresponding redemption date (assuming holders elect to exercise their warrants and such warrants are not redeemed for $0.10 per warrant), determined for these purposes based on volume weighted average price of shares of our common stock during the 10 trading days immediately following the date on which the notice of redemption is sent to the holders of warrants, and the number of months that the corresponding redemption date precedes the expiration date of the warrants, each as set forth in the table below. We will provide warrant holders with the final fair market value no later than one business day after the 10-trading day period described above ends.
The share prices set forth in the column headings of the table below will be adjusted as of any date on which the number of shares issuable upon exercise of a warrant or the exercise price of a warrant is adjusted as set forth under the heading “—Anti-Dilution Adjustments” below. If the number of shares issuable upon exercise of a warrant is adjusted, the adjusted share prices in the column headings will equal the share prices immediately prior to such adjustment, multiplied by a fraction, the numerator of which is the number of shares deliverable upon exercise of a warrant immediately prior to such adjustment and the denominator of which is the number of shares deliverable upon exercise of a warrant as so adjusted. The number of shares in the table below shall be adjusted in the same manner and at the same time as the number of shares issuable upon exercise of a warrant. If the exercise price of a warrant is adjusted, (a) in the case of an adjustment pursuant to the fifth paragraph under the heading “—Anti-Dilution Adjustments” below, the adjusted share prices in the column headings will equal the unadjusted share price multiplied by a fraction, the numerator of which is the higher of the Market Value and the Newly Issued Price as set forth under the heading “—Anti-Dilution Adjustments” and the denominator of which is $10.00 and (b) in the case of an adjustment pursuant to the second paragraph under the heading “—Anti-Dilution Adjustments” below, the
adjusted share prices in the column headings will equal the unadjusted share price less the decrease in the exercise price of a warrant pursuant to such exercise price adjustment.
| | | | | | | | | | | | | | | | | | | | | | | | | | | | | | | | | | | | | | | | | | | | | | | | | | | | | | | | |
Redemption Date (period to expiration of warrants) | | Fair Market Value of Our Common Stock |
| $10.00 | | 11.00 | | 12.00 | | 13.00 | | 14.00 | | 15.00 | | 16.00 | | 17.00 | | 18.00 |
60 months | | 0.261 | | | 0.281 | | | 0.297 | | | 0.311 | | | 0.324 | | | 0.337 | | | 0.348 | | | 0.358 | | | 0.361 | |
57 months | | 0.257 | | | 0.277 | | | 0.294 | | | 0.310 | | | 0.324 | | | 0.337 | | | 0.348 | | | 0.358 | | | 0.361 | |
54 months | | 0.252 | | | 0.272 | | | 0.291 | | | 0.307 | | | 0.322 | | | 0.335 | | | 0.347 | | | 0.357 | | | 0.361 | |
51 months | | 0.246 | | | 0.268 | | | 0.287 | | | 0.304 | | | 0.320 | | | 0.333 | | | 0.346 | | | 0.357 | | | 0.361 | |
48 months | | 0.241 | | | 0.263 | | | 0.283 | | | 0.301 | | | 0.317 | | | 0.332 | | | 0.344 | | | 0.356 | | | 0.361 | |
45 months | | 0.235 | | | 0.258 | | | 0.279 | | | 0.298 | | | 0.315 | | | 0.330 | | | 0.343 | | | 0.356 | | | 0.361 | |
42 months | | 0.228 | | | 0.252 | | | 0.274 | | | 0.294 | | | 0.312 | | | 0.328 | | | 0.342 | | | 0.355 | | | 0.361 | |
39 months | | 0.221 | | | 0.246 | | | 0.269 | | | 0.290 | | | 0.309 | | | 0.325 | | | 0.340 | | | 0.354 | | | 0.361 | |
36 months | | 0.213 | | | 0.239 | | | 0.263 | | | 0.285 | | | 0.305 | | | 0.323 | | | 0.339 | | | 0.353 | | | 0.361 | |
33 months | | 0.205 | | | 0.232 | | | 0.257 | | | 0.280 | | | 0.301 | | | 0.320 | | | 0.337 | | | 0.352 | | | 0.361 | |
30 months | | 0.196 | | | 0.224 | | | 0.250 | | | 0.274 | | | 0.297 | | | 0.316 | | | 0.335 | | | 0.351 | | | 0.361 | |
27 months | | 0.185 | | | 0.214 | | | 0.242 | | | 0.268 | | | 0.291 | | | 0.313 | | | 0.332 | | | 0.350 | | | 0.361 | |
24 months | | 0.173 | | | 0.204 | | | 0.233 | | | 0.260 | | | 0.285 | | | 0.308 | | | 0.329 | | | 0.348 | | | 0.361 | |
21 months | | 0.161 | | | 0.193 | | | 0.223 | | | 0.252 | | | 0.279 | | | 0.304 | | | 0.326 | | | 0.347 | | | 0.361 | |
18 months | | 0.146 | | | 0.179 | | | 0.211 | | | 0.242 | | | 0.271 | | | 0.298 | | | 0.322 | | | 0.345 | | | 0.361 | |
15 months | | 0.130 | | | 0.164 | | | 0.197 | | | 0.230 | | | 0.262 | | | 0.291 | | | 0.317 | | | 0.342 | | | 0.361 | |
12 months | | 0.111 | | | 0.146 | | | 0.181 | | | 0.216 | | | 0.250 | | | 0.282 | | | 0.312 | | | 0.339 | | | 0.361 | |
9 months | | 0.090 | | | 0.125 | | | 0.162 | | | 0.199 | | | 0.237 | | | 0.272 | | | 0.305 | | | 0.336 | | | 0.361 | |
6 months | | 0.065 | | | 0.099 | | | 0.137 | | | 0.178 | | | 0.219 | | | 0.259 | | | 0.296 | | | 0.331 | | | 0.361 | |
3 months | | 0.034 | | | 0.065 | | | 0.104 | | | 0.150 | | | 0.197 | | | 0.243 | | | 0.286 | | | 0.326 | | | 0.361 | |
0 months | | — | | | — | | | 0.042 | | | 0.115 | | | 0.179 | | | 0.233 | | | 0.281 | | | 0.323 | | | 0.361 | |
The exact fair market value and redemption date may not be set forth in the table above, in which case, if the fair market value is between two values in the table or the redemption date is between two redemption dates in the table, the number of shares of our common stock to be issued for each warrant exercised will be determined by a straight-line interpolation between the number of shares set forth for the higher and lower fair market values and the earlier and later redemption dates, as applicable, based on a 365- or 366-day year, as applicable. For example, if the volume weighted average price of shares of our common stock during the 10 trading days immediately following the date on which the notice of redemption is sent to the holders of the warrants is $11.00 per share, and at such time there are 57 months until the expiration of the warrants, holders may choose to, in connection with this redemption feature, exercise their warrants for 0.277 shares of our common stock for each whole warrant. For an example where the exact fair market value and redemption date are not as set forth in the table above, if the volume weighted average price of shares of our common stock during the 10 trading days immediately following the date on which the notice of redemption is sent to the holders of the warrants is $13.50 per share, and at such time there are 38 months until the expiration of the warrants, holders may choose to, in connection with this redemption feature, exercise their warrants for 0.298 shares of our common stock for each whole warrant. In no event will the warrants be exercisable on a cashless basis in connection with this redemption feature for more than 0.361 shares of our common stock per warrant (subject to adjustment). Finally, as reflected in the table above, if the warrants are out of the money and about to expire, they cannot be exercised on a cashless basis in connection with a redemption by us pursuant to this redemption feature, since they will not be exercisable for any shares of our common stock.
This redemption feature differs from the typical warrant redemption features used in many other blank check offerings, which typically only provide for a redemption of warrants for cash (other than the private placement
warrants) when the trading price for the Class A ordinary shares exceeds $18.00 per share for a specified period of time. This redemption feature is structured to allow for all of the outstanding warrants to be redeemed when the shares of our common stock are trading at or above $10.00 per public share, which may be at a time when the trading price of shares of our common stock is below the exercise price of the warrants. This redemption feature provides flexibility to redeem the warrants without the warrants having to reach the $18.00 per share threshold set forth above under “-Redemption of Warrants for Cash when the price per share of our common stock equals or exceeds $18.00.” Holders choosing to exercise their warrants in connection with a redemption pursuant to this feature will, in effect, receive a number of shares for their warrants based on an option pricing model with a fixed volatility input as of the CTAC initial public offering. This redemption right provides us with an additional mechanism by which to redeem all of the outstanding warrants, and therefore have certainty as to our capital structure as the warrants would no longer be outstanding and would have been exercised or redeemed. We will be required to pay the applicable redemption price to warrant holders if we choose to exercise this redemption right and it will allow us to quickly proceed with a redemption of the warrants if we determine it is in our best interest to do so. As such, we would presumably redeem the warrants in this manner when we believe it is in our best interest to update its capital structure to remove the warrants and pay the redemption price to the warrant holders.
As stated above, we can redeem the warrants when the shares of our common stock are trading at a price starting at $10.00, which is below the exercise price of $11.50, because it will presumably provide certainty with respect to our capital structure and cash position while providing warrant holders with the opportunity to exercise their warrants on a cashless basis for the applicable number of shares. If we choose to redeem the warrants when the shares of our common stock are trading at a price below the exercise price of the warrants, this could result in the warrant holders receiving fewer shares of our common stock than they would have received if they had chosen to wait to exercise their warrants for shares of common stock if and when such shares of our common stock were trading at a price higher than the exercise price of $11.50.
No fractional shares of our common stock will be issued upon exercise. If, upon exercise, a holder would be entitled to receive a fractional interest in a share, we will round down to the nearest whole number of the number of shares of our common stock to be issued to the holder. We will use commercially reasonable efforts to register under the Securities Act the shares of our common stock issuable upon the exercise of the warrants.
Redemption Procedures
A holder of a warrant may notify us in writing in the event we elect to be subject to a requirement that such holder will not have the right to exercise such warrant, to the extent that after giving effect to such exercise, such person (together with such person’s affiliates), to the warrant agent’s actual knowledge, would beneficially own in excess of 9.8% (or other amount as specified by the holder) of the shares of our common stock outstanding immediately after giving effect to such exercise.
Anti-Dilution Adjustments
If the number of outstanding shares of our common stock is increased by a capitalization or stock dividend payable in shares of our common stock or by a split-up of shares of our common stock or other similar event, then, on the effective date of such capitalization, stock dividend, split-up or similar event, the number of shares of our common stock issuable on exercise of each warrant will be increased in proportion to such increase in the outstanding shares of our common stock. A rights offering made to all or substantially all holders of our common stock entitling holders to purchase shares of our common stock at a price less than the “historical fair market value” (as defined below) will be deemed a stock dividend of a number of shares of our common stock equal to the product of (1) the number of shares of our common stock actually sold in such rights offering (or issuable under any other equity securities sold in such rights offering that are convertible into or exercisable for our common stock) multiplied by (2) one minus the quotient of (x) the price per share of our common stock paid in such rights offering and (y) the “historical fair market value.” For these purposes (1) if the rights offering is for securities convertible into or exercisable for our common stock, in determining the price payable for our common stock, there will be taken into account any consideration received for such rights, as well as any additional amount payable upon exercise or conversion and (2) historical fair market value means the volume weighted average price per share of our common stock as reported during the ten trading day period ending on the trading day prior to the first date on which
the shares of our common stock trade on the applicable exchange or in the applicable market, regular way, without the right to receive such rights.
In addition, if we, at any time while the warrants are outstanding and unexpired, pay a dividend or make a distribution in cash, securities or other assets to the holders of our common stock on account of such shares of our common stock (or other securities of our capital stock into which the warrants are convertible), other than (a) as described above or (b) any cash dividends or cash distributions which, when combined on a per share basis with all other cash dividends and cash distributions paid on the shares of our common stock during the 365-day period ending on the date of declaration of such dividend or distribution does not exceed $0.50 (as adjusted to appropriately reflect any other adjustments and excluding cash dividends or cash distributions that result in an adjustment to the exercise price or to the number of shares of our common stock issuable on exercise of each warrant) but only with respect to the amount of the aggregate cash dividends or cash distributions equal to or less than $0.50 per share, then the warrant exercise price will be decreased, effective immediately after the effective date of such event, by the amount of cash and/or the fair market value of any securities or other assets paid on each share of our common stock in respect of such event.
If the number of outstanding shares of our common stock is decreased by a consolidation, combination, reverse stock split or reclassification of shares of our common stock or other similar event, then, on the effective date of such consolidation, combination, reverse stock split, reclassification or similar event, the number of shares of our common stock issuable on exercise of each warrant will be decreased in proportion to such decrease in outstanding shares of our common stock.
Whenever the number of shares of our common stock purchasable upon the exercise of the warrants is adjusted, as described above, the warrant exercise price will be adjusted by multiplying the warrant exercise price immediately prior to such adjustment by a fraction (x) the numerator of which will be the number of shares of our common stock purchasable upon the exercise of the warrants immediately prior to such adjustment, and (y) the denominator of which will be the number of shares of our common stock so purchasable immediately thereafter.
In addition, if (x) we issue additional shares of our common stock or equity-linked securities for capital raising purposes in connection with the closing of our initial business combination, at an issue price or effective issue price of less than $9.20 per share of our common stock (with such issue price or effective issue price to be determined in good faith by our board of directors), (the “Newly Issued Price”) (y) the aggregate gross proceeds from such issuances represent more than 60% of the total equity proceeds, and interest thereon, available for the funding of our initial business combination on the date of the consummation of our initial business combination (net of redemptions), and (z) the volume weighted average trading price of our common stock during the 20-trading-day period starting on the trading day after the day on which we consummate our initial business combination (such price, the “Market Value”) is below $9.20 per share, the exercise price of the warrants will be adjusted (to the nearest cent) to be equal to 115% of the higher of the Market Value and the Newly Issued Price, and the $18.00 per share redemption trigger price will be adjusted (to the nearest cent) to be equal to 180% of the higher of the Market Value and the Newly Issued Price.
In case of any reclassification or reorganization of the outstanding shares of our common stock (other than those described above or that solely affects the par value of such shares of our common stock), or in the case of any merger or consolidation of us with or into another corporation (other than a consolidation or merger in which we are the continuing corporation and that does not result in any reclassification or reorganization of our outstanding shares of our common stock), or in the case of any sale or conveyance to another corporation or entity of the assets or other property of us as an entirety or substantially as an entirety in connection with which we are dissolved, the holders of the warrants will thereafter have the right to purchase and receive, upon the basis and upon the terms and conditions specified in the warrants and in lieu of the shares of our common stock immediately theretofore purchasable and receivable upon the exercise of the rights represented thereby, the kind and amount of shares of stock or other securities or property (including cash) receivable upon such reclassification, reorganization, merger or consolidation, or upon a dissolution following any such sale or transfer, that the holder of the warrants would have received if such holder had exercised their warrants immediately prior to such event. However, if such holders were entitled to exercise a right of election as to the kind or amount of securities, cash or other assets receivable upon such consolidation or merger, then the kind and amount of securities, cash or other assets for which each warrant will
become exercisable will be deemed to be the weighted average of the kind and amount received per share by such holders in such consolidation or merger that affirmatively make such election, and if a tender, exchange or redemption offer has been made to and accepted by such holders under circumstances in which, upon completion of such tender or exchange offer, the maker thereof, together with members of any group (within the meaning of Rule 13d-5(b)(1) under the Exchange Act) of which such maker is a part, and together with any affiliate or associate of such maker (within the meaning of Rule 12b-2 under the Exchange Act) and any members of any such group of which any such affiliate or associate is a part, own beneficially (within the meaning of Rule 13d-3 under the Exchange Act) more than 50% of the issued and outstanding shares of our common stock, the holder of a warrant will be entitled to receive the highest amount of cash, securities or other property to which such holder would actually have been entitled as a shareholder if such warrant holder had exercised the warrant prior to the expiration of such tender or exchange offer, accepted such offer and all of the shares of our common stock held by such holder had been purchased pursuant to such tender or exchange offer, subject to adjustment (from and after the consummation of such tender or exchange offer) as nearly equivalent as possible to the adjustments provided for in the Warrant Agreement. Additionally, if less than 70% of the consideration receivable by the holders of our common stock in such a transaction is payable in the form of common stock in the successor entity that is listed for trading on a national securities exchange or is quoted in an established over-the-counter market, or is to be so listed for trading or quoted immediately following such event, and if the registered holder of the warrant properly exercises the warrant within 30 days following public disclosure of such transaction, the warrant exercise price will be reduced as specified in the Warrant Agreement based on the per share consideration minus Black-Scholes Warrant Value (as defined in the Warrant Agreement) of the warrant. The purpose of such exercise price reduction is to provide additional value to holders of the warrants when an extraordinary transaction occurs during the exercise period of the warrants pursuant to which the holders of the warrants otherwise do not receive the full potential value of the warrants.
The warrants were issued in registered form under the Warrant Agreement, which in connection with the Business Combination, CTAC assigned and we assumed the obligations and rights set forth therein. The Warrant Agreement provides that the terms of the warrants may be amended without the consent of any holder for the purpose of (i) curing any ambiguity or correct any mistake, including to conform the provisions of the warrant agreement to the description of the terms of the warrants and the warrant agreement set forth in the CTAC prospectus, or defective provision, (ii) amending the provisions relating to cash dividends on ordinary shares as contemplated by and in accordance with the warrant agreement or (iii) adding or changing any provisions with respect to matters or questions arising under the warrant agreement as the parties to the warrant agreement may deem necessary or desirable and that the parties deem to not adversely affect the rights of the registered holders of the warrants, provided that the approval by the holders of at least 65% of the then-outstanding public warrants is required to make any change that adversely affects the interests of the registered holders.
The warrant holders do not have the rights or privileges of holders of shares of our common stock and any voting rights until they exercise their warrants and receive shares of our common stock. After the issuance of shares of our common stock upon exercise of the warrants, each holder will be entitled to one vote for each share held of record on all matters to be voted on by our stockholders.
No fractional warrants will be issued upon separation of the units and only whole warrants will trade. If, upon exercise of the warrants, a holder would be entitled to receive a fractional interest in a share, we will, upon exercise, round down to the nearest whole number the number shares of our common stock to be issued to the warrant holder.
The parties to the Warrant Agreement have agreed that, subject to applicable law, any action, proceeding or claim against us arising out of or relating in any way to the warrant agreement will be brought and enforced in the courts of the State of New York or the United States District Court for the Southern District of New York, and such parties irrevocably submit to such jurisdiction, which jurisdiction will be the exclusive forum for any such action, proceeding or claim. This provision applies to claims under the Securities Act but does not apply to claims under the Exchange Act or any claim for which the federal district courts of the United States of America are the sole and exclusive forum.
Exclusive Forum
Our amended and restated certificate of incorporation requires, to the fullest extent permitted by law, that (i) any derivative action or proceeding brought on behalf of us, (ii) any action asserting a claim of breach of a fiduciary duty owed by any of our directors, officers or stockholders to us or our stockholders, (iii) any action asserting a claim against us arising pursuant to any provision of the DGCL or our amended and restated certificate of incorporation or our bylaws, (iv) any action arising pursuant to any provision of the DGCL, our bylaws or the amended and restated certificate of incorporation or (v) any action asserting a claim against us or any current or former director, officer or stockholder governed by the internal affairs doctrine will have to be brought in a state court located within the state of Delaware (or if no state court of the State of Delaware has jurisdiction, the federal district court for the District of Delaware), in all cases subject to the court’s having personal jurisdiction over the indispensable parties named as defendants. The foregoing provision will not apply to claims arising under the Securities Act, the Exchange Act or any other claim for which the federal courts of the United States have exclusive jurisdiction. Unless we consent in writing to the selection of an alternative forum, to the fullest extent permitted by law, the federal district courts of the United States of America shall be the exclusive forum for the resolution of any complaint asserting a cause of action arising under the Securities Act and the Exchange Act.
Anti-Takeover Effects of Provisions of our Amended and Restated Certificate of Incorporation and Bylaws
The provisions of our amended and restated certificate of incorporation and bylaws and of the DGCL summarized below may have an anti-takeover effect and may delay, defer or prevent a tender offer or takeover attempt that you might consider in your best interest, including an attempt that might result in your receipt of a premium over the market price for your shares of common stock.
The amended and restated certificate of incorporation and bylaws contain certain provisions that are intended to enhance the likelihood of continuity and stability in the composition of our board of directors and that may have the effect of delaying, deferring or preventing a future takeover or change in control of us, unless such takeover or change in control is approved by our board of directors.
These provisions include:
Business Combination:
•We have elected not to be governed by Section 203 of the DGCL, which prohibits a corporation that has voting stock traded on a national security exchange from engaging in certain business combinations with an interested stockholder (defined as the owner of 15% or more of the corporation’s voting stock), or an interested stockholder’s affiliates or associates, for a three-year period unless, among other exceptions, certain board approvals are received.
•Our amended and restated certificate of incorporation generally prohibits us from engaging in any business combination with any interested stockholder for a period of three years following the time that such stockholder became an interested stockholder, unless:
•Prior to such time, the board approved the transaction that resulted in the stockholder becoming an interested stockholder;
•Upon consummation of the transaction that resulted in the stockholder becoming an interested stockholder, the interested stockholder owned at least 85% of the outstanding voting stock at the time the transaction commenced (excluding for purposes of determining the voting stock outstanding (but not the outstanding voting stock owned by the interested stockholder) those shares owned by (i) persons who are directors and also officers and (ii) employee stock plans in which employee participants do not have the right to determine confidentially whether shares held subject to the plan will be tendered in a tender or exchange offer);
•At or subsequent to such time, the business combination is approved by the board and authorized at an annual or special meeting of stockholders, and not by written consent, by the affirmative vote of at least 66 2/3% of the outstanding voting stock that is not owned by the interested stockholder; or
•The stockholder became an interested stockholder inadvertently and (i) as soon as practicable divested itself of ownership of sufficient shares so that the stockholder ceased to be an interested stockholder and (ii) was not, at any time within the three-year period immediately prior to a business combination between us and such stockholder, an interested stockholder but for the inadvertent acquisition of ownership.
No Written Consent: Any action required or permitted to be taken by the stockholders must be effected at an annual or special meeting of the stockholders, and shall not be taken by written consent in lieu of a meeting.
Amendments: For a period of seven years following closing of this offering, a substantial portion of the provisions under the amended and restated certificate of incorporation may not be amended without the affirmative vote of the holders of at least 66 2/3% of the total voting power of all the then outstanding shares of stock entitled to vote thereon, voting together as a single class.
Stockholder Proposals:
•Our bylaws establish an advance notice procedure for stockholders who wish to present a proposal before an annual meeting of stockholders. Our bylaws provide that the only business that may be conducted at an annual meeting of stockholders is business that is (i) specified in the notice of such meeting (or any supplement thereto) given by or at the direction of our board of directors, (ii) otherwise properly brought before such meeting by our board of directors or the chairperson of the board, or (iii) otherwise properly brought before such meeting by a stockholder present in person who (A) (1) was a record owner of shares both at the time of giving the notice and at the time of such meeting, (2) is entitled to vote at such meeting, and (3) has complied with notice procedures specified in our bylaws in all applicable respects or (B) properly made such proposal in accordance with Rule 14a-8 under the Exchange Act. To be timely for our annual meeting of stockholders, a stockholders’ notice must be delivered to, or mailed and received at, the principal executive offices of the corporation not less than 90 days nor more than 120 days prior to the one-year anniversary of the preceding year’s annual meeting; provided, however, that if the date of the annual meeting is more than 30 days before or more than 60 days after such anniversary date, notice by the stockholder to be timely must be so delivered, or mailed and received, not later than the 90th day prior to such annual meeting or, if later, the 10th day following the day on which public disclosure of the date of such annual meeting was first made by the corporation. In no event shall any adjournment or postponement of an annual meeting or the announcement thereof commence a new time period (or extend any time period) for the giving of timely notice as described above.
•Our 2023 annual meeting of stockholders will be held on June 15, 2023. Nominations and proposals also must satisfy other requirements set forth in our bylaws.
•Under Rule 14a-8 of the Exchange Act, a stockholder proposal to be included in the proxy statement and proxy card for the 2022 annual general meeting pursuant to Rule 14a-8 must be received at our principal office a reasonable time before we begin to print and send its proxy materials and must comply with Rule 14a-8.
Limitations on Liability and Indemnification of Officers and Directors
Our amended and restated certificate of incorporation limits the liability of our directors to the fullest extent permitted by the DGCL and provides that we will provide them with customary indemnification and advancement of expenses. We have entered into customary indemnification agreements with each of our executive officers and directors that provide them, in general, with customary indemnification in connection with their service to us or on our behalf.
Our Transfer Agent and Warrant Agent
The transfer agent for our common stock and warrant agent for our warrants is Continental Stock Transfer & Trust Company. We have agreed to indemnify Continental Stock Transfer & Trust Company in its roles as transfer agent and warrant agent, its agents and each of its stockholders, directors, officers and employees against all claims and losses that may arise out of acts performed or omitted for its activities in that capacity, except for any claims and losses due to any gross negligence or intentional willful misconduct or bad faith of the indemnified person or entity.
Listing of Common Stock and Warrants
Our common stock trades on the NYSE under the ticker symbol “KORE” and our warrants trade on the NYSE under the ticker symbol “KORE WS.”
SECURITIES ACT RESTRICTIONS ON RESALE OF OUR SECURITIES
Pursuant to Rule 144, a person who has beneficially owned restricted common stock or warrants for at least six months would be entitled to sell their securities provided that (i) such person is not deemed to have been one of our affiliates at the time of, or at any time during the three months preceding, a sale and (ii) we are subject to the Exchange Act periodic reporting requirements for at least three months before the sale and have filed all required reports under Section 13 or 15(d) of the Exchange Act during the 12 months (or such shorter period as we were required to file reports) preceding the sale. Persons who have beneficially owned restricted common stock or warrants for at least six months but who are our affiliates at the time of, or at any time during the three months preceding, a sale would be subject to additional restrictions, by which such person would be entitled to sell within any three-month period only a number of securities that does not exceed the greater of:
•1% of the total number of shares of our common stock then outstanding; or
•the average weekly reported trading volume of our common stock during the four calendar weeks preceding the filing of a notice on Form 144 with respect to the sale.
Sales by our affiliates under Rule 144 are also limited by manner of sale provisions and notice requirements and by the availability of current public information about us.
Restrictions on the Use of Rule 144 by Shell Companies or Former Shell Companies
Rule 144 is not available for the resale of securities initially issued by shell companies (other than business combination related shell companies) or issuers that have been at any time previously a shell company. However, Rule 144 also includes an important exception to this prohibition if the following conditions are met:
•the issuer of the securities that was formerly a shell company has ceased to be a shell company;
•the issuer of the securities is subject to the reporting requirements of Section 13 or 15(d) of the Exchange Act;
•the issuer of the securities has filed all Exchange Act reports and material required to be filed, as applicable, during the preceding 12 months (or such shorter period that the issuer was required to file such reports and materials), other than Form 8-K reports; and
•at least one year has elapsed from the time that the issuer filed current Form 10 type information with the SEC reflecting its status as an entity that is not a shell company.
As a result of the consummation of the Business Combination, we are no longer a shell company. Rule 144 will therefore be available for the resale of the above noted restricted securities upon satisfaction of the foregoing conditions.
PLAN OF DISTRIBUTION
The Selling Securityholders, which, as used herein, includes donees, pledgees, transferees, distributees or other successors-in-interest selling shares of our common stock received after the date of this prospectus from the Selling Securityholders as a gift, pledge, partnership distribution or other transfer, may, from time to time, sell, transfer, distribute or otherwise dispose of certain of their shares of common stock on any stock exchange, market or trading facility on which shares of our common stock are traded or in private transactions. These dispositions may be at fixed prices, at prevailing market prices at the time of sale, at prices related to the prevailing market price, at varying prices determined at the time of sale, or at negotiated prices.
The Selling Securityholders may use any one or more of the following methods when disposing of their shares of common stock:
•ordinary brokerage transactions and transactions in which the broker-dealer solicits purchasers;
•one or more underwritten offerings on a firm commitment or best efforts basis;
•block trades in which the broker-dealer will attempt to sell the shares of common stock as agent, but may position and resell a portion of the block as principal to facilitate the transaction;
•purchases by a broker-dealer as principal and resale by the broker-dealer for its accounts;
•an exchange distribution in accordance with the rules of the applicable exchange;
•privately negotiated transactions;
•distributions or transfers to their members, partners or shareholders;
•short sales effected after the date of the registration statement of which this prospectus is a part is declared effective by the SEC;
•through the writing or settlement of options or other hedging transactions, whether through an options exchange or otherwise;
•in market transactions, including transactions on a national securities exchange or quotations service or over-the-counter market;
•through trading plans entered into by a Selling Securityholder pursuant to Rule 10b5-1 under the Exchange Act that are in place at the time of an offering pursuant to this prospectus and any applicable prospectus supplement hereto that provide for periodic sales of their securities on the basis of parameters described in such trading plans;
•directly to one or more purchasers, including through a specific bidding, auction or other process or in privately negotiated transactions;
•in “at the market” offerings, as defined in Rule 415 under the Securities Act, at negotiated prices, at prices prevailing at the time of sale or at prices related to such prevailing market prices, including sales made directly on a national securities exchange or sales made through a market maker other than on an exchange or other similar offerings through sales agents;
•through agents;
•through broker-dealers who may agree with the Selling Securityholders to sell a specified number of such shares of common stock at a stipulated price per share;
•by entering into transactions with third parties who may (or may cause others to) issue securities convertible or exchangeable into, or the return of which is derived in whole or in part from the value of, our shares of common stock; and
•a combination of any such methods of sale or any other method permitted pursuant to applicable law.
The Selling Securityholders may, from time to time, pledge or grant a security interest in some shares of our common stock owned by them and, if a Selling Securityholder defaults in the performance of its secured obligations, the pledgees or secured parties may offer and sell such shares of common stock, as applicable, from time to time, under this prospectus, or under an amendment or supplement to this prospectus amending the list of the Selling Securityholders to include the pledgee, transferee or other successors in interest as the Selling Securityholders under this prospectus. The Selling Securityholders also may transfer shares of our common stock in other circumstances, in which case the transferees, pledgees or other successors in interest will be the selling beneficial owners for purposes of this prospectus.
In connection with the sale of shares of our common stock or interests therein, the Selling Securityholders may enter into hedging transactions with broker-dealers or other financial institutions, which may in turn engage in short sales of our common stock in the course of hedging the positions they assume. The Selling Securityholders may also sell shares of our common stock short and deliver these securities to close out their short positions, or loan or pledge shares of our common stock to broker-dealers that in turn may sell these securities. The Selling Securityholders may also enter into option or other transactions with broker-dealers or other financial institutions or the creation of one or more derivative securities that require the delivery to such broker-dealer or other financial institution of shares of our common stock offered by this prospectus, which shares such broker-dealer or other financial institution may resell pursuant to this prospectus (as supplemented or amended to reflect such transaction).
The aggregate proceeds to the Selling Securityholders from the sale of shares of our common stock offered by them will be the purchase price of such shares of our common stock less discounts or commissions, if any. The Selling Securityholders reserve the right to accept and, together with their agents from time to time, to reject, in whole or in part, any proposed purchase of share of our common stock to be made directly or through agents. We will not receive any of the proceeds from any offering by the Selling Securityholders.
There can be no assurance that the Selling Securityholders will sell all or any of the shares of our common stock offered by this prospectus. The Selling Securityholders also may in the future resell a portion of our common stock in open market transactions in reliance upon Rule 144 under the Securities Act, provided that they meet the criteria and conform to the requirements of that rule, or pursuant to other available exemptions from the registration requirements of the Securities Act.
The Selling Securityholders and any underwriters, broker-dealers or agents that participate in the sale of shares of our common stock or interests therein may be “underwriters” within the meaning of Section 2(11) of the Securities Act. Any discounts, commissions, concessions or profit they earn on any resale of shares of our common stock may be underwriting discounts and commissions under the Securities Act. If any Selling Securityholder is an “underwriter” within the meaning of Section 2(11) of the Securities Act, then the Selling Securityholder will be subject to the prospectus delivery requirements of the Securities Act. Underwriters and their controlling persons, dealers and agents may be entitled, under agreements entered into with us and the Selling Securityholders, to indemnification against and contribution toward specific civil liabilities, including liabilities under the Securities Act.
To the extent required, our common stock to be sold, the respective purchase prices and public offering prices, the names of any agent, dealer or underwriter, and any applicable discounts, commissions, concessions or other compensation with respect to a particular offer will be set forth in an accompanying prospectus supplement or, if appropriate, a post-effective amendment to the registration statement that includes this prospectus.
To facilitate the offering of shares of our common stock offered by the Selling Securityholders, certain persons participating in the offering may engage in transactions that stabilize, maintain or otherwise affect the price of our common stock. This may include over-allotments or short sales, which involve the sale by persons participating in the offering of more shares of common stock than were sold to them. In these circumstances, these persons would cover such over-allotments or short positions by making purchases in the open market or by exercising their over-allotment option, if any. In addition, these persons may stabilize or maintain the price of our common stock by bidding for or purchasing shares of common stock in the open market or by imposing penalty bids, whereby selling
concessions allowed to dealers participating in the offering may be reclaimed if shares of common stock sold by them are repurchased in connection with stabilization transactions. The effect of these transactions may be to stabilize or maintain the market price of our common stock at a level above that which might otherwise prevail in the open market. These transactions may be discontinued at any time.
The Selling Securityholders may solicit offers to purchase shares of our common stock directly from, and they may sell such shares of our common stock directly to, institutional investors or others. In this case, no underwriters or agents would be involved. The terms of any of those sales, including the terms of any bidding or auction process, if utilized, will be described in the applicable prospectus supplement to the extent required.
It is possible that one or more underwriters may make a market in our shares of our common stock, but such underwriters will not be obligated to do so and may discontinue any market making at any time without notice. We cannot give any assurance as to the liquidity of the trading market for our shares of our common stock.
Our common stock and warrants are listed on NYSE under the symbols “KORE” and “KORE.WS,” respectively.
The Selling Securityholders may authorize underwriters, broker-dealers or agents to solicit offers by certain purchasers to purchase shares of our common stock at the public offering price set forth in the prospectus supplement pursuant to delayed delivery contracts providing for payment and delivery on a specified date in the future. The contracts will be subject only to those conditions set forth in the prospectus supplement, and the prospectus supplement will set forth any commissions we or the Selling Securityholders pay for solicitation of these contracts. The underwriters, broker-dealers and agents may engage in transactions with us or the Selling Securityholders, or perform services for us or the Selling Securityholders, in the ordinary course of business.
We have agreed to indemnify the Selling Securityholders party thereto against certain liabilities that they may incur in connection with the sale of the securities registered hereunder, including liabilities under the Securities Act, and to contribute to payments that the Selling Securityholders may be required to make with respect thereto. In addition, we and the Selling Securityholders may agree to indemnify any underwriter, broker-dealer or agent against certain liabilities related to the selling of the securities, including liabilities arising under the Securities Act.
We have agreed to maintain the effectiveness of this registration statement until all such securities have been sold under this registration statement or Rule 144 under the Securities Act or are no longer outstanding. We have agreed to pay all expenses in connection with this offering, other than underwriting commissions and discounts, brokerage fees, underwriter marketing costs, and certain legal expenses. The Selling Securityholders will pay any underwriting commissions and discounts, brokerage fees, underwriter marketing costs, and certain legal expenses relating to the offering.
Selling Securityholders may use this prospectus in connection with resales of shares of our common stock. This prospectus and any accompanying prospectus supplement will identify the Selling Securityholders, the terms of our common stock and any material relationships between us and the Selling Securityholders. Selling Securityholders may be deemed to be underwriters under the Securities Act in connection with shares of our common stock they resell and any profits on the sales may be deemed to be underwriting discounts and commissions under the Securities Act. Unless otherwise set forth in a prospectus supplement, the Selling Securityholders will receive all the net proceeds from the resale of shares of our common stock.
A Selling Securityholder that is an entity may elect to make an in-kind distribution of common stock to its members, partners or shareholders pursuant to the registration statement of which this prospectus is a part by delivering a prospectus. To the extent that such members, partners or shareholders are not affiliates of ours, such members, partners or shareholders would thereby receive freely tradable shares of common stock pursuant to the distribution through a registration statement.
We are required to pay all fees and expenses incident to the registration of shares of our common stock and warrants to be offered and sold pursuant to this prospectus.
LEGAL MATTERS
Kirkland & Ellis LLP, New York, New York has passed upon the validity of the securities of KORE Group Holdings, Inc. offered by this prospectus and certain other legal matters related to this prospectus.
EXPERTS
The consolidated financial statements and schedule of KORE Group Holdings, Inc. as of December 31, 2022 and 2021 and for each of the years then ended included in this prospectus and in the Registration Statement have been so included in reliance on the report of BDO USA, LLP, an independent registered public accounting firm, appearing elsewhere herein and in the Registration Statement, given on the authority of said firm as experts in auditing and accounting.
WHERE YOU CAN FIND MORE INFORMATION
We file annual, quarterly and current reports, proxy statements and other information with the SEC. We have also filed a registration statement on Form S-1, including exhibits, under the Securities Act with respect to the shares of common stock offered by this prospectus. This prospectus is part of the registration statement, but does not contain all of the information included in the registration statement or the exhibits. Our SEC filings are available to the public on the internet at a website maintained by the SEC located at http://www.sec.gov. Those filings are also available to the public on, or accessible through, our website under the heading “Investors” at www.korewireless.com. The information on our web site, however, is not, and should not be deemed to be, a part of this prospectus.
FINANCIAL STATEMENTS AND SUPPLEMENTARY DATA
INDEX TO INTERIM CONSOLIDATED FINANCIAL STATEMENTS
INDEX TO ANNUAL CONSOLIDATED FINANCIAL STATEMENTS
KORE Group Holdings, Inc. and Subsidiaries
Consolidated Balance Sheets
(In thousands USD, except share and per share amounts)
| | | | | | | | | | | |
| March 31,
2023 | | December 31,
2022 |
| (unaudited) | | |
| Assets | | | |
| Current assets | | | |
| Cash | $ | 30,600 | | | $ | 34,645 | |
| Accounts receivable, net | 48,055 | | | 44,538 | |
| Inventories, net | 8,774 | | | 10,051 | |
| Income taxes receivable | 424 | | | 502 | |
| Prepaid expenses and other current assets | 12,625 | | | 13,484 | |
| Total current assets | 100,478 | | | 103,220 | |
| Non-current assets | | | |
| Restricted cash | 361 | | | 362 | |
| Property and equipment, net | 12,137 | | | 11,899 | |
| Intangibles assets, net | 183,252 | | | 192,504 | |
| Goodwill | 369,870 | | | 369,706 | |
| Operating lease right-of-use assets | 9,501 | | | 10,019 | |
| Deferred tax assets | 54 | | | 55 | |
| Other long-term assets | 876 | | | 971 | |
| Total assets | $ | 676,529 | | | $ | 688,736 | |
| Liabilities and stockholders’ equity | | | |
| Current liabilities | | | |
| Accounts payable | $ | 23,264 | | | $ | 17,835 | |
| Accrued liabilities | 15,850 | | | 15,793 | |
| Current portion of operating lease liabilities | 1,649 | | | 1,811 | |
| Income taxes payable | 1,212 | | | 207 | |
| Deferred revenue | 7,732 | | | 7,817 | |
| Current portion of long-term debt and other borrowings, net | 5,370 | | | 5,345 | |
| Total current liabilities | 55,077 | | | 48,808 | |
| Non-current liabilities | | | |
| Deferred tax liabilities | 23,272 | | | 25,248 | |
| Warrant liability | 30 | | | 33 | |
| Non-current portion of operating lease liabilities | 8,961 | | | 9,275 | |
| Long-term debt and other borrowings, net | 413,090 | | | 413,910 | |
| Other long-term liabilities | 11,404 | | | 10,790 | |
| Total liabilities | $ | 511,834 | | | $ | 508,064 | |
| Stockholders’ equity | | | |
Common stock, voting; par value $0.0001 per share; 315,000,000 shares authorized, 76,552,595 and 76,292,241 shares issued and outstanding at March 31, 2023, and December 31, 2022, respectively | $ | 8 | | | $ | 8 | |
| Additional paid-in capital | 437,677 | | | 435,292 | |
| Accumulated other comprehensive loss | (6,262) | | | (6,390) | |
| Accumulated deficit | (266,728) | | | (248,238) | |
| Total stockholders’ equity | 164,695 | | | 180,672 | |
| Total liabilities and stockholders’ equity | $ | 676,529 | | | $ | 688,736 | |
KORE Group Holdings, Inc. and Subsidiaries
Consolidated Statements of Operations (Unaudited)
(In thousands USD, except share and per share amounts)
| | | | | | | | | | | |
| Three Months Ended |
| March 31, |
| 2023 | | 2022 |
| Revenue | | | |
| Services | $ | 47,550 | | | $ | 47,543 | |
| Products | 18,425 | | | 21,435 | |
| Total revenue | 65,975 | | | 68,978 | |
| Cost of revenue | | | |
| Cost of services | 16,543 | | | 17,550 | |
| Cost of products | 13,774 | | | 17,723 | |
| Total cost of revenue (exclusive of depreciation and amortization shown separately below) | 30,317 | | | 35,273 | |
| Operating expenses | | | |
| Selling, general and administrative | 30,200 | | | 27,717 | |
| Depreciation and amortization | 14,125 | | | 13,175 | |
| Total operating expenses | 44,325 | | | 40,892 | |
| Operating loss | (8,667) | | | (7,187) | |
| Interest expense, including amortization of deferred financing costs, net | 10,195 | | | 6,624 | |
| Change in fair value of warrant liability | (3) | | | (27) | |
| Loss before income taxes | (18,859) | | | (13,784) | |
| Income tax benefit | (369) | | | (2,212) | |
| Net loss | $ | (18,490) | | | $ | (11,572) | |
| Loss per share: | | | |
| Basic | $ | (0.24) | | | $ | (0.16) | |
| Diluted | $ | (0.24) | | | $ | (0.16) | |
| Weighted average number of shares outstanding: | | | |
| Basic | 76,524,735 | | | 74,040,261 | |
| Diluted | 76,524,735 | | | 74,040,261 | |
KORE Group Holdings, Inc. and Subsidiaries
Consolidated Statements of Comprehensive Loss (Unaudited)
(In thousands USD)
| | | | | | | | | | | |
| Three Months Ended |
| March 31, |
| 2023 | | 2022 |
| Net loss | $ | (18,490) | | | $ | (11,572) | |
| Other comprehensive loss: | | | |
| Foreign currency translation adjustment | 128 | | | (123) |
| Comprehensive loss | $ | (18,362) | | | $ | (11,695) | |
KORE Group Holdings, Inc. and Subsidiaries
Consolidated Statements of Stockholders’ Equity (Unaudited)
(In thousands USD, except shares)
| | | | | | | | | | | | | | | | | | | | | | | | | | | | | | | | | | | |
| Common Stock | | Additional
Paid-in Capital | | Accumulated
Other
Comprehensive
Loss | | Accumulated
Deficit | | Total
Stockholders’
Equity |
| Shares | | Amount | | Amount | | Amount | | Amount | | Amount |
| Balance at December 31, 2022 | 76,292,241 | | | $ | 8 | | | $ | 435,292 | | | $ | (6,390) | | | $ | (248,238) | | | $ | 180,672 | |
| Foreign currency translation adjustment | — | | | — | | | — | | | 128 | | | — | | | 128 | |
| Stock-based compensation | — | | | — | | | 2,570 | | | — | | | — | | | 2,570 | |
| | | | | | | | | | | |
| Vesting of restricted stock units | 395,067 | | | — | | | — | | | — | | | — | | | — | |
| Shares withheld related to net share settlement | (134,713) | | | — | | | (185) | | | — | | | — | | | (185) | |
| Net loss | — | | | — | | | — | | | — | | | (18,490) | | | (18,490) | |
| Balance at March 31, 2023 | 76,552,595 | | | $ | 8 | | | $ | 437,677 | | | $ | (6,262) | | | $ | (266,728) | | | $ | 164,695 | |
| | | | | | | | | | | |
| | | | | | | | | | | |
| | | | | | | | | | | |
| | | | | | | | | | | |
| | | | | | | | | | | |
| | | | | | | | | | | |
| | | | | | | | | | | |
| | | | | | | | | | | |
| | | | | | | | | | | |
| | | | | | | | | | | | | | | | | | | | | | | | | | | | | | | | | | | |
| Common Stock | | Additional
Paid-in Capital | | Accumulated
Other
Comprehensive
Loss | | Accumulated
Deficit | | Total
Stockholders’
Equity |
| Shares | | Amount | | Amount | | Amount | | Amount | | Amount |
| | | | | | | | | | | |
| | | | | | | | | | | |
Balance at December 31, 2021 | 72,027,743 | | | 7 | | | 401,702 | | | (3,463) | | | (142,038) | | | 256,208 | |
| Foreign currency translation adjustment | — | | | — | | | — | | | (123) | | | — | | | (123) | |
| Stock-based compensation | — | | | — | | | 2,050 | | | — | | | — | | | 2,050 | |
| Common stock issued pursuant to acquisition | 4,212,246 | | | 1 | | | 23,294 | | | — | | | — | | | 23,295 | |
| Net loss | — | | | — | | | — | | | — | | | (11,572) | | | (11,572) | |
Balance at March 31, 2022 | 76,239,989 | | | $ | 8 | | | $ | 427,046 | | | $ | (3,586) | | | $ | (153,610) | | | $ | 269,858 | |
| | | | | | | | | | | |
| | | | | | | | | | | |
| | | | | | | | | | | |
| | | | | | | | | | | |
| | | | | | | | | | | |
| | | | | | | | | | | |
| | | | | | | | | | | |
| | | | | | | | | | | |
| | | | | | | | | | | |
KORE Group Holdings, Inc. and Subsidiaries
Consolidated Statements of Cash Flows (Unaudited)
(In thousands USD)
| | | | | | | | | | | |
| Three Months Ended |
| March 31, |
| 2023 | | 2022 |
| Cash flows from operating activities | | | |
| Net loss | $ | (18,490) | | | $ | (11,572) | |
| Adjustments to reconcile net loss to net cash provided by (used in) operating activities | | | |
| Depreciation and amortization | 14,125 | | | 13,175 | |
| Amortization of deferred financing costs | 625 | | | 587 | |
| Non-cash reduction to the operating lease right-of-use assets | 539 | | | 587 | |
| Deferred income taxes | (1,994) | | | (3,296) | |
| Non-cash foreign currency loss (gain) | (395) | | | (3) | |
| Stock-based compensation | 2,570 | | | 2,050 | |
| Allowance for credit losses | (129) | | | 55 | |
| Change in fair value of warrant liability | (3) | | | (27) | |
| Change in operating assets and liabilities, net of operating assets and liabilities acquired: | | | |
| Accounts receivable | (3,227) | | | (2,635) | |
| Inventories | 1,302 | | | 4,994 | |
| Prepaid expenses and other current assets | 926 | | | 1,591 | |
| Accounts payable and accrued liabilities | 5,589 | | | (8,511) | |
| Deferred revenue | (108) | | | 132 | |
| Income taxes payable | 1,079 | | | (213) | |
| Operating lease liabilities | (496) | | | (894) | |
| Net cash provided by (used in) operating activities | $ | 1,912 | | | $ | (3,980) | |
| Cash flows used in investing activities | | | |
| Additions to intangible assets | (3,814) | | | (2,790) | |
| Additions to property and equipment | (1,025) | | | (635) | |
| Payments for acquisitions, net of cash acquired | — | | | (45,078) | |
| Net cash used in investing activities | $ | (4,839) | | | $ | (48,503) | |
| Cash flows from financing activities | | | |
| | | |
| | | |
| Repayment of term loan | (788) | | | (788) | |
| Repayment of other borrowings—notes payable | (536) | | | (118) | |
| Equity financing fees | — | | | (126) | |
| Payment of deferred financing costs | — | | | (452) | |
| Payment of financing lease obligations | — | | | (66) | |
| Net cash used in financing activities | $ | (1,324) | | | $ | (1,550) | |
| Effect of exchange rate changes on cash | 202 | | | (26) | |
| Change in cash and restricted cash | (4,049) | | | (54,059) | |
| | | | | | | | | | | |
| Cash and restricted cash, beginning of period | 35,007 | | | 86,343 | |
| Cash and restricted cash, end of period | 30,961 | | | 32,284 | |
| Supplemental cash flow information: | | | |
| Interest paid | $ | 11,357 | | | $ | 7,717 | |
| Income taxes paid | 45 | | | 317 | |
| Non-cash investing and financing activities: | | | |
| Fair value of KORE common stock issued pursuant to acquisitions | — | | | 23,295 | |
| ASU 2020-06 Adoption | — | | | 15,163 | |
| Operating lease right-of-use assets obtained in exchange for new operating lease liabilities upon the adoption of ASC 842 | — | | | 9,604 | |
| Operating lease right-of-use assets obtained in exchange for new operating lease liabilities | — | | | 420 | |
KORE Group Holdings, Inc. and Subsidiaries
Notes to the Consolidated Financial Statements (Unaudited)
(In thousands USD, except share and per share amounts)
NOTE 1 – SUMMARY OF SIGNIFICANT ACCOUNTING POLICIES
Basis of Presentation and Principles of Consolidation
The accompanying consolidated financial statements have been prepared in accordance with generally accepted accounting principles in the United States of America (“U.S. GAAP”) and applicable rules and regulations of the Securities and Exchange Commission (“SEC”) regarding interim financial reporting. Certain information and note disclosures normally included in the financial statements prepared in accordance with U.S. GAAP have been condensed or omitted pursuant to such rules and regulations.
KORE Group Holdings, Inc. and its Subsidiaries (“the Company”) use the same accounting policies in preparing quarterly and annual financial statements. Therefore, these consolidated financial statements and accompanying notes should be read in conjunction with the consolidated financial statements and accompanying notes included in the Company’s Annual Report on Form 10-K for the fiscal year ended December 31, 2022.
All significant intercompany balances and transactions have been eliminated. In the opinion of management, the accompanying consolidated financial statements reflect all normal recurring adjustments necessary to present fairly the financial position, results of operations, comprehensive loss, stockholders’ equity, and cash flows for the interim periods but are not necessarily indicative of the results of operations to be anticipated for the full year 2023 or any future period.
Recently Adopted Accounting Pronouncements
The Company considers the applicability and impact of all ASUs issued by the FASB. ASUs not listed below were assessed and determined to be either not applicable or did not have a material impact on the Company's consolidated financial statements. The following ASUs have been adopted by the Company since the Company’s last Annual Report on Form 10-K.
ASU 2016-13, Financial Instruments—Credit Losses: Measurement of Credit Losses on Financial Instruments
The Company adopted ASU 2016-13, on January 1, 2023, utilizing the modified retrospective method. The adoption of ASU 2016-13 modified the measurement of expected credit losses on certain financial instruments such as trade receivables that result from revenue transactions within the scope of ASC 606. The Company adopted ASU 2016-13 utilizing the loss rate method which considers historical loss rates, adjusted for current conditions, and reasonable and supportable forecasts to its trade receivable balances. The adoption of ASU 2016-13 did not have a material impact on the Company’s consolidated financial statements.
ASU 2022-04, Liabilities—Supplier Finance Programs (Topic 405-50) - Disclosure of Supplier Finance Program Obligations
The Company adopted ASU 2022-04, on January 1, 2023, except for the annual roll forward requirement which is effective for fiscal years beginning after December 15, 2023. The standard requires entities that use supplier finance programs to disclose the key terms, including a description of payment terms, the confirmed amount outstanding under the program at the end of each reporting period, a description of where those obligations are presented on the balance sheet, and an annual roll forward, including the amount of obligations confirmed and the amount paid during the period. The guidance does not affect the recognition, measurement, or financial statement presentation of obligations covered by supplier finance programs. See Note 5 for details of the program under the Premium Finance Agreement.
Recently Issued Accounting Pronouncements
The Company considers the applicability and impact of all ASUs issued by the FASB. ASUs not listed here were assessed and determined to be either not applicable or are not expected to have a material impact on the Company's consolidated financial statements.
NOTE 2 – REVENUE
Contract Balances
Deferred revenue primarily relates to revenue that is recognized over time for IoT Connectivity monthly recurring charges, the changes in the balance of which are related to the satisfaction or partial satisfaction of these contracts. The balance also contains a deferral for goods that are in transit at the period end for which control transfers to the customer upon delivery. The deferred revenue balance as of December 31, 2022, was recognized as revenue during the three months ended March 31, 2023.
Disaggregated Revenue Information
The Company has presented the disaggregated disclosures below which are useful to understand the composition of the Company’s revenue during the respective reporting periods shown below:
| | | | | | | | | | | | | | | | | | |
| | Three Months Ended | | |
| (In thousands, USD) | | March 31, | | |
| | 2023 | | 2022 | | | | |
| IoT Connectivity* | | $ | 43,244 | | | $ | 43,053 | | | | | |
| Hardware Sales | | 16,444 | | | 19,012 | | | | | |
| Hardware Sales—bill-and-hold | | 2,197 | | | 2,422 | | | | | |
| Deployment services, professional services, referral services and other | | 4,090 | | | 4,491 | | | | | |
| Total | | $ | 65,975 | | | $ | 68,978 | | | | | |
__________________
*Includes connectivity-related revenues from IoT Connectivity services and IoT Solutions services
Significant Customer
The Company has one customer representing 13.3% and 17.8% of the Company’s total revenue for the three months ended March 31, 2023, and March 31, 2022, respectively.
NOTE 3 – ACQUISITIONS
BMP Business Combination
On February 16, 2022, the Company acquired 100% of the outstanding share capital of Business Mobility Partners, Inc. and Simon IoT LLC ("Simon IoT"), collectively, the “Acquired Companies” or “BMP Acquisition” which are industry-leading mobility service providers, to expand the Company’s services and solutions within the healthcare and life sciences industries (the “BMP Business Combination Agreement”).
The transaction was funded by available cash and the issuance of the Company’s shares. Transaction costs for legal consulting, accounting, and other related costs incurred in connection with the acquisition of the Acquired Companies were $1.7 million. Included in the three months ended March 31, 2022, were $1.4 million of transaction costs, which were included in selling, general and administrative expenses in the Company's consolidated statement of operations.
The following table summarizes the allocation of the consideration transferred for the Acquired Companies, including the identified assets acquired and liabilities assumed as of the acquisition date.
| | | | | | | | |
| (In thousands, USD) | | Fair Value |
Cash, (net of closing cash of $1,995) and working capital adjustments | | $ | 46,002 | |
Fair value of KORE common stock issued to sellers (4,212,246 shares) | | 23,295 | |
Total consideration | | $ | 69,297 | |
| Assets acquired: | | |
| Accounts receivable | | 3,303 | |
| Inventories | | 1,323 | |
| Prepaid expenses and other receivables | | 976 | |
| Property and equipment | | 201 | |
| Intangible assets | | 28,664 | |
Total Assets acquired | | 34,467 | |
| Liabilities assumed: | | |
| Deferred tax liabilities | | 7,391 | |
| Accounts payable and accrued liabilities | | 2,638 | |
Liabilities assumed | | 10,029 | |
Net identifiable assets acquired | | 24,438 | |
Goodwill (excess of consideration transferred over net identifiable assets acquired) | | $ | 44,859 | |
Goodwill represents the future economic benefits that we expect to achieve as a result of the acquisition of the Acquired Companies. A portion of the goodwill resulting from the acquisition is deductible for tax purposes.
The BMP Business Combination Agreement contains customary indemnification terms. Under the BMP Business Combination Agreement, approximately $3.45 million of the cash purchase price was paid at closing and is to be held in escrow, for a maximum of 18 months from the closing date, to guarantee the performance of general representations and warranties regarding closing amounts and to indemnify the Company against any future claims. During the third quarter of 2022, $0.6 million of the $3.45 million was paid to the seller from the escrow account which did not result in any adjustments to the purchase price. The financial results of the Acquired Companies are included in the Company’s consolidated statements of operations from the date of acquisition.
Unaudited pro forma information
Had the acquisition of the Acquired Companies been completed on January 1, 2021, total revenue would have been $74.7 million, and the net loss would have been $9.9 million for the three months ended March 31, 2022.
This unaudited pro forma financial information is not necessarily indicative of what the operating results actually would have been if the acquisition had taken place on January 1, 2022, nor is it indicative of future operating results. The pro forma amounts include the historical operating results of the Company prior to the acquisition, with adjustments factually supportable and directly attributable to the acquisition, primarily related to transaction costs and the amortization of intangible assets.
The pro forma net loss for the three months ended March 31, 2022, reflects a non-recurring adjustment to exclude acquisition-related costs of $1.4 million.
Pending acquisition
On March 26, 2023, the Company entered into an agreement to acquire Twilio's IoT business unit for 10 million shares of the Company's common stock, par value $0.0001. The agreement provides that if 10 million shares of the Company's common stock has an aggregate value in excess of $28 million based on the closing price of the Company's common stock on the business day immediately prior to the date of closing, the Company will issue to
Twilio a number of shares of the Company's common stock having an aggregate value of $28 million based on the closing price of the Company's common stock on the business day immediately prior to the date of closing. Completion of the acquisition is subjected to customary closing conditions and is expected to close in the second quarter of 2023.
NOTE 4 – ACCOUNTS RECEIVABLE
The Company adopted ASU 2016-13 utilizing the loss rate method which considers historical loss rates, adjusted for current conditions, and reasonable and supportable forecasts to its trade receivable balances. The adoption of ASU 2016-13 did not have a material impact on the Company’s consolidated financial statements. The following table shows the details of accounts receivable as of March 31, 2023, and December 31, 2022:
| | | | | | | | | | | | | | |
| (In thousands, USD) | | March 31, 2023 | | December 31, 2022 |
| Accounts receivable | | $ | 48,483 | | | $ | 45,097 | |
| Allowance for credit losses | | (428) | | | (559) | |
Accounts receivable, net | | $ | 48,055 | | | $ | 44,538 | |
The Company requires third-party credit support in certain instances to limit credit risk. The Company generally does not require collateral from its customers.
NOTE 5 – PREMIUM FINANCE AGREEMENT
The Company entered into a Premium Finance Agreement (“Premium Agreement”) on August 3, 2022, to purchase two-year term directors and officers insurance policy. The Premium Agreement is for $3.6 million at a fixed rate of 4.6% per annum, amortized over twenty months. The Premium Agreement requires twenty fixed monthly principal and interest payments of $0.2 million from August 15, 2022, to March 15, 2024.
Included in the Current portion of long-term debt and other borrowings, net is the outstanding principal balance of $2.2 million and $2.8 million as of March 31, 2023, and December 31, 2022, respectively.
NOTE 6 – INCOME TAXES
The Company determines its estimated annual effective tax rate at the end of each interim period based on estimated pre-tax income (loss) and facts known at that time. The estimated annual effective tax rate is applied to the year-to-date pre-tax income (loss) at the end of each interim period with certain adjustments. The tax effects of significant unusual or extraordinary items are reflected as discrete adjustments in the periods in which they occur. The Company’s estimated annual effective tax rate can change based on the mix of jurisdictional pre-tax income (loss) and other factors. However, if the Company is unable to make a reliable estimate of its annual effective tax rate, then the actual effective tax rate for the year-to-date period may be the best estimate. For the three months ended March 31, 2023, and 2022, the Company determined that its annual effective tax rate approach would provide for a reliable estimate and therefore used this method to calculate its tax provision.
The Company’s effective income tax rate was 2.0% and 16.0% for the three months ended March 31, 2023, and 2022, respectively. The effective income tax rate for the three months ended March 31, 2023, and 2022 differed from the federal statutory rate primarily due to the geographical mix of earnings and related foreign tax rate differential, permanent differences, and the valuation allowance maintained against certain deferred tax assets.
The Company’s income tax benefit was $0.4 million and $2.2 million for the three months ended March 31, 2023, and 2022, respectively. The change in the income tax benefit for the three months ended March 31, 2023, compared to the three months ended March 31, 2022, was primarily due to changes in the jurisdictional mix of earnings and the impact of the valuation allowance maintained against certain deferred tax assets.
NOTE 7 – STOCK-BASED COMPENSATION
The following table summarizes Restricted Stock Units (“RSUs”) activities during the reporting period shown below:
| | | | | | | | | | | | | | | | | |
| Number of
awards
outstanding
(in thousands) | | Weighted-
average
grant date
fair value
(per share) | | Aggregate
intrinsic
value
(in thousands) |
| Unvested RSUs at December 31, 2022 | 5,515 | | | $ | 6.69 | | | $ | 34,191 | |
| Granted | 4,230 | | | 1.72 | | | 7,297 | |
| Vested | (395) | | | 6.78 | | | (2,680) | |
| Forfeited and canceled | (123) | | | 6.97 | | | (859) | |
| Unvested RSUs at March 31, 2023 | 9,227 | | | $ | 5.54 | | | $ | 37,949 | |
During the three months ended March 31, 2023, the Company granted 2.1 million RSUs that vest based on the passage of time and granted 2.1 million RSUs that vest based on the achievement of performance targets.
The following is a summary of the Company’s share-based compensation expense and income tax benefit related to the RSUs for the reporting periods shown below:
| | | | | | | | | | | |
| Three Months Ended |
| March 31, |
| (In thousands, USD) | 2023 | | 2022 |
| Total Stock Compensation Expense | $ | 2,570 | | | $ | 2,050 | |
| Income tax benefit related to share-based compensation expense | 246 | | | 264 | |
| | | |
| | | |
As of March 31, 2023, the total unrecognized compensation cost related to outstanding RSUs was $26.3 million, which the Company expects to recognize over a weighted average period of 2.2 years.
NOTE 8 – WARRANTS ON COMMON STOCK
Private Placement Warrants
The private placement warrants are measured quarterly at fair value (Level 1*) based on the closing price of KORE.WS. As of March 31, 2023, 272,779 private placement warrants remained outstanding with an aggregate value of $35.5 thousand based on the closing price of $0.13.
*Fair value estimates are based on quoted prices in active markets for identical assets or liabilities.
NOTE 9 – NET LOSS PER SHARE
Presented in the table below is a reconciliation of the numerator and denominator for the basic and diluted earnings per share (“EPS”) calculations for the periods ended:
| | | | | | | | | | | | | | | | | | |
| | Three Months Ended | | |
| | March 31, | | |
| (In thousands, USD, except share and per share amounts) | | 2023 | | 2022 | | | | |
| Numerator: | | | | | | | | |
| Net loss | | $ | (18,490) | | | $ | (11,572) | | | | | |
| | | | | | | | |
| | | | | | | | |
| | | | | | | | |
| Denominator: | | | | | | | | |
| Weighted average common shares outstanding | | | | | | | | |
| Basic (in number) | | 76,524,735 | | | 74,040,261 | | | | | |
| Diluted (in number) | | 76,524,735 | | | 74,040,261 | | | | | |
| Net loss per unit | | | | | | | | |
| Basic | | $ | (0.24) | | | $ | (0.16) | | | | | |
| Diluted | | $ | (0.24) | | | $ | (0.16) | | | | | |
The following securities were not included in the computation of diluted shares outstanding because the effect would be anti-dilutive:
| | | | | | | | | | | | | | |
| Three Months Ended | |
| (Number of shares) | March 31, | |
| 2023 | | 2022 | | | |
| Common stock issued under the Backstop Agreement | 9,600,031 | | | 9,600,031 | | | | |
| Restricted stock grants with only service conditions | 4,529,117 | | | 3,108,277 | | | | |
| Private placement warrants | 272,779 | | | 272,779 | | | | |
Report of Independent Registered Public Accounting Firm
Shareholders and Board of Directors
KORE Group Holdings, Inc.
Atlanta, Georgia
Opinion on the Consolidated Financial Statements
We have audited the accompanying consolidated balance sheets of KORE Group Holdings, Inc. (the “Company”) as of December 31, 2022 and 2021, the related consolidated statements of operations, comprehensive loss, temporary equity and stockholders’ equity, and cash flows for each of the years then ended, and the related notes and schedule listed in the accompanying index (collectively referred to as the “consolidated financial statements”). In our opinion, the consolidated financial statements present fairly, in all material respects, the financial position of the Company at December 31, 2022 and 2021, and the results of its operations and its cash flows for the years then ended, in conformity with accounting principles generally accepted in the United States of America.
Change in Accounting Principles
As discussed in Note 2 to the consolidated financial statements, the Company has changed its method of accounting for leases as of January 1, 2022, due to the adoption of Accounting Standards Update No. 2016-02, Leases (Topic 842).
As discussed in Note 2 to the consolidated financial statements, the Company has changed its method of accounting for cash conversion features from convertible instruments as of January 1, 2022, due to the adoption of Accounting Standards Update No. 2020-06, Debt—Debt with Conversion and Other Options (Subtopic 470-20) and Derivatives and Hedging— Contracts in Entity’s Own Equity (Subtopic 815-40).
Basis for Opinion
These consolidated financial statements are the responsibility of the Company’s management. Our responsibility is to express an opinion on the Company’s consolidated financial statements based on our audits. We are a public accounting firm registered with the Public Company Accounting Oversight Board (United States) (“PCAOB”) and are required to be independent with respect to the Company in accordance with the U.S. federal securities laws and the applicable rules and regulations of the Securities and Exchange Commission and the PCAOB.
We conducted our audits in accordance with the standards of the PCAOB. Those standards require that we plan and perform the audit to obtain reasonable assurance about whether the consolidated financial statements are free of material misstatement, whether due to error or fraud. The Company is not required to have, nor were we engaged to perform, an audit of its internal control over financial reporting. As part of our audits, we are required to obtain an understanding of internal control over financial reporting but not for the purpose of expressing an opinion on the effectiveness of the Company’s internal control over financial reporting. Accordingly, we express no such opinion.
Our audits included performing procedures to assess the risks of material misstatement of the consolidated financial statements, whether due to error or fraud, and performing procedures that respond to those risks. Such procedures included examining, on a test basis, evidence regarding the amounts and disclosures in the consolidated financial statements. Our audits also included evaluating the accounting principles used and significant estimates made by management, as well as evaluating the overall presentation of the consolidated financial statements. We believe that our audits provide a reasonable basis for our opinion.
/s/ BDO USA, LLP
We have served as the Company's auditor since 2019.
Atlanta, Georgia
April 7, 2023
KORE Group Holdings, Inc. and Subsidiaries
Consolidated Balance Sheets
(In thousands USD, except share and per share amounts)
| | | | | | | | | | | |
| Years Ended |
| December 31,
2022 | | December 31,
2021 |
| Assets | | | |
| Current assets | | | |
| Cash | $ | 34,645 | | | $ | 85,976 | |
| Accounts receivable, net | 44,538 | | | 51,615 | |
| Inventories, net | 10,051 | | | 15,470 | |
| Income taxes receivable | 502 | | | 934 | |
| Prepaid expenses and other current assets | 13,484 | | | 7,363 | |
| Total current assets | 103,220 | | | 161,358 | |
| Non-current assets | | | |
| Restricted cash | 362 | | | 367 | |
| Property and equipment, net | 11,899 | | | 12,240 | |
| Intangibles assets, net | 192,504 | | | 202,550 | |
| Goodwill | 369,706 | | | 383,415 | |
| Operating lease right-of-use assets | 10,019 | | | — | |
| Deferred tax assets | 55 | | | — | |
| Other long-term assets | 971 | | | 407 | |
| Total assets | $ | 688,736 | | | $ | 760,337 | |
| Liabilities and stockholders’ equity | | | |
| Current liabilities | | | |
| Accounts payable | $ | 17,835 | | | $ | 16,004 | |
| Accrued liabilities | 15,793 | | | 22,353 | |
| Income taxes payable | 207 | | | 467 | |
| Current portion of operating lease liabilities | 1,811 | | | — | |
| Deferred revenue | 7,817 | | | 6,889 | |
| Current portion of long-term debt and other borrowings, net | 5,345 | | | 3,326 | |
| Total current liabilities | 48,808 | | | 49,039 | |
| Non-current liabilities | | | |
| Deferred tax liabilities | 25,248 | | | 37,925 | |
| Warrant liability | 33 | | | 286 | |
| Long-term debt and other borrowings, net | 413,910 | | | 399,115 | |
| Non-current portion of operating lease liabilities | 9,275 | | | — | |
| Other long-term liabilities | 10,790 | | | 6,450 | |
| Total liabilities | $ | 508,064 | | | $ | 492,815 | |
Commitments and contingencies (note 12)
See accompanying notes to consolidated financial statements.
KORE Group Holdings, Inc. and Subsidiaries
Consolidated Balance Sheets - Continued
(In thousands USD, except share and per share amounts)
| | | | | | | | | | | |
| December 31,
2022 | | December 31,
2021 |
| Stockholders’ equity | | | |
Common stock, voting; par value $0.0001 per share; 315,000,000 shares authorized, 76,292,241 and 72,027,743 shares issued and outstanding at December 31, 2022 and December 31, 2021 | $ | 8 | | | $ | 7 | |
| Additional paid-in capital | 435,292 | | | 413,315 | |
| Accumulated other comprehensive loss | (6,390) | | | (3,463) | |
| Accumulated deficit | (248,238) | | | (142,337) | |
| Total stockholders’ equity | 180,672 | | | 267,522 | |
| Total liabilities and stockholders’ equity | $ | 688,736 | | | $ | 760,337 | |
See accompanying notes to consolidated financial statements.
KORE Group Holdings, Inc. and Subsidiaries
Consolidated Statements of Operations
(In thousands USD, except share and per share amounts)
| | | | | | | | | | | | |
| Years Ended | |
| December 31,
2022 | | December 31,
2021 | |
| Revenue | | | | |
| Services | $ | 188,985 | | | $ | 188,180 | | |
| Products | 79,462 | | | 60,255 | | |
| Total revenue | 268,447 | | | 248,435 | | |
| Cost of revenue | | | | |
| Cost of services | 67,268 | | | 69,385 | | |
| Cost of products | 61,886 | | | 51,975 | | |
| Total cost of revenue (exclusive of depreciation and amortization shown separately below) | 129,154 | | | 121,360 | | |
| Operating expenses | | | | |
| Selling, general and administrative | 112,220 | | | 92,303 | | |
| Depreciation and amortization | 54,499 | | | 50,331 | | |
| Goodwill impairment | 58,074 | | | — | | |
| Total operating expenses | 224,793 | | | 142,634 | | |
| Operating loss | (85,500) | | | (15,559) | | |
| Interest expense, including amortization of deferred financing costs, net | 31,371 | | | 23,260 | | |
| Change in fair value of warrant liability | (254) | | | (5,267) | | |
| Loss before income taxes | (116,617) | | | (33,552) | | |
| Income tax benefit | (10,417) | | | (8,776) | | |
| Net loss | $ | (106,200) | | | $ | (24,776) | | |
| Loss per share: | | | | |
| Basic | $ | (1.40) | | | $ | (1.04) | | |
| Diluted | $ | (1.40) | | | $ | (1.04) | | |
| Weighted average shares outstanding (in Number): | | | | |
| Basic | 75,710,904 | | | 41,933,050 | | |
| Diluted | 75,710,904 | | | 41,933,050 | | |
See accompanying notes to consolidated financial statements.
KORE Group Holdings, Inc. and Subsidiaries
Consolidated Statements of Comprehensive Loss
(In thousands USD)
| | | | | | | | | | | |
| Years Ended |
| December 31,
2022 | | December 31,
2021 |
| Net loss | $ | (106,200) | | | $ | (24,776) | |
| Other comprehensive loss: | | | |
| Foreign currency translation adjustment | (2,927) | | | (1,901) | |
| Comprehensive loss | $ | (109,127) | | | $ | (26,677) | |
See accompanying notes to consolidated financial statements.
KORE Group Holdings, Inc. and Subsidiaries
Consolidated Statements of Temporary Equity and Stockholders’ Equity
(In thousands, USD, except share amounts)
| | | | | | | | | | | | | | | | | | | | | | | | | | | | | | | | | | | | | | | | | | | | | | | | | | | | | | | | | | | | | | | | | | | | | | | | | | | | | | | | | | | | | | | | | | | | |
| Series A Preferred
Stock | | Series A-1
Preferred Stock | | Series B Preferred
Stock | | Series C Convertible
Preferred Stock | | Total
Temporary
Equity | | | Common Stock | | Additional
paid-in
capital | | Accumulated
Other
Comprehensive
Loss | | Accumulated
Deficit | | Total
Stockholders’
Equity |
| Temporary Equity | | | | | | | | | | | | | |
| Shares | | Amount | | Shares | | Amount | | Shares | | Amount | | Shares | | Amount | | Amount | | | Shares | | Amount | | Amount | | Amount | | Amount | | Amount |
| Balance at December 31, 2020 | 7,756,158 | | | $ | 77,562 | | | 7,862,107 | | | $ | 78,621 | | | 9,090,975 | | | $ | 90,910 | | | 2,520,368 | | | $ | 16,502 | | | $ | 263,595 | | | | 30,281,520 | | | $ | 3 | | | $ | 135,616 | | | $ | (1,562) | | | $ | (117,561) | | | $ | 16,496 | |
| Accrued dividends payable | 765,609 | | | 7,656 | | | 824,076 | | | 8,241 | | | 692,543 | | | 6,925 | | | — | | | — | | | 22,822 | | | | — | | | — | | | (22,822) | | | — | | | — | | | (22,822) | |
| Foreign currency translation adjustment | — | | | — | | | — | | | — | | | — | | | — | | | — | | | — | | | — | | | | — | | | — | | | — | | | (1,901) | | | — | | | (1,901) | |
| Share-based compensation | — | | | — | | | — | | | — | | | — | | | — | | | — | | | — | | | — | | | | 200,426 | | | — | | | (1,856) | | | — | | | — | | | (1,856) | |
| Distributions to and conversions of preferred stock | (8,521,767) | | | (85,218) | | | (8,686,183) | | | (86,862) | | | (9,783,518) | | | (97,835) | | | (2,520,368) | | | (16,502) | | | (286,417) | | | | 7,120,368 | | | 1 | | | 56,502 | | | — | | | — | | | 56,503 | |
CTAC shares recapitalized, net of equity issuance costs of $15,943 | — | | | — | | | — | | | — | | | — | | | — | | | — | | | — | | | — | | | | 10,373,491 | | | 1 | | | 6,428 | | | — | | | — | | | 6,429 | |
| Conversion of KORE warrants | — | | | — | | | — | | | — | | | — | | | — | | | — | | | — | | | — | | | | 1,365,612 | | | — | | | 10,663 | | | — | | | — | | | 10,663 | |
Private offering and merger financing, net of equity issuance costs of $8123 | — | | | — | | | — | | | — | | | — | | | — | | | — | | | — | | | — | | | | 22,686,326 | | | 2 | | | 216,544 | | | — | | | — | | | 216,546 | |
Equity portion of convertible debt, net of deferred financing costs of $384, net of sponsor shares of $683, net of deferred tax liability of $3,999 | — | | | — | | | — | | | — | | | — | | | — | | | — | | | — | | | — | | | | — | | | — | | | 12,240 | | | — | | | — | | | 12,240 | |
| Net loss | — | | | — | | | — | | | — | | | — | | | — | | | — | | | — | | | — | | | | — | | | — | | | — | | | — | | | (24,776) | | | (24,776) | |
| Balance at December 31, 2021 | — | | | — | | | — | | | — | | | — | | | — | | | — | | | — | | | — | | | | 72,027,743 | | | 7 | | | 413,315 | | | (3,463) | | | (142,337) | | | 267,522 | |
| Opening balance sheet adjustment | — | | | — | | | — | | | — | | | — | | | — | | | — | | | — | | | — | | | | — | | | — | | | (11,613) | | | | | 299 | | | (11,314) | |
| Adjusted opening balance | — | | | — | | | — | | | — | | | — | | | — | | | — | | | — | | | — | | | | 72,027,743 | | | 7 | | | 401,702 | | | (3,463) | | | (142,038) | | | 256,208 | |
| Common stock issued pursuant to acquisition | — | | | — | | | — | | | — | | | — | | | — | | | — | | | — | | | — | | | | 4,212,246 | | | 1 | | | 23,294 | | | — | | | — | | | 23,295 | |
| Foreign currency translation adjustment | — | | | — | | | — | | | — | | | — | | | — | | | — | | | — | | | — | | | | — | | | — | | | — | | | (2,927) | | | — | | | (2,927) | |
| Share-based compensation | — | | | — | | | — | | | — | | | — | | | — | | | — | | | — | | | — | | | | — | | | — | | | 10,296 | | — | | | — | | | 10,296 | |
| Vesting of restricted stock units | — | | | — | | | — | | | — | | | — | | | — | | | — | | | — | | | — | | | | 52,252 | | | — | | | — | | | — | | | — | | | — | |
| Net loss | — | | | — | | | — | | | — | | | — | | | — | | | — | | | — | | | — | | | | — | | | — | | | — | | | — | | | (106,200) | | | (106,200) | |
| Balance at December 31, 2022 | — | | | — | | | — | | | — | | | — | | | — | | | — | | | — | | | — | | | | 76,292,241 | | | $ | 8 | | | $ | 435,292 | | | $ | (6,390) | | | $ | (248,238) | | | $ | 180,672 | |
See accompanying notes to consolidated financial statements.
KORE Group Holdings, Inc. and Subsidiaries
Consolidated Statements of Cash Flows
(In thousands USD)
| | | | | | | | | | | |
| For the years ended | December 31,
2022 | | December 31,
2021 |
| Cash flows provided by (used in) operating activities | | | |
| Net loss | $ | (106,200) | | | $ | (24,776) | |
| Adjustments to reconcile net loss to net cash provided (used in) by operating activities | | | |
| Depreciation and amortization | 54,499 | | | 50,331 | |
| Goodwill impairment loss | 58,074 | | | — | |
| Amortization of deferred financing costs | 2,427 | | | 2,097 | |
| Amortization of discount on Backstop Notes | — | | | 424 | |
| Non-cash reduction to the operating lease right-of-use assets | 2,218 | | | — | |
| Deferred income taxes | (16,189) | | | (9,691) | |
| Non-cash foreign currency loss | 14 | | | 344 | |
| Stock-based compensation | 10,296 | | | 4,564 | |
| Provision for doubtful accounts | 415 | | | 322 | |
| Change in fair value of warrant liability | (254) | | | (5,267) | |
| Change in operating assets and liabilities, net of operating assets and liabilities acquired: | | | |
| Accounts receivable | 8,962 | | | (12,102) | |
| Inventories | 6,542 | | | (9,875) | |
| Prepaid expenses and other current assets | (1,992) | | | (1,244) | |
| Accounts payable and accrued liabilities | (2,116) | | | (8,419) | |
| Deferred revenue | 980 | | | (805) | |
| Income taxes payable | 148 | | | (661) | |
| Operating lease liabilities | (1,468) | | | — | |
| Cash provided by (used in) operating activities | $ | 16,356 | | | $ | (14,758) | |
| Cash flows (used in) provided by investing activities | | | |
| Additions to intangible assets | (13,238) | | | (9,247) | |
| Additions to property and equipment | (3,307) | | | (4,172) | |
| Payments for acquisitions, net of cash acquired | (46,002) | | | — | |
| Cash flows (used in) provided by investing activities | $ | (62,547) | | | $ | (13,419) | |
| Cash flows (used in) provided by financing activities | | | |
| Proceeds from revolving credit facility | — | | | 25,000 | |
| Repayment on revolving credit facility | — | | | (25,000) | |
| Repayment of term loan | (3,153) | | | (3,161) | |
| Repayment of other borrowings - notes payable | (1,035) | | | (173) | |
| Proceeds from convertible debt | — | | | 104,167 | |
| Proceeds from equity portion of convertible debt, net of issuance costs | — | | | 15,697 | |
| Payment of deferred financing costs | (356) | | | (1,579) | |
| Repayment of related party note | — | | | (1,538) | |
| Proceeds from CTAC and PIPE financing, net of issuance costs | — | | | 223,688 | |
| Settlements of preferred shares | — | | | (229,915) | |
| Payment of financing lease obligations | (150) | | | — | |
| Payment of capital lease obligations | — | | | (828) | |
| Payment of stock option share employee withholding taxes | — | | | (2,305) | |
| Cash (used in) provided by financing activities | $ | (4,694) | | | $ | 104,053 | |
| Effect of exchange rate change on cash | (451) | | | (226) | |
| Change in Cash and Restricted cash | (51,336) | | | 75,650 | |
| Cash and Restricted Cash, beginning of period | 86,343 | | | 10,693 | |
| Cash and Restricted Cash, end of period | $ | 35,007 | | | $ | 86,343 | |
| Non-cash investing and financing activities: | | | |
| Fair value of KORE common stock issued pursuant to acquisition | 23,295 | | | — | |
| ASU 2020-06 Adoption | 15,163 | | | — | |
| Operating lease right-of-use assets obtained in exchange for new operating lease liabilities upon the adoption of ASC 842 | 9,604 | | | — | |
| Operating lease right-of-use assets obtained in exchange for new operating lease liabilities | 3,409 | | | — | |
| Premium finance agreement | 3,621 | | | — | |
| Equity financing fees accrued | — | | | 3,602 | |
| Common shares issued to preferred shareholders | — | | | 56,502 | |
| Equity financing fees settled in common shares | — | | | 1,863 | |
| Common shares issued to warrant holders | — | | | 10,663 | |
| Common shares issued to option holders pursuant to the Cancellation Agreements | — | | | 1,072 | |
| Sponsor shares distributed to lender under Backstop Agreement | — | | | 683 | |
| Supplemental cash flow information: | | | — | |
| Interest paid | 29,199 | | | 19,874 | |
| Taxes paid (net of refunds) | 2,119 | | | 957 | |
See accompanying notes to consolidated financial statements.
KORE Group Holdings, Inc. and Subsidiaries
Notes to Consolidated Financial Statements
(In thousands USD, except share and per share amounts)
NOTE 1 - NATURE OF OPERATIONS
Business Combination
On March 12, 2021, Maple Holdings Inc. (“Maple” or “pre-combination KORE”) entered into a definitive merger agreement (the “Business Combination”) with Cerberus Telecom Acquisition Corp. (NYSE: CTAC). On September 29, 2021, CTAC held a special meeting, at which CTAC’s shareholders voted to approve the proposals outlined in the proxy statement filed by CTAC with the Securities Exchange Commission (the “SEC”) on August 13, 2021, including, among other things, the adoption of the Business Combination and approval of the other transactions contemplated by the merger agreement.
On September 30, 2021 (the “Closing Date”), as contemplated by the merger agreement, (i) CTAC merged with and into King LLC Merger Sub, LLC (“LLC Merger Sub”) (the “Pubco Merger”), with LLC Merger Sub being the surviving entity of the Pubco Merger and King Pubco, Inc. (“Pubco”) as parent of the surviving entity, (ii) immediately prior to the First Merger (as defined below), Cerberus Telecom Acquisition Holdings, LLC (the “Sponsor”) contributed 100% of its equity interests in King Corp Merger Sub, Inc. (“Corp Merger Sub”) to Pubco (the “Corp Merger Sub Contribution”), as a result of which Corp Merger Sub became a wholly owned subsidiary of Pubco, (iii) following the Corp Merger Sub Contribution, Corp Merger Sub merged with and into Maple (the “First Merger”), with Maple being the surviving corporation of the First Merger, and (iv) immediately following the First Merger and as part of the same overall transaction as the First Merger, Maple merged with and into LLC Merger Sub (the “Second Merger” and, together with the First Merger, being collectively referred to as the “Mergers” and, together with the other transactions contemplated by the merger agreement, the “Transactions” and the Closing of the Transactions, the Business Combination), with LLC Merger Sub being the surviving entity of the Second Merger and Pubco being the sole member of LLC Merger Sub. In connection with the Business Combination, Pubco changed its name to “KORE Group Holdings, Inc.” (the “Company”). The combined Company remained listed on the NYSE under the new ticker symbol “KORE”.
The Business Combination was accounted for as a reverse recapitalization whereby pre-combination KORE was determined to be the accounting acquirer and CTAC was treated as the “acquired” company for accounting purposes. The Business Combination was accounted as the equivalent of pre-combination KORE issuing stock for the net assets of CTAC, accompanied by a recapitalization whereby pre-combination KORE was determined to be the accounting acquirer.
The consolidated balance sheets, statements of operations and statements of temporary equity and stockholders’ equity and these notes to the consolidated financial statements reflect the reverse recapitalization as discussed above. Reported shares and earnings per share available to common stockholders, prior to the Business Combination, have been retroactively restated to reflect the exchange ratio established in the merger agreement. The number of shares of preferred stock was also retroactively restated based on the exchange ratio.
Organization
The Company provides advanced connectivity services, location-based services, device solutions, managed and professional services used in the development and support of IoT technology for the Machine-to-Machine (“M2M”) market. The Company’s IoT platform is delivered in partnership with the world’s largest mobile network operators and provides secure, reliable wireless connectivity to mobile and fixed devices. This technology enables the Company to expand its global technology platform by transferring capabilities across new and existing vertical markets and delivers complimentary products to channel partners and resellers worldwide.
The Company has operating subsidiaries located in Australia, Belgium, Brazil, Canada, Dominican Republic, Ireland, Malta, Mexico, the Netherlands, New Zealand, Switzerland, the United Kingdom and the United States. The Company’s consolidated financial statements (the “consolidated financial statements”) reflect its financial statements and those of its wholly owned subsidiaries.
NOTE 2 – SUMMARY OF SIGNIFICANT ACCOUNTING POLICIES
Basis of Presentation
The Company’s consolidated financial statements are expressed in U.S. dollars and have been prepared in accordance with accounting principles generally accepted in the United States of America (“US GAAP”). Intercompany balances and transactions were eliminated upon consolidation. The preparation of consolidated financial statements in conformity with US GAAP requires management to make use of estimates and assumptions that affect the reported amounts and disclosures.
The Business Combination was accounted for as a reverse recapitalization as pre-combination KORE was determined to be the accounting acquirer under Financial Accounting Standard Board's ("FASB") ASC Topic 805, Business Combination (“ASC 805”). Pre-combination KORE was determined to be the accounting acquirer based on the evaluation of the following facts and circumstances:
•the equity holders of pre-combination KORE held the majority (54%) of voting rights in the Company;
•the senior management of pre-combination KORE became the senior management of the Company;
•in comparison with CTAC, pre-combination KORE has significantly more revenues and total assets and a larger net loss; and,
•the operations of pre-combination KORE comprise the ongoing operations of the Company, and the Company assumed pre-Combination KORE’s headquarters.
Accordingly, for accounting purposes, the financial statements of the Company represent a continuation of the financial statements of pre-combination KORE with the acquisition being treated as the equivalent of pre-combination KORE issuing stock for the net assets of CTAC, accompanied by a recapitalization. The net assets of CTAC were stated at historical cost, with no goodwill or other intangible assets recorded. Pre-combination KORE was deemed to be the predecessor and the consolidated assets and liabilities and results of operations prior to September 30, 2021 are those of pre-combination KORE. Reported shares and earnings per share available to common stockholders, prior to the Business Combination, have been retroactively restated to reflect the exchange ratio established in the merger agreement. The number of shares of preferred stock was also retroactively restated based on the exchange ratio.
Foreign Currency
The functional currency of the Company’s foreign subsidiaries is generally the local currency. Any transactions recorded in the Company’s foreign subsidiaries denominated in a currency other than the local currency are remeasured using current exchange rates each reporting period with the resulting unrealized gains or losses being included in selling, general and administrative expenses in the consolidated statements of operations.
For consolidation purposes, all assets and liabilities denominated in a foreign currency are translated into U.S. dollars at the exchange rate on the balance sheet date. Revenues and expenses are translated at the average exchange rate during the period. Equity transactions are translated using historical exchange rates. Adjustments resulting from translating foreign functional currency financial statements into U.S. dollars are recorded as part of a separate component of stockholders’ equity and reported in the consolidated statements of comprehensive loss.
Segments
Operating segments are defined as components of an entity for which separate financial information is available and that is regularly reviewed by the CODM in deciding how to allocate resources to the individual segment and in assessing performance. The Company’s CODM is its Chief Executive Officer. The Company has determined that it operates in one operating segment and one reportable segment, as the CODM reviews financial information presented on a consolidated basis for purposes of making operating decisions, allocating resources, and evaluating financial performance.
Use of Estimates
The preparation of consolidated financial statements, in conformity with US GAAP, requires management to make estimates and assumptions that affect the reported amounts of assets and liabilities, and disclosure of contingent assets and liabilities at the date of the consolidated financial statements relate to the following; (1) revenue recognition such as determining the nature and timing of the satisfaction of performance obligations, (2) revenue reserves, (3) allowances for accounts receivable, (4) inventory obsolescence, (5) the measurement of assets acquired and liabilities assumed in business combinations at fair value, (6) assessment of indicators of goodwill impairment and the determination of the fair value of the Company’s reporting unit, (7) determination of useful lives of the Company’s intangible assets and equipment, (8) the assessment of expected cash flows used in evaluating long-lived assets for impairment, (9) the calculation of capitalized software costs, and (10) accounting for uncertainties in income tax positions. Although these estimates are based on management’s best knowledge of current events and actions that the Company may undertake in the future, actual results may be different from these estimates.
Revenue Recognition
We recognize revenue under ASC 606, Revenue from Contracts with Customers by apply the following steps: (1) identify the contract with a customer; (2) identify the performance obligations in the contract; (3) determine the transaction price; (4) allocate the transaction price to the performance obligations in the contract; and (5) recognize revenue when, or as, the Company satisfies a performance obligation. Payments are generally due and received within 30-60 days from the point of billing customers.
The Company derives revenues primarily from IoT Connectivity and IoT Solutions. Connectivity arrangements provide customers with secure and reliable wireless connectivity to mobile and fixed devices through various mobile network carriers. Revenue from IoT Connectivity consists of monthly recurring charges (“MRC’s”) and overage/usage charges, and contracts are generally short-term in nature (i.e., month-to-month arrangements). Revenue for MRC’s and overage/usage charges are recognized over time as the Company satisfies the performance obligation (generally starting when an enrolled device is activated on the Company’s platform). Most of the MRC’s are billed monthly in advance (generally in the last week of a month); any amounts billed for which the service has not been provided as of the balance sheet dates are reported as a contract liability and components of deferred revenue. Overage/usage charges are billed in arrears on a monthly cycle. Overage/usage charges are evaluated on a monthly basis, and any overage/usage charges determined by management as unlikely to be collected due to a customer disputing the charge or due to a concession are reserved. Reserved items are written off when deemed uncollectible or recognized as revenue if collected. Certain IoT Connectivity customers also have the option to purchase products and/or equipment (e.g. subscriber identification module or “SIM” cards, routers, phones, or tablets) from the Company on an as needed basis. Product sales to IoT Connectivity customers are recognized when control is transferred to the customer, which is typically upon shipment of the product.
IoT Solutions arrangements include device solutions (including connectivity), deployment services, and/or technology-related professional services. Management evaluates each IoT Solutions arrangement to determine the contract for accounting purposes. If a contract contains more than one performance obligation, consideration is allocated to each performance obligation based on standalone selling prices (“SSPs”). When available, the Company uses observable prices to determine SSPs. When observable prices are not available, SSPs are established that reflect the Company's best estimates of what the selling price of the performance obligations would be if they were sold regularly on a stand-alone basis. The Company's process for estimating SSPs without observable prices consider multiple factors that may vary depending upon the unique facts and circumstances related to each performance obligation including, where applicable, prices charged by the Company for similar offerings, market trends in the pricing for similar offerings, product-specific business objectives and the estimated cost to provide the performance obligation. Hardware, deployment services, and connectivity services generally have readily observable prices. The standalone selling price of our warehouse management services (which is associated with our bill-and-hold inventory and determined to be immaterial as discussed below) was determined using a cost-plus-margin approach with the primary assumptions including Company profit objectives, internal cost structure, and current market trends. Device and other hardware sales in IoT Solutions arrangements are generally accounted for as separate contracts since the customer is not obligated to purchase additional services when committing to the purchase of any
products. Such sales are typically recognized upon shipment to the customer. However, in certain contracts, the customer has requested the Company to hold the products ordered for later shipment to the customer’s remote location or to the customer’s end user as a part of a vendor managed inventory model. In these situations, management has concluded that transfer of control to the customer occurs prior to shipment. In these “bill-and-hold” arrangements, the right to invoice, transfer of legal title and transfer of the risk and rewards associated with the products occurs when the Company receives the hardware from a third-party vendor and has deemed it to be functional. Additionally, the products are identified both physically and systematically as belonging to a specific customer, are usable by the customer, and are only shipped, used, or disposed as directed by the specific customer. Based on these factors, management recognizes revenue on bill-and-hold hardware when the hardware is received by the Company and deemed functional. As part of the bill-and-hold arrangements, the Company performs a service related to the storage of the hardware. The Company has determined that any storage fee related to bill-and-hold inventory is immaterial to the consolidated financial statements taken as a whole.
Deployment services consist of the Company preparing hardware owned by a customer for use by a customer’s end user. Deployment and connectivity may both be included within a single IoT Solutions contract and are considered separate performance obligations. While consideration for deployment services is generally fixed when ordered by the client, consideration for connectivity services is variable and solely related to the connectivity services. Therefore, the fixed consideration is allocated to the deployment services and is recognized as revenue when the services are provided (i.e. when the related hardware is shipped to the customer). Connectivity within IoT Solutions contracts are recognized similar to the IoT Connectivity as described above, since such contracts are generally short term in nature and variability is resolved each month as the services are provided.
Professional services are generally provided over a contract term of one to two months. Revenue is recognized over time on an input method basis (typically, based on hours completed to date and an estimate of total hours to complete the project).
There are no material instances where variable consideration is constrained and not recorded at the initial time of sale. Product returns are recorded as a reduction to revenue based on anticipated sales returns that occur in the normal course of business and are immaterial for the years ended December 31, 2022, and 2021. The Company primarily has assurance-type warranties that do not result in separate performance obligations.
The Company does not have material unfulfilled performance obligation balances for contracts with an original length greater than one year in any of the years presented. Additionally, the Company does not have material costs related to obtaining a contract with amortization periods greater than one year for any of the years presented.
Overage usage charges are evaluated on a monthly basis, and any overage/usage charges determined by management as unlikely to be collected due to a customer disputing the charge or due to a concession are reserved in the month billed and are not initially recognized as revenue. These amounts are netted against accounts receivable and reversed when credited to the customer account, generally no longer than one to two months after initial billing.
The Company applies ASC 606 utilizing the following allowable exemptions or practical expedients:
•Exemption to not disclose the unfulfilled performance obligation balance for contracts with an original length of one year or less.
•Practical expedient to recognize the incremental costs of obtaining a contract as an expense when incurred if the amortization period of the asset that the entity otherwise would have recognized is one year or less.
•Election to present revenue net of sales taxes and other similar taxes.
•Election from recognizing shipping and handling activities as a separate performance obligation.
•Practical expedient not requiring the entity to adjust the promised amount of consideration for the effects of a significant financing component if the entity expects, at contract inception, that the period between when the entity transfers a promised good or service to a customer and when the customer pays for that good or service will be one year or less.
Restricted Cash
Restricted cash represents cash deposits held with financial institutions for letters of credit and is not available for general corporate purposes.
Concentrations of Credit Risk and Off-Balance-Sheet Risk
Cash is a financial instrument that is potentially subject to concentrations of credit risk. The Company’s cash is deposited in accounts at large financial institutions, and amounts may exceed federally insured limits. The Company believes it is not exposed to significant credit risk due to the financial strength of the depository institutions in which the cash is held. The Company has no other financial instruments with off-balance-sheet risk of loss.
Accounts Receivable, Net of Allowance for Doubtful Accounts
The carrying amount of accounts receivable is reduced by a valuation allowance that reflects management’s best estimate of the amounts that will not be collected. Management reviews all accounts receivable balances that exceed terms from the invoice date individually, and based on an assessment of current creditworthiness, past payment history, and historical loss experience, and provides an allowance for the portion, if any, of the balance not expected to be collected. All accounts or portions thereof considered uncollectible or require excessive collection costs are written off to the allowance for doubtful accounts and recorded under selling, general and administrative expense in the consolidated statements of operations.
Inventories
The Company records its inventory, which primarily consists of finished goods such as SIM cards, other hardware and packaging materials, using the first-in, first-out method, except for certain legacy acquisition that use weighted average cost method to account for approximately 14% of the total consolidated inventory. Certain items in inventory require limited assembly procedures to be performed before shipping the items to customers. Due to the insignificant nature and cost associated with the assembly procedures, the Company classifies these items as finished goods. Inventories are stated at the lower of cost or net realizable value. The Company performs ongoing evaluations and maintains a reserve if necessary for slow-moving and obsolete items, based upon factors surrounding the inventory age, amount of inventory on hand and projected sales.
Property and Equipment
The Company’s property and equipment primarily consist of computer hardware and software, networking equipment as well as furniture and fixtures. Property and equipment are recorded at cost and are depreciated over their estimated useful lives using the declining-balance method at the following annual rates:
| | | | | |
| Computer hardware and software | 30 | % |
| Networking equipment | 20 | % |
| Furniture and fixtures | 20 | % |
Maintenance, repairs, and ordinary replacements are recorded under selling, general and administrative expenses in the consolidated statement of operations as incurred. Expenditures for improvements that extend the physical or economic life of the property are capitalized. Leasehold improvements are depreciated using the straight-line method over the shorter of the estimated useful life or the remaining term of the lease. The Company includes computer software in property and equipment as the software is integral to enabling the functioning of the hardware.
Leases
At the beginning of the first quarter of fiscal 2022, the Company adopted the FASB Accounting Standards Update (“ASU”) No. 2016-02, Leases (Topic 842) (“ASU 2016-02”), and additional ASUs issued to clarify and update the guidance in ASU 2016-02 (collectively, the “new leases standard”).
The Company leases real estate, computer hardware and vehicles for use in our operations under both operating and finance leases. The Company assesses whether an arrangement is a lease or contains a lease at inception. For arrangements considered leases or that contain a lease that is accounted for separately, we determine the classification and initial measurement of the right-of-use asset and lease liability at the lease commencement date, which is the date that the underlying asset becomes available for use.
For both operating and finance leases, we recognize a right-of-use asset, which represents our right to use the underlying asset for the lease term, and a lease liability, which represents the present value of our obligation to make payments arising over the lease term. The present value of our obligation to make payments is calculated using the incremental borrowing rate for operating and finance leases. The incremental borrowing rate is determined using a portfolio approach based on the rate of interest that the Company would have to pay to borrow an amount equal to the lease payments on a collateralized basis over a similar term. Management uses the unsecured borrowing rate and risk-adjusts that rate to approximate a collateralized rate, which will be updated on an annual basis for the measurement of new lease liabilities.
In those circumstances where the Company is the lessee, we have elected to account for non-lease components associated with our leases (e.g., common area maintenance costs) and lease components as a single lease component for all of our asset classes.
Operating lease cost for operating leases is recognized on a straight-line basis over the term of the lease and is included in selling, general and administrative expense in our consolidated statements of operations, based on the use of the facility on which rent is being paid. Operating leases with a term of 12 months or less are not recorded on the balance sheet; we recognize a rent expense for these leases on a straight-line basis over the lease term.
The Company recognizes the amortization of the right-of-use asset for our finance leases on a straight-line basis over the shorter of the term of the lease or the useful life of the right-of-use asset in depreciation and amortization expense in our consolidated statements of operations. The interest expense related to finance leases is recognized using the effective interest method based on the discount rate determined at lease commencement and is included within interest expense in our consolidated statements of operations.
Internal Use Software
Certain costs of platform and software applications developed for internal use are capitalized as intangible assets. Capitalization of costs begins when two criteria are met: (i) the preliminary project stage is completed (i.e. application development stage) and (ii) it is probable that the software will be completed and used for its intended function. The Company also capitalizes costs related to specific upgrades and enhancements when it is probable the expenditure will result in additional functionality. Costs incurred for maintenance, minor upgrades and enhancements are recorded under selling, general and administrative expenses in the consolidated statement of operations as incurred. Costs related to preliminary project activities and post-implementation operating activities are also recorded under selling, general and administrative expenses in the consolidated statement of operations as incurred. The Company amortizes the capitalized costs on a straight-line basis over the useful life of the asset. Refer to “Note 9, Goodwill and Other Intangible Assets” to the consolidated financial statements, for further detail of the Company’s average useful lives for capitalized internal use computer software.
Business Combinations
The Company allocates the fair value of the consideration transferred to the assets acquired and liabilities assumed based on their fair values at the acquisition date. The excess of the fair value of consideration transferred over the fair value of the assets acquired, and liabilities assumed is recorded as goodwill. Acquisition-related expenses and restructuring costs are recognized separately from the business combination and expensed as incurred. All changes in accounting for deferred tax asset valuation allowances and acquired income tax uncertainties after the measurement period are recognized as a component of provision for income taxes. When determining the fair values of assets acquired and liabilities assumed, management makes significant estimates and assumptions, especially with respect to intangible assets. Critical estimates in valuing intangible assets include expected future cash flows based on consideration of future growth rates and margins, customer attrition rates, future changes in technology and brand awareness and discount rates. Fair value estimates are based on the assumptions management believes a market
participant would use in pricing the asset or liability. While the Company uses its best estimates and assumptions as a part of the purchase price allocation process to accurately value assets acquired and liabilities assumed as of the acquisition date, its estimates and assumptions are inherently uncertain and subject to refinement. As a result, during the preliminary purchase price measurement period, which may be up to one year from the acquisition date, the Company records adjustments to the provisional amounts recognized at the acquisition date to reflect new information obtained about facts and circumstances that existed as of the acquisition date, with a corresponding offset to goodwill. The Company records adjustments to assets acquired or liabilities assumed subsequent to the preliminary purchase price measurement period in its operating results in the period in which the adjustments were determined.
Fair Value Measurements
The Company applies the provisions of ASC 820, Fair Value Measurements, for fair value measurements of financial assets and financial liabilities and for fair value measurements of non-financial items that are recognized or disclosed at fair value in the financial statements on a recurring basis. The Company also applied the provisions of the subtopic to fair value measurements of non-financial assets and non-financial liabilities that are recognized or disclosed at fair value in the financial statements on a non-recurring basis. The subtopic defines fair value as the price that would be received to sell an asset or paid to transfer a liability in an orderly transaction between market participants at the measurement date. The subtopic also establishes a framework for measuring fair value and expands disclosures about fair value measurements. The fair value framework requires the Company to categorize certain assets and liabilities into three levels, based upon the assumptions used to price those assets or liabilities. The three levels are defined as follows:
Level 1.Quoted prices in active markets for identical assets or liabilities.
Level 2.Quoted prices for similar assets and liabilities in active markets or inputs that are observable.
Level 3.Unobservable inputs reflecting management’s own assumptions about the inputs used in pricing the asset or liability.
The Company has determined the estimated fair value of its financial instruments based on appropriate valuation methodologies; however, considerable judgment is required to develop these estimates. Accordingly, these estimated fair values are not necessarily indicative of the amounts the Company could realize in a current market exchange. The estimated fair values can be materially affected by using different assumptions or methodologies. The methods and assumptions used in estimating the fair values of financial instruments are based on carrying values and future cash flows.
Cash is stated at cost, which approximates fair value. The carrying amounts reported in the balance sheet for accounts receivable, accounts payable, and accrued liabilities approximate fair value, due to their short-term maturities.
Long-term debt is carried at amortized cost using the effective interest rate method. The Company’s outstanding borrowings are not required to be measured at fair value at the end of each reporting period. The carrying and fair values of the Company’s outstanding borrowings are disclosed at the end of each reporting period in “Note 10 – Long Term Debt and Other Borrowings, net” to the consolidated financial statements.
The Notes under the Backstop agreement, are carried at amortized cost using the effective interest rate method and is disclosed in “Note 10 – Long Term Debt and Other Borrowings, net” to the consolidated financial statements.
The Company has outstanding private warrants (“Private Warrants”) issued for the purchase of common stock, which are liability-classified. The Private Warrants are marked to fair value using the fair value of the Company's public warrants that trade on the NYSE, therefore are evaluated as Level 2 for fair value as disclosed in “Note 14 - Warrants on Common Stock” to the consolidated financial statements.
Stock-Based Compensation
The Company has had several stock-based compensation plans, which are more fully described in “Note 13 - Stock-Based Compensation”, to the consolidated financial statements. Stock-based compensation is generally recognized as an expense following the straight-line attribution method over the requisite service period. The fair value of stock-based compensation is measured on the grant date based on the grant-date fair value of the awards using the lattice model.
Intangible Assets
Identifiable intangible assets acquired individually or as part of a group of other assets are initially recognized and measured at cost. The cost of a group of intangible assets acquired in a transaction, including those acquired in a business combination that meet the specified criteria for recognition apart from goodwill, is the sum of the individual assets acquired based on their acquisition date fair values. The cost incurred to enhance the service potential of an intangible asset is capitalized as a betterment.
Identifiable intangible assets comprise assets that have a definite life amortized on a straight-line basis over their estimated useful lives as follows:
| | | | | |
| Customer relationships | 10-13 years |
| Technology | 5-9 years |
| Carrier contracts | 10 years |
| Trademarks | 9-10 years |
| Internally developed computer software | 3-5 years |
The Company capitalizes costs directly related to the design, deployment and enhancements of its internal operating support systems, including employee-related costs.
Goodwill
Goodwill represents the excess fair value of consideration transferred over the fair value of the net identifiable assets acquired in a business combination. Goodwill is evaluated annually on October 1st for impairment or more frequently if impairment indicators are present. A qualitative assessment is performed to determine whether the existence of events or circumstances leads to a determination that it is more likely than not the fair value of the reporting unit is less than its carrying amount. Qualitative factors considered are macroeconomics conditions such as geographical location and fluctuations in foreign exchange, industry and market conditions, financial performance including both profitability and cash flows from operations, entity-specific events and share price trends. If, based on the qualitative assessment, it is determined that it is more likely than not the fair value of the reporting unit is less than its carrying amount, then a quantitative test is performed and an impairment loss is recognized in an amount equal to the excess of the carrying value over the fair value of the reporting unit, limited to the total amount of goodwill allocated to that reporting unit. Under a quantitative test, the Company obtains a third-party valuation of the fair value of the reporting unit. Assumptions used in the fair value calculation include revenue growth and profitability, terminal values, discount rates, and implied control premium. These assumptions are consistent with those the Company believes hypothetical marketplace participants would use.
Deferred Financing Costs
Deferred financing costs consist principally of debt issuance costs which are being amortized using the effective interest method over the terms of the related debt agreements and are presented in the consolidated balance sheets as direct deductions from long-term debt. Issuance costs for credit facilities are recorded in other long-term assets in the consolidated balance sheets and are amortized over the term of the agreement using the straight-line method.
Defined Contribution Plans
The Company sponsors defined contribution plans (the “Plans”) that cover our domestic and international employees following the completion of an eligibility period. Under the Plans, participating employees may defer a portion of their pretax earnings up to the limits provided by local statutory requirements. The Company makes matching contributions, subject to limits of the base compensation that a participant contributes to the Plan. The Company’s matching contributions vest over up to a maximum of four years from the participant’s date of hire. The Company records its portion of matching contributions as an expense within the selling, general and administrative financial statement line item. The Company contributed in aggregate $0.5 million, and $0.4 million for fiscal years 2022 and 2021, respectively.
Impairment of Long-Lived Assets
The Company reviews long-lived assets, such as property and equipment, and purchased intangibles subject to amortization, for impairment whenever events or changes in circumstances indicate that the carrying amount of an asset may not be recoverable. The recoverability of assets to be held and used is measured by a comparison of the carrying amount of an asset to the estimated undiscounted future cash flows expected to be generated by the asset. If the carrying amount of an asset exceeds its estimated future cash flows, an impairment charge is recognized for the amount by which the carrying amount of the asset exceeds the fair value of the asset. Assets to be disposed of by sale would be separately presented in the consolidated balance sheet and reported at the lower of the carrying amount or fair value less costs to sell and are no longer depreciated. The assets and liabilities of a group classified as held for sale would be presented separately in the appropriate asset and liability sections of the consolidated balance sheet. There were no assets classified as held for sale at any of the balance sheet dates presented.
Income Taxes
The Company provides for income taxes under the asset and liability method. Deferred tax assets and liabilities are recognized for the future tax consequences attributable to differences between the financial statement carrying amounts of existing assets and liabilities and their respective tax bases. Deferred tax assets and liabilities are measured using enacted tax rates expected to apply to taxable income in the years in which those temporary differences are expected to be recovered or settled. The Company recognized the effect of income tax positions only if those positions are more likely than not to be sustained. Recognized income tax positions are measured at the largest amount that is greater than 50% likely to be realized. The effect on deferred tax assets and liabilities of a change in tax rates is recognized in income in the year that includes the date of enactment. A valuation allowance is recorded to reduce deferred tax assets to an amount, which, in the opinion of management, is more likely than not to be realized. The Company considers factors such as the cumulative income or loss in recent years; reversal of deferred tax liabilities; projected future taxable income exclusive of temporary differences; the character of the income tax asset, including income tax positions; tax planning strategies and other factors in the determination of the valuation allowance.
Earnings (Loss) Per Share
The Company calculates basic and diluted earnings/(loss) per common share. Basic earnings/(loss) per share is calculated by dividing earnings/(loss) for the period by the weighted-average common shares outstanding for the period including outstanding KORE warrants. Diluted earnings/(loss) per share includes the effect of dilutive instruments and uses the average share price for the period in determining the number of shares that are to be added to the weighted-average number of shares outstanding. Cumulative dividends on preferred shares were subtracted from net income/(loss) to arrive at earnings/(loss) attributable to common stockholders.
In periods of net income, the Company allocates net income to the common shares under the two-class method for the unvested share-based payment awards that contain participating rights to dividends or dividend equivalents (whether paid or unpaid). Because the share-based awards do not have an obligation to fund losses, they are not included in the calculation during periods of losses because their effect would be antidilutive.
Reclassifications in the consolidated financial statements
Certain reclassifications have been made to the 2021 consolidated financial statements to conform to the 2022 presentation for leases. These reclassifications did not have a significant impact in the consolidated financial statements presented.
Comprehensive Loss and Accumulated Other Comprehensive Loss
The Company has included the consolidated statements of comprehensive loss in the accompanying consolidated financial statements, which include the effects of foreign currency translation adjustments relating to the Company's foreign operations. No amounts have been reclassified out of Accumulated Other Comprehensive Loss for the years ended December 31, 2022, and 2021.
Emerging Growth Company
Section 102(b)(1) of the JOBS Act exempts emerging growth companies from being required to comply with new or revised financial accounting standards until private companies are required to comply with the new or revised financial accounting standards. The Company qualifies as an “Emerging Growth Company” and has elected to use the extended transition period for complying with new or revised accounting standards under Section 102(b)(1) of the JOBS Act. This election allows the Company to adopt new or revised standards at the same time as private companies.
Recently Adopted Accounting Pronouncements
The Company considers the applicability and impact of all ASUs issued by the FASB. ASUs not listed below were assessed and determined to be either not applicable or did not have a material impact on the Company's consolidated financial statements. The following ASUs have been adopted by the Company during the fiscal year 2022:
ASU 2016-02, ASU 2018-10, ASU 2018-11, ASU 2020-03 and ASU 2020-05, Leases (Topic 842)
In February 2016, the FASB issued ASU 2016-02, Leases, to increase transparency and comparability among organizations by recognizing lease assets and lease liabilities on the balance sheet and disclosing key information about leasing arrangements. In July 2018, ASU 2018-10, Codification Improvements to ASC 2016-02, Leases, was issued to provide more detailed guidance and additional clarification for implementing ASU 2016-02. Furthermore, in July 2018, the FASB issued ASU 2018-11, Leases: Targeted Improvements, which provides an optional transition method in addition to the existing modified retrospective transition method by allowing a cumulative effect adjustment to the opening balance of retained earnings in the period of adoption. Furthermore, on June 3, 2020, the FASB deferred by one year the effective date of the new leases standard for private companies, private not-for-profits and public not-for-profits that have not yet issued (or made available for issuance) financial statements reflecting the new standard. Additionally, in March 2020, ASU 2020-03, Codification Improvements to Financial Instruments, Leases, was issued to provide more detailed guidance and additional clarification for implementing ASU 2016-02. Furthermore, in June 2020, ASU 2020-05, Revenue from Contracts with Customers and Leases, was issued to defer effective dates of adoption of the new leasing standard beginning after December 15, 2021, and interim periods within fiscal years beginning after December 15, 2022. These new leasing standards (collectively “ASC 842” or “the new standard”) are effective for the Company beginning after December 15, 2021, and interim periods within fiscal years beginning after December 15, 2022, with early adoption permitted.
A modified retrospective transition approach is required, applying the new standard to all leases existing at the date of initial application. We early adopted the new standard on January 1, 2022, which is the date of our initial application. Consequently, financial information will not be updated, and the disclosures required under the new standard will not be provided for dates and periods ending before January 1, 2022.
The cumulative after-tax effect of the changes made to our consolidated balance sheet for the adoption of ASC 842 were as follows:
| | | | | | | | | | | | | | | | | | | | |
| (In thousands, USD) | | At December 31, 2021 | | Adjustments due to ASC 842 | | At January 1
2022 |
| Operating lease right-of-use assets | | $ | — | | | $ | 9,278 | | | $ | 9,278 | |
| Current portion of operating lease liabilities | | — | | | 2,121 | | | 2,121 | |
| Non-current portion of operating lease liabilities | | — | | | 7,483 | | | 7,483 | |
| Current portion of capital lease liabilities included in Accrued liabilities | | 191 | | | (191) | | | — | |
| Current portion of finance lease liabilities included in Accrued liabilities | | — | | | 191 | | | 191 | |
| Non-current portion of capital lease liabilities included in Other long-term liabilities | | 264 | | | (264) | | | — | |
| Non-current portion of finance lease liabilities included in Other long-term liabilities | | — | | | 264 | | | 264 | |
| Accrued liabilities | | 22,353 | | | (326) | | | 22,027 | |
In addition to the increase to the operating lease liabilities and right-of-use assets, ASC 842 also resulted in reclassifying the presentation of accrued liabilities and deferred rent to operating lease right-of-use assets.
We elected the package of practical expedients permitted under the transition guidance within the new standard. Accordingly, we have adopted these practical expedients and did not reassess: (1) whether an expired or existing contract is a lease or contains an embedded lease; (2) lease classification of an expired or existing lease; or (3) capitalization of initial direct costs for an expired or existing lease.
See Note 8 for additional information related to leases, including disclosure required under ASC 842.
ASU 2020-06, Debt—Debt with Conversion and Other Options (Subtopic 470-20) and Derivatives and Hedging— Contracts in Entity’s Own Equity (Subtopic 815-40)
In August 2020, the FASB issued ASU 2020-06, Debt—Debt with Conversion and Other Options (Subtopic 470-20) and Derivatives and Hedging— Contracts in Entity’s Own Equity (Subtopic 815-40) (“ASU 2020-06”) to simplify accounting for certain financial instruments. ASU 2020-06 eliminates the current models that require separation of beneficial conversion and cash conversion features from convertible instruments and simplifies the derivative scope exception guidance pertaining to equity classification of contracts in an entity’s own equity. The new standard also introduces additional disclosures for convertible debt and freestanding instruments that are indexed to and settled in an entity’s own equity. ASU 2020-06 amends the diluted earnings per share guidance, including the requirement to use the if-converted method for all convertible instruments. ASU 2020-06 is effective for fiscal years, and interim periods within those fiscal years, beginning after December 15, 2023. Early adoption is permitted for fiscal years (including interim periods) beginning after December 15, 2020.
The Company early adopted ASU 2020-06 on January 1, 2022, using a modified retrospective transition approach. Consequently, financial information will not be updated, and the disclosures required under the new standard will not be provided for dates and periods ending before January 1, 2022. Refer to “Note 10 –Long-Term Debt and Other Borrowings”, to the consolidated financial statements for further detail.
The cumulative after-tax effect of the changes made to our consolidated balance sheet for the adoption of ASU 2020-06 were as follows:
| | | | | | | | | | | | | | | | | | | | |
| (In thousands, USD) | | At December 31, 2021 | | Adjustments due to ASU 2020-06 | | At January 1,
2022 |
| Long-term debt and other borrowings, net | | $ | 399,115 | | | $ | 15,163 | | | $ | 414,278 | |
| Additional paid-in capital | | 413,315 | | | (11,613) | | | 401,702 | |
| Deferred tax liabilities | | 37,925 | | | (3,849) | | | 34,076 | |
| Accumulated deficit | | (142,337) | | | 299 | | | (142,038) | |
ASU 2021-04, Issuer’s Accounting for Certain Modifications or Exchanges of Freestanding Equity-Classified Written Call Options
In May 2021, the FASB issued ASU 2021-04, Issuer’s Accounting for Certain Modifications or Exchanges of Freestanding Equity-Classified Written Call Options, which provides guidance on modifications or exchanges of a freestanding equity-classified written call option that is not within the scope of another Topic. An entity should treat a modification of the terms or conditions or an exchange of a freestanding equity-classified written call option that remains equity classified after modification or exchange as an exchange of the original instrument for a new instrument and provides further guidance on measuring the effect of a modification or an exchange of a freestanding equity-classified written call option that remains equity classified after modification or exchange. ASU 2021-04 also provides guidance on the recognition of the effect of a modification or an exchange of a freestanding equity-classified written call option that remains equity classified after modification or exchange on the basis of the substance of the transaction, in the same manner as if cash had been paid as consideration. ASU 2021-04 was effective for the Company beginning on January 1, 2022, and we will apply the amendments prospectively through December 31, 2022. There was no impact on our consolidated financial statements as a result of adopting this standard update.
ASU 2020-04, Reference Rate Reform: Facilitation of the Effects of Reference Rate Reform on Financial Reporting
In March 2020, the FASB issued ASU 2020-04, Reference Rate Reform: Facilitation of the Effects of Reference Rate Reform on Financial Reporting, to provide guidance on easing the potential burden in accounting for reference rate reform on financial reporting. ASU 2020-04 is effective from March 12, 2020 and may be applied prospectively through December 31, 2024. ASU 2020-04 was effective for the Company beginning on December 22, 2022. There was no impact on our consolidated financial statements as a result of adopting this standard update.
Recently Issued Accounting Pronouncements
The Company considers the applicability and impact of all ASUs issued by the FASB. ASUs not listed below were assessed and determined to be either not applicable or are not expected to have a material impact on the Company's consolidated financial statements.
ASU 2016-13, Financial Instruments—Credit Losses: Measurement of Credit Losses on Financial Instruments
In June 2016, the FASB issued ASU 2016-13, Financial Instruments - Credit Losses: Measurement of Credit Losses on Financial Instruments, which requires the use of a new current expected credit loss (“CECL”) model in estimating allowances for doubtful accounts with respect to accounts receivable and notes receivable. Receivables from revenue transactions, or trade receivables, are recognized when the corresponding revenue is recognized under ASC 606, Revenue from Contracts with Customers. The CECL model requires that the Company estimate its lifetime expected credit loss with respect to these receivables and record allowances when deducted from the balance of the receivables, which represent the estimated net amounts expected to be collected. Given the generally short-term nature of trade receivables, the Company does not expect to apply a discounted cash flow methodology. However, the Company will consider whether historical loss rates are consistent with expectations of forward-looking estimates for its trade receivables. In November 2018, the FASB issued ASU 2018-19, Codification
Improvements to Topic 326, Financial Instruments—Credit Losses to clarify that operating lease receivables recorded by lessors are explicitly excluded from the scope of ASU 2016-13. This ASU (collectively “ASC 326”) is effective for fiscal years beginning after December 15, 2022, and interim periods within those fiscal years. The Company does not expect adoption of this ASU to have a material impact in the consolidated financial statements.
ASU 2020-03, Codification Improvements to Financial Instruments
In March 2020, the FASB issued ASU 2020-03, Codification Improvements to Financial Instruments, which clarifies specific issues raised by stakeholders. Specifically, the ASU:
•Clarifies that all entities are required to provide the fair value option disclosures in ASC 825, Financial Instruments.
•Clarifies that the portfolio exception in ASC 820, Fair Value Measurement, applies to nonfinancial items accounted for as derivatives under ASC 815, Derivatives and Hedging.
•Clarifies that for purposes of measuring expected credit losses on a net investment in a lease in accordance with ASC 326, Financial Instruments - Credit Losses, the lease term determined in accordance with ASC 842, Leases, should be used as the contractual term.
•Clarifies that when an entity regains control of financial assets sold, it should recognize an allowance for credit losses in accordance with ASC 326.
•Aligns the disclosure requirements for debt securities in ASC 320, Investments - Debt Securities, with the corresponding requirements for depository and lending institutions in ASC 942, Financial Services - Depository and Lending.
The amendments in the ASU have various effective dates and transition requirements, some depending on whether an entity has previously adopted ASU 2016-13 about measurement of expected credit losses. The Company will adopt the guidance in ASU 2020-03 as it adopts the related ASU affected by these codification improvements.
NOTE 3 – REVISION OF PREVIOUSLY REPORTED CONSOLIDATED FINANCIAL STATEMENTS
In connection with the Company’s review of our intercompany transfer pricing methodology, and in preparation of finalizing the consolidated financial statements for the year ended December 31, 2022, the Company identified errors in its historical financial statements relating to income taxes and indirect taxes.
The Company assessed the materiality of these errors along with other immaterial errors from previous reviews and annual audits in 2021, and 2022 under ASC 250, “Accounting Changes and Error Corrections,” Staff Accounting Bulletin No. 99, “Materiality,” and Staff Accounting Bulletin No. 108, “Considering the Effects of Prior Year Misstatements when Quantifying Misstatements in Current Year Financial Statements” and concluded that the annual consolidated financial statements for the year ended December 31, 2021, and the unaudited interim consolidated financial statements for the first three quarters of 2021, and 2022 were not materially misstated but should be revised. The amounts and disclosures included in this Form 10-K have been revised to reflect the correct presentation.
Income Tax Adjustments
In connection with a review of the Company’s intercompany transfer pricing methodology, we determined that the Company should have recorded income tax expense related to an uncertain tax position associated with certain intercompany balances between our legal entities in several domestic and foreign jurisdictions. Management has concluded that we have an income tax exposure on a consolidated basis which resulted in an understatement of income tax expense and other long-term liabilities for the following amount:
•For the year ended December 31, 2021 - $0.7 million.
•First quarter of 2021 - $0.2 million.
•Second quarter of 2021 - $0.2 million.
•Third quarter of 2021 - $0.3 million.
•First quarter of 2022 - $0.4 million.
•Second quarter of 2022 - $0.4 million.
•Third quarter of 2022 - $0.8 million.
Indirect Tax Adjustments
As part of our fourth quarter 2022 financial statement close process, we determined that the Company should have accrued a liability relating to a historical indirect tax exposure on customer invoices in two subsidiaries within the same foreign jurisdiction. The error resulted in the Company understating selling, general, and administrative expenses and other long-term liabilities for the following amount:
•For the year ended December 31, 2021 - $0.5 million.
•For each of the three quarters of 2021 - $0.1 million.
•For each of the three quarters of 2022 - $0.1 million.
Other Adjustments
In addition to the income tax and indirect tax errors discussed above, management has decided to revise our financial statements to reflect several immaterial errors identified in prior year audits and quarterly reviews. These immaterial errors relate to the following:
•Customer billing error resulted in an understatement of revenue and account receivable of approximately $0.05 million for each of the quarters in 2021 and 2022 and $0.22 million for the year ended December 31, 2021.
•A misallocation of the purchase price relating to a prior business combination resulted in an overstatement of intangible assets and an understatement of goodwill, which resulted in an overstatement of intangible asset amortization expense of $0.02 million for each of the quarters in 2021 and 2022 and $0.08 million for the year ended December 31, 2021.
•Initial public offering costs of $1.4 million should have been expensed in the quarter ended March 31, 2021 instead of the quarter ended June 30, 2021. We inappropriately capitalized such cost as of March 31, 2021.
•Revenue of $0.6 million should have been recognized in the quarter ended June 30, 2022 instead of the quarter ended September 30, 2022.
•Tax effect on pre-tax book loss resulting in either an understatement/overstatement of income tax expense/(benefit) and other long-term liabilities for the following periods:
•For the year ended December 31, 2021 - $0.19 million.
•First quarter of 2021 - ($0.23) million.
•Second quarter of 2021 - $0.69 million.
•Third quarter of 2021 - ($0.46) million.
•First quarter of 2022 - ($0.04) million.
•Second quarter of 2022 - $0.14 million.
•Third quarter of 2022 - ($0.07) million.
•Several immaterial cutoff errors between quarters related to revenue, cost of sales, and selling, general & administrative expenses.
The following tables present the impact of the revisions on our annual consolidated financial statements for the year ended December 31, 2021, including the impact to the accumulated other comprehensive income (loss) and the accumulated deficit balances as of December 31, 2020. The revised unaudited interim consolidated financial statements are included in Note 17 to the consolidated financial statements.
KORE Group Holdings, Inc. and Subsidiaries
Consolidated Balance Sheets
(In thousands USD, except share and per share amounts)
| | | | | | | | | | | | | | | | | | | | | | | | | | | | | |
| December 31, 2021 |
| As previously reported | | Income tax adjustments | | Indirect tax adjustments | | Other adjustments* | | As revised |
| Assets | | | | | | | | | |
| Current assets | | | | | | | | | |
| Cash | $ | 85,976 | | | — | | | — | | | — | | | $ | 85,976 | |
| Accounts receivable, net | 51,304 | | | — | | | — | | | 311 | | | 51,615 | |
| Inventories, net | 15,470 | | | — | | | — | | | — | | | 15,470 | |
| Income taxes receivable | 954 | | | — | | | — | | | (20) | | | 934 | |
| Prepaid expenses and other receivables | 7,448 | | | — | | | — | | | (85) | | | 7,363 | |
Total current assets | 161,152 | | | — | | | — | | | 206 | | | 161,358 | |
| Non-current assets | | | | | | | | | |
| Restricted cash | 367 | | | — | | | — | | | — | | | 367 | |
| Property and equipment, net | 12,240 | | | — | | | — | | | — | | | 12,240 | |
| Intangibles assets, net | 203,474 | | | — | | | — | | | (924) | | | 202,550 | |
| Goodwill | 381,962 | | | — | | | — | | | 1,453 | | | 383,415 | |
| Other long-term assets | 407 | | | — | | | — | | | — | | | 407 | |
Total assets | $ | 759,602 | | | $ | — | | | $ | — | | | $ | 735 | | | $ | 760,337 | |
| Liabilities and stockholders’ equity | | | | | | | | | |
| Current liabilities | | | | | | | | | |
| Accounts payable | $ | 16,004 | | | — | | | — | | | — | | | $ | 16,004 | |
| Accrued liabilities | 21,311 | | | — | | | — | | | 1,042 | | | 22,353 | |
| Income taxes payable | 467 | | | — | | | — | | | — | | | 467 | |
| Current portion of capital lease obligations | 191 | | | — | | | — | | | (191) | | | — | |
| Deferred revenue | 6,889 | | | — | | | — | | | — | | | 6,889 | |
| Current portion of long-term debt and other borrowings, net | 3,326 | | | — | | | — | | | — | | | 3,326 | |
Total current liabilities | 48,188 | | | — | | | — | | | 851 | | | 49,039 | |
| Non-current liabilities | | | | | | | | | |
| Deferred tax liabilities | 36,722 | | | 1,435 | | | — | | | (232) | | | 37,925 | |
| Warrant liability | 286 | | | — | | | — | | | — | | | 286 | |
| Capital lease obligations | 264 | | | — | | | — | | | (264) | | | — | |
| Long-term debt and other borrowings, net | 399,115 | | | — | | | — | | | — | | | 399,115 | |
| Other long-term liabilities | 2,884 | | | 1,994 | | | 1,257 | | | 315 | | | 6,450 | |
Total liabilities | $ | 487,459 | | | $ | 3,429 | | | $ | 1,257 | | | $ | 670 | | | $ | 492,815 | |
| Stockholders’ equity | | | | | | | | | |
Common stock, voting; par value $0.0001 per share; 315,000,000 shares authorized, 72,027,743 shares issued and outstanding at December 31, 2021 | $ | 7 | | | — | | | — | | | — | | | $ | 7 | |
| Additional paid-in capital | 413,646 | | | — | | | — | | | (331) | | | 413,315 | |
| Accumulated other comprehensive loss | (3,331) | | | (46) | | | — | | | (86) | | | (3,463) | |
| Accumulated deficit | (138,179) | | | (3,383) | | | (1,257) | | | 482 | | | (142,337) | |
Total stockholders’ equity | 272,143 | | | (3,429) | | | (1,257) | | | 65 | | | 267,522 | |
Total liabilities and stockholders’ equity | $ | 759,602 | | | $ | — | | | $ | — | | | $ | 735 | | | $ | 760,337 | |
__________________
*Certain reclassifications have been made to the 2021 consolidated balance sheet to conform to the 2022 presentation for leases.
KORE Group Holdings, Inc. and Subsidiaries
Consolidated Statements of Operations
(In thousands USD, except share and per share amounts)
| | | | | | | | | | | | | | | | | | | | | | | | | | | | | |
| December 31, 2021 |
| As previously reported | | Income tax adjustments | | Indirect tax adjustments | | Other Adjustments | | As Revised |
| Revenue | | | | | | | | | |
| Services | $ | 187,962 | | | $ | — | | | $ | — | | | $ | 218 | | | $ | 188,180 | |
| Products | 60,255 | | | — | | | — | | | — | | | 60,255 | |
Total revenue | 248,217 | | | — | | | — | | | 218 | | | 248,435 | |
| Cost of revenue | | | | | | | | | |
| Cost of services | 69,867 | | | — | | | — | | | (482) | | | 69,385 | |
| Cost of products | 52,357 | | | — | | | — | | | (382) | | | 51,975 | |
Total cost of revenue (exclusive of depreciation and amortization shown separately below) | 122,224 | | | — | | | — | | | (864) | | | 121,360 | |
Operating expenses | | | | | | | | | — | |
| Selling, general and administrative | 91,733 | | | — | | | 457 | | | 113 | | | 92,303 | |
| Depreciation and amortization | 50,414 | | | — | | | — | | | (83) | | | 50,331 | |
Total operating expenses | 142,147 | | | — | | | 457 | | | 30 | | | 142,634 | |
Operating loss | (16,154) | | | — | | | (457) | | | 1,052 | | | (15,559) | |
| Interest expense, including amortization of deferred financing costs, net | 23,260 | | | — | | | — | | | — | | | 23,260 | |
| Change in fair value of warrant liability | (5,267) | | | — | | | — | | | — | | | (5,267) | |
Loss before income taxes | (34,147) | | | — | | | (457) | | | 1,052 | | | (33,552) | |
| Income tax expense (benefit) | (9,694) | | | 732 | | | — | | | 186 | | | (8,776) | |
Net loss | $ | (24,453) | | | $ | (732) | | | $ | (457) | | | $ | 866 | | | $ | (24,776) | |
| Loss per share: | | | | | | | | | |
| Basic | $ | (1.03) | | | $ | (0.02) | | | $ | (0.01) | | | $ | 0.02 | | | $ | (1.04) | |
| Diluted | $ | (1.03) | | | $ | (0.02) | | | $ | (0.01) | | | $ | 0.02 | | | $ | (1.04) | |
| Weighted average shares outstanding (in Number): | | | | | | | | | |
| Basic | 41,933,050 | | | — | | | — | | | — | | | 41,933,050 | |
| Diluted | 41,933,050 | | | — | | | — | | | — | | | 41,933,050 | |
KORE Group Holdings, Inc. and Subsidiaries
Consolidated Statements of Comprehensive Loss
(In thousands USD)
| | | | | | | | | | | | | | | | | | | | | | | | | | | | | |
| December 31, 2021 |
| As previously reported | | Income tax adjustments | | Indirect tax adjustments | | Other Adjustments | | As Revised |
Net loss | $ | (24,453) | | | $ | (732) | | | $ | (457) | | | $ | 866 | | | $ | (24,776) | |
| Other comprehensive income (loss): | | | | | | | | | |
| Foreign currency translation adjustment | (1,654) | | | 53 | | | — | | | (300) | | | (1,901) | |
Comprehensive loss | $ | (26,107) | | | $ | (679) | | | $ | (457) | | | $ | 566 | | | $ | (26,677) | |
KORE Group Holdings, Inc. and Subsidiaries
Consolidated Statements of Temporary Equity and Stockholders’ Equity
(In thousands, USD, except share amounts)
| | | | | | | | | | | | | | | | | | | | | | | | | | | | | | | | | | | | | | | | | | | | | | | | | | | | | | | | | | | | | | | | | | | | | | | | | | | | | | | | | | | | | | | | | | | | |
| Series A Preferred
Stock | | Series A-1
Preferred Stock | | Series B Preferred
Stock | | Series C Convertible
Preferred Stock | | Total Temporary Equity | | | Common Stock | | Additional paid-in capital | | Accumulated
Other
Comprehensive
Income (Loss) | | Accumulated
Deficit | | Total
Stockholders’
Equity |
| Temporary Equity | | | |
| Shares | | Amount | | Shares | | Amount | | Shares | | Amount | | Shares | | Amount | | Amount | | | Shares | | Amount | | Amount | | Amount | | Amount | | Amount |
| As Reported | | | | | | | | | | | | | | | | | | | | | | | | | | | | | | |
| Balance at December 31, 2020 | 7,756,158 | | | $ | 77,562 | | | 7,862,107 | | | $ | 78,621 | | | 9,090,975 | | | $ | 90,910 | | | 2,566,186 | | | $ | 16,802 | | | $ | 263,895 | | | | 30,281,520 | | | $ | 3 | | | $ | 135,616 | | | $ | (1,677) | | | $ | (113,726) | | | $ | 20,216 | |
| Derecognition of shares | — | | | — | | | — | | | — | | | — | | | — | | | (45,818) | | | (300) | | | (300) | | | | — | | | — | | | — | | | — | | | — | | | — | |
| Accrued dividends payable | 765,609 | | | 7,656 | | | 824,076 | | | 8,241 | | | 692,543 | | | 6,925 | | | — | | | — | | | 22,822 | | | | — | | | — | | | (22,822) | | | — | | | — | | | (22,822) | |
| Foreign currency translation adjustment | — | | | — | | | — | | | — | | | — | | | — | | | — | | | — | | | — | | | | — | | | — | | | — | | | (1,654) | | | — | | | (1,654) | |
| Share-based compensation | — | | | — | | | — | | | — | | | — | | | — | | | — | | | — | | | — | | | | 200,426 | | | — | | | (1,856) | | | — | | | — | | | (1,856) | |
| Distributions to and conversions of preferred stock | (8,521,767) | | | (85,218) | | | (8,686,183) | | | (86,862) | | | (9,783,518) | | | (97,835) | | | (2,520,368) | | | (16,502) | | | (286,417) | | | | 7,120,368 | | | 1 | | | 56,502 | | | — | | | — | | | 56,503 | |
CTAC shares recapitalized, net of equity issuance costs of $15,943 | — | | | — | | | — | | | — | | | — | | | — | | | — | | | — | | | — | | | | 10,373,491 | | | 1 | | | 6,428 | | | — | | | — | | | 6,429 | |
| Conversion of KORE warrants | — | | | — | | | — | | | — | | | — | | | — | | | — | | | — | | | — | | | | 1,365,612 | | | — | | | 10,663 | | | — | | | — | | | 10,663 | |
Private offering and merger financing, net of equity issuance costs of $8123 | — | | | — | | | — | | | — | | | — | | | — | | | — | | | — | | | — | | | | 22,686,326 | | | 2 | | | 216,875 | | | — | | | — | | | 216,877 | |
Equity portion of convertible debt, net of deferred financing costs of $384, net of sponsor shares of $683, net of deferred tax liability of $3,999 | — | | | — | | | — | | | — | | | — | | | — | | | — | | | — | | | — | | | | — | | | — | | | 12,240 | | | — | | | — | | | 12,240 | |
| Net loss | — | | | — | | | — | | | — | | | — | | | — | | | — | | | — | | | — | | | | — | | | — | | | — | | | — | | | (24,453) | | | (24,453) | |
| Balance at December 31, 2021 | — | | | $ | — | | | — | | | $ | — | | | — | | | $ | — | | | — | | | $ | — | | | $ | — | | | | 72,027,743 | | | $ | 7 | | | $ | 413,646 | | | $ | (3,331) | | | $ | (138,179) | | | $ | 272,143 | |
| Adjustments | | | | | | | | | | | | | | | | | | | | | | | | | | | | | | |
| Balance, December 31, 2020 | — | | | — | | | — | | | — | | | — | | | — | | | (45,818) | | | (300) | | | (300) | | | | — | | | — | | | — | | | 115 | | | (3,835) | | | (3,720) | |
| Derecognition of shares | — | | | — | | | — | | | — | | | — | | | — | | | 45,818 | | | 300 | | | 300 | | | | — | | | — | | | — | | | — | | | — | | | — | |
| Foreign currency translation adjustment | — | | | — | | | — | | | — | | | — | | | — | | | — | | | — | | | — | | | | — | | | — | | | — | | | (247) | | | — | | | (247) | |
| Private offering and merger financing | — | | | — | | | — | | | — | | | — | | | — | | | — | | | — | | | — | | | | — | | | — | | | (331) | | | — | | | — | | | (331) | |
| Net loss | — | | | — | | | — | | | — | | | — | | | — | | | — | | | — | | | — | | | | — | | | — | | | — | | | — | | | (323) | | | (323) | |
| Total Adjustments | — | | | — | | | — | | | — | | | — | | | — | | | — | | | — | | | — | | | | — | | | — | | | $ | (331) | | | $ | (132) | | | $ | (4,158) | | | $ | (4,621) | |
| As Revised | | | | | | | | | | | | | | | | | | | | | | | | | | | | | | |
| Balance at December 31, 2020 | 7,756,158 | | | 77,562 | | | 7,862,107 | | | 78,621 | | | 9,090,975 | | | 90,910 | | | 2,520,368 | | | 16,502 | | | 263,595 | | | | 30,281,520 | | | 3 | | | 135,616 | | | (1,562) | | | (117,561) | | | 16,496 | |
| Derecognition of shares | — | | | — | | | — | | | — | | | — | | | — | | | — | | | — | | | — | | | | — | | | — | | | — | | | — | | | — | | | — | |
| Accrued dividends payable | 765,609 | | | 7,656 | | | 824,076 | | | 8,241 | | | 692,543 | | | 6,925 | | | — | | | — | | | 22,822 | | | | — | | | — | | | (22,822) | | | — | | | — | | | (22,822) | |
| Foreign currency translation adjustment | — | | | — | | | — | | | — | | | — | | | — | | | — | | | — | | | — | | | | — | | | — | | | — | | | (1,901) | | | — | | | (1,901) | |
| | | | | | | | | | | | | | | | | | | | | | | | | | | | | | | | | | | | | | | | | | | | | | | | | | | | | | | | | | | | | | | | | | | | | | | | | | | | | | | | | | | | | | | | | | | | |
| Share-based compensation | — | | | — | | | — | | | — | | | — | | | — | | | — | | | — | | | — | | | | 200,426 | | | — | | | (1,856) | | | — | | | — | | | (1,856) | |
| Distributions to and conversions of preferred stock | (8,521,767) | | | (85,218) | | | (8,686,183) | | | (86,862) | | | (9,783,518) | | | (97,835) | | | (2,520,368) | | | (16,502) | | | (286,417) | | | | 7,120,368 | | | 1 | | | 56,502 | | | — | | | — | | | 56,503 | |
CTAC shares recapitalized, net of equity issuance costs of $15,943 | — | | | — | | | — | | | — | | | — | | | — | | | — | | | — | | | — | | | | 10,373,491 | | | 1 | | | 6,428 | | | — | | | — | | | 6,429 | |
| Conversion of KORE warrants | — | | | — | | | — | | | — | | | — | | | — | | | — | | | — | | | — | | | | 1,365,612 | | | — | | | 10,663 | | | — | | | — | | | 10,663 | |
Private offering and merger financing, net of equity issuance costs of $8123 | — | | | — | | | — | | | — | | | — | | | — | | | — | | | — | | | — | | | | 22,686,326 | | | 2 | | | 216,544 | | | — | | | — | | | 216,546 | |
Equity portion of convertible debt, net of deferred financing costs of $384, net of sponsor shares of $683, net of deferred tax liability of $3,999 | — | | | — | | | — | | | — | | | — | | | — | | | — | | | — | | | — | | | | — | | | — | | | 12,240 | | | — | | | — | | | 12,240 | |
| Net loss | — | | | — | | | — | | | — | | | — | | | — | | | — | | | — | | | — | | | | — | | | — | | | — | | | — | | | (24,776) | | | (24,776) | |
| Balance at December 31, 2021 | — | | | $ | — | | | — | | | $ | — | | | — | | | $ | — | | | — | | | $ | — | | | $ | — | | | | 72,027,743 | | | $ | 7 | | | $ | 413,315 | | | $ | (3,463) | | | $ | (142,337) | | | $ | 267,522 | |
KORE Group Holdings, Inc. and Subsidiaries
Consolidated Statements of Cash Flows
(In thousands USD)
| | | | | | | | | | | | | | | | | | | | | | | | | | | | | |
| December 31, 2021 |
| As previously reported | | Income tax adjustments | | Indirect tax adjustments | | Other adjustments | | As Revised |
| Cash flows from operating activities | | | | | | | | | |
| Net loss | $ | (24,453) | | | $ | (732) | | | $ | (457) | | | $ | 866 | | | $ | (24,776) | |
| Adjustments to reconcile net loss to net cash (used in) provided by operating activities | | | | | | | | | |
| Depreciation and amortization | 50,414 | | | — | | | — | | | (83) | | | 50,331 | |
| Amortization of deferred financing costs | 2,097 | | | — | | | — | | | — | | | 2,097 | |
| Amortization of discount on Backstop Notes | 424 | | | — | | | — | | | — | | | 424 | |
| Deferred income taxes | (9,871) | | | 323 | | | | | (143) | | | (9,691) | |
| Non-cash foreign currency loss | 344 | | | — | | | — | | | — | | | 344 | |
| Share-based compensation | 4,564 | | | — | | | — | | | — | | | 4,564 | |
| Provision for doubtful accounts | 322 | | | — | | | — | | | — | | | 322 | |
| Change in fair value of warrant liability | (5,267) | | | — | | | — | | | — | | | (5,267) | |
| Change in operating assets and liabilities, net of operating assets and liabilities acquired: | | | | | | | | | |
| Accounts receivable | (11,884) | | | — | | | — | | | (218) | | | (12,102) | |
| Inventories | (9,875) | | | — | | | — | | | — | | | (9,875) | |
| Prepaid expenses and other receivables | (1,700) | | | — | | | — | | | 456 | | | (1,244) | |
| Accounts payable and accrued liabilities | (8,371) | | | 409 | | | 457 | | | (914) | | | (8,419) | |
| Deferred revenue | (805) | | | — | | | — | | | — | | | (805) | |
| Income taxes payable | (697) | | | — | | | — | | | 36 | | | (661) | |
| Cash used in operating activities | $ | (14,758) | | | $ | — | | | $ | — | | | $ | — | | | $ | (14,758) | |
| Cash flows used in investing activities | | | | | | | | | |
| Additions to intangible assets | (9,247) | | | — | | | — | | | — | | | (9,247) | |
| Additions to property and equipment | (4,172) | | | | | | | | | (4,172) | |
Net cash (used) in investing activities | $ | (13,419) | | | $ | — | | | $ | — | | | $ | — | | | $ | (13,419) | |
| Cash flows from financing activities | | | | | | | | | |
| Proceeds from revolving credit facility | 25,000 | | | — | | | — | | | — | | | 25,000 | |
| Repayment on revolving credit facility | (25,000) | | | — | | | — | | | — | | | (25,000) | |
| Repayment of term loan | (3,161) | | | — | | | — | | | — | | | (3,161) | |
| Repayment of other borrowings - notes payable | (173) | | | — | | | — | | | — | | | (173) | |
| Proceeds from convertible debt | 104,167 | | | — | | | — | | | — | | | 104,167 | |
| Proceeds from equity portion of convertible debt, net of issuance costs | 15,697 | | | — | | | — | | | — | | | 15,697 | |
| Payment of deferred financing costs | (1,579) | | | — | | | — | | | — | | | (1,579) | |
| Repayment of related party note | (1,538) | | | — | | | — | | | — | | | (1,538) | |
| | | | | | | | | | | | | | | | | | | | | | | | | | | | | |
| December 31, 2021 |
| As previously reported | | Income tax adjustments | | Indirect tax adjustments | | Other adjustments | | As Revised |
| Proceeds from CTAC and PIPE financing, net of issuance costs | 223,688 | | | — | | | — | | | — | | | 223,688 | |
| Settlements of preferred shares | (229,915) | | | — | | | — | | | — | | | (229,915) | |
| Payment of capital lease obligations | (828) | | | — | | | — | | | — | | | (828) | |
| Payment of stock option share employee withholding taxes | (2,305) | | | — | | | — | | | — | | | (2,305) | |
Cash provided by/(used in) financing activities | $ | 104,053 | | | $ | — | | | $ | — | | | $ | — | | | $ | 104,053 | |
| Effect of Exchange Rate Change on Cash | (226) | | | — | | | — | | | — | | | (226) | |
| Change in Cash and Restricted Cash | 75,650 | | | — | | | — | | | — | | | 75,650 | |
Cash and Restricted Cash, beginning of period | 10,693 | | | — | | | — | | | — | | | 10,693 | |
Cash and Restricted Cash, end of period | $ | 86,343 | | | $ | — | | | $ | — | | | $ | — | | | $ | 86,343 | |
Non-cash investing and financing activities: | | | | | | | | | |
| Equity financing fees accrued | $ | 3,602 | | | $ | — | | | $ | — | | | $ | — | | | $ | 3,602 | |
| Common shares issued to preferred shareholders | 56,502 | | | — | | | — | | | — | | | 56,502 | |
| Equity financing fees settled in common shares | 1,863 | | | — | | | — | | | — | | | 1,863 | |
| Common shares issued to warrant holders | 10,663 | | | — | | | — | | | — | | | 10,663 | |
| Common shares issued to option holders pursuant to the Cancellation Agreements | 1,072 | | | — | | | — | | | — | | | 1,072 | |
| Sponsor shares distributed to lender under Backstop Agreement | 683 | | | — | | | — | | | — | | | 683 | |
| Supplemental cash flow information: | | | | | | | | | |
| Interest paid | $ | 19,874 | | | $ | — | | | $ | — | | | $ | — | | | $ | 19,874 | |
| Taxes paid (net of refunds) | 957 | | | — | | | — | | | — | | | 957 | |
NOTE 4 – REVENUE RECOGNITION
Contract Balances
Deferred revenue as of December 31, 2022, and 2021, was $7.8 million, and $6.9 million, respectively, and primarily relates to revenue that is recognized over time for connectivity monthly recurring charges, the changes in balance of which are related to the satisfaction or partial satisfaction of these contracts. The balance also contains a deferral for goods that are in-transit at the period end for which control transfers to the customer upon delivery. All of the December 31, 2021, balance was recognized as revenue during the year ended December 31, 2022.
Disaggregated Revenue Information
The Company views the following disaggregated disclosures as useful to understand the composition of revenue recognized during the respective reporting periods:
| | | | | | | | | | | |
| Years Ended |
| (In thousands, USD) | December 31, 2022 | | December 31, 2021 |
| IoT Connectivity* | $ | 173,162 | | | $ | 164,610 | |
| Hardware Sales | 69,091 | | | 54,898 | |
| Hardware Sales - bill-and-hold | 10,736 | | | 5,357 | |
| Deployment services, professional services, referral services, and other | 15,458 | | | 23,570 | |
| Total | $ | 268,447 | | | $ | 248,435 | |
__________________
*Includes connectivity-related revenues from IoT Connectivity and IoT Solutions
Significant Customer
The Company has one customer, a large multinational medical device and health care company representing 11% and 21% of the Company’s total revenue for the years ending December 31, 2022, and 2021, respectively.
This same customer represented 16% and 30% of the Company’s total accounts receivable as of December 31, 2022, and 2021, respectively. The Company believes it is not exposed to significant risk due to the financial strength of this customer and their historical trend of on-time payment.
NOTE 5 – REVERSE RECAPITALIZATION
On September 30, 2021, pre-combination KORE and CTAC consummated the merger contemplated by the merger agreement (see Note 1 – Nature of Operations).
Immediately following the Business Combination, there were 71,810,419 shares of common stock with a par value of $0.0001 per share. Additionally, there were outstanding warrants to purchase 8,911,744 shares of common stock.
The Business Combination was accounted for as a reverse recapitalization in accordance with GAAP as pre-combination KORE was determined to be the accounting acquirer. Under this method of accounting, while CTAC was the legal acquirer, it has been treated as the “acquired” company for financial reporting purposes. Accordingly, the Business Combination was treated as the equivalent of pre-combination KORE issuing stock for the net assets of CTAC, accompanied by a recapitalization. The net assets of CTAC were stated at historical cost, with no goodwill or other intangible assets recorded. Operations prior to the Business Combination are those of pre-combination KORE. Reported shares and earnings per share available to holders of the Company’s common stock, prior to the Business Combination, have been retroactively restated to reflect the exchange ratio established in the Business Combination (approximately one pre-combination KORE share to 139.15 of the Company’s shares).
The most significant change in the post-combination Company’s reported financial position and results was an increase in cash, net of transactions costs paid at close, of $63.2 million including: $225.0 million in gross proceeds from the private placements (the “PIPE”), $20.0 million in proceeds from CTAC after redemptions, $95.1 million in proceeds from the Backstop Notes (see Note 10), and payments of $229.9 million to KORE’s preferred shareholders. Additionally, on the Closing Date, the Company repaid the Senior Secured Revolving Credit Facility with UBS of $25 million. The Company also repaid the outstanding related party loans due to Interfusion B.V and T-Fone B.V. of $1.6 million.
The Company incurred $24.2 million in transaction costs relating to the Business Combination on the Closing Date, of which $24.1 million has been recorded against additional paid-in capital in the consolidated balance sheet
as of December 31, 2021 and the remaining amount of $0.1 million was recognized as selling, general and administrative expenses in the consolidated statement of operations for the year ended December 31, 2021.
Upon closing of the Business Combination, the shareholders of CTAC, including CTAC founders, were issued 10,356,593 shares of common stock of the Company. In connection with the Closing, holders of 22,240,970 shares of common stock of CTAC were redeemed at a price per share of $10.00. In connection with the Closing, 22,500,000 shares of the Company were issued to PIPE investors at a price per share of $10.00.
The number of shares of Class A common stock issued immediately following the consummation of the Business Combination were:
| | | | | | | | | | | |
| Shares | | Percentage |
| Pre-combination KORE shareholders | 38,767,500 | | 54.0 | % |
| Public stockholders | 10,356,593 | | 14.4 | % |
| Private offering and merger financing | 22,686,326 | | 31.6 | % |
| Total | 71,810,419 | | 100.0 | % |
Prior to the Business Combination, pre-combination KORE had a different capital structure comprised of several classes of preferred stock and warrants. As a result of the Business Combination, these were settled for cash or shares of common stock of the Company in lieu of cash.
NOTE 6 – ACQUISITIONS
BMP Business Combination
On February 16, 2022, the Company acquired 100% of the outstanding share capital of Business Mobility Partners, Inc. and Simon IoT LLC which are industry-leading mobility service providers, to expand the Company’s services and solutions within the healthcare and life sciences industries (the “BMP Business Combination Agreement”).
The transaction was funded by available cash and the issuance of the Company’s shares. Transaction costs for legal consulting, accounting, and other related costs incurred in connection with the acquisition of BMP were $1.7 million of which, $1.4 million and $0.3 million were included in selling, general and administrative expenses in the Company's consolidated statements of operation for the years ended December 31, 2022 and 2021 respectively.
The following table summarizes the allocation of the consideration transferred for BMP, including the identified assets acquired and liabilities assumed as of the acquisition date.
| | | | | |
| (In thousands, USD, except share amounts) | Fair Value |
Cash, (net of closing cash of $1,995) and working capital adjustments | $ | 46,002 | |
Fair value of KORE Common Stock issued to sellers (4,212,246 shares) | 23,295 | |
Total consideration | $ | 69,297 | |
| Assets acquired: | |
| Accounts receivable | 3,303 | |
| Inventories | 1,323 | |
| Prepaid expenses and other receivables | 976 | |
| Property and equipment | 201 | |
| Intangible assets | 28,664 | |
Total Assets acquired | 34,467 | |
| Liabilities assumed: | |
| Deferred tax liabilities | 7,391 | |
| Accounts payable and accrued liabilities | 2,638 | |
Liabilities assumed | 10,029 | |
Net identifiable assets acquired | 24,438 | |
Goodwill (excess of consideration transferred over net identifiable assets acquired) | $ | 44,859 | |
Goodwill represents the future economic benefits that we expect to achieve as a result of the BMP acquisition. Approximately $7.0 million of the goodwill resulting from the acquisition is deductible for tax purposes.
The BMP Business Combination Agreement contains customary indemnification terms. Under the BMP Business Combination Agreement, a portion of the cash purchase price, approximately $3.45 million paid at closing is to be held in escrow, for a maximum of 18 months from the closing date, to guarantee performance of general representations and warranties regarding closing amounts and to indemnify the Company against any future claims. During the year ended December 31, 2022, $0.6 million of the $3.45 million was paid to the seller from the escrow account that did not result in any adjustments to the purchase price. The financial results of BMP are included in the Company’s consolidated statement of operations from the date of acquisition. For the year ended December 31, 2022, the amounts of revenue and net income included in the Company’s consolidated statement of operations were $45.7 million and $11.1 million, respectively.
Unaudited pro forma information
This unaudited pro forma financial information presented is not necessarily indicative of what the operating results would have been if the acquisition had taken place on January 1, 2021, nor is it indicative of future operating results. The pro forma amounts include the historical operating results of the Company prior to the acquisition, with adjustments factually supportable and directly attributable to the acquisition, primarily related to transaction costs, and the amortization of intangible assets. Had the acquisition of BMP been completed on January 1, 2021, net revenue and loss would have been:
| | | | | | | | | | | |
| Years Ended |
| (In thousands, USD) | December 31, 2022 | | December 31,
2021 |
| Net Revenue | $ | 274,179 | | | $ | 278,601 | |
| Net Loss | 104,483 | | | 22,415 | |
NOTE 7 – CONSOLIDATED FINANCIAL STATEMENT DETAILS
Accounts Receivable
| | | | | | | | | | | |
| Years Ended |
| (In thousands, USD) | December 31, 2022 | | December 31,
2021 |
| Accounts receivable | $ | 46,067 | | | $ | 53,415 | |
| Allowance for doubtful accounts | (559) | | | (532) | |
Allowance for credit provisions* | (970) | | | (1,268) | |
Accounts receivable, net | $ | 44,538 | | | $ | 51,615 | |
___________________
*Overage/usage charges are evaluated on a monthly basis, and any overage/usage charges determined by management as unlikely to be collected due to a customer disputing the charge or due to a concession are reserved. Reserved items are written off when deemed uncollectible or recognized as revenue if collected.
The Company incurred bad debt expense of $0.4 million, and $0.3 million, for the years ended December 31, 2022, and 2021, respectively.
Prepaid Expenses and Other Current Assets
The Company’s prepaid expenses and other current assets consist of the following:
| | | | | | | | | | | |
| Years Ended |
| (In thousands, USD) | December 31,
2022 | | December 31,
2021 |
| Prepaid expenses | 8,362 | | | 6,333 | |
| Other current assets | 5,122 | | | 1,030 | |
| Total Prepaid expenses and other current assets | $ | 13,484 | | | $ | 7,363 | |
Property and equipment
Major classes of property and equipment consist of the following:
| | | | | | | | | | | |
| Years Ended |
| (In thousands, USD) | December 31,
2022 | | December 31,
2021 |
| Computer hardware | $ | 17,684 | | | $ | 15,747 | |
| Computer software | 9,547 | | | 9,023 | |
| Furniture and fixtures | 2,550 | | | 2,242 | |
| Networking equipment | 7,715 | | | 8,089 | |
| Leasehold improvements | 3,017 | | | 2,793 | |
| Total property and equipment | 40,513 | | | 37,894 | |
| Less: accumulated depreciation | (28,614) | | | (25,654) | |
| Property and equipment (net) | $ | 11,899 | | | $ | 12,240 | |
Depreciation expenses for the years ended December 31, 2022, and 2021, was $3.7 million, and $3.7 million, respectively.
Accrued Liabilities
The Company’s accrued liabilities consist of the following:
| | | | | | | | | | | |
| Years Ended |
| (In thousands, USD) | December 31,
2022 | | December 31,
2021 |
| Accrued payroll and related | $ | 4,804 | | | $ | 13,103 | |
| Accrued cost of revenue | 4,091 | | | 1,886 | |
| Accrued other expenses | 3,970 | | | 5,552 | |
| Sales and other taxes payable | 2,813 | | | 1,621 | |
| Finance Lease Obligation | 115 | | | 191 | |
| Total accrued liabilities | $ | 15,793 | | | $ | 22,353 | |
NOTE 8 – RIGHT-OF USE ASSETS AND LEASE LIABILITIES
The Company leases real estate, computer hardware and vehicles for use in our operations under both operating and finance leases. Our leases have remaining lease terms ranging from 1 year to 10 years, some of which include options to extend the term for up to 10 years, and some of which include options to terminate the leases. The Company includes options to extend or terminate the lease when it is reasonably certain that we will exercise that option. For the majority of leases entered into during the current period, we have concluded it is not reasonably certain that we would exercise the options to extend the lease or terminate the lease early. Therefore, as of the lease commencement date, our lease terms generally do not include these options. Leasehold improvements are depreciated using the straight-line method over the shorter of the estimated useful life or the remaining term of the lease. Our leasehold improvements have lives ranging from 1 year to 10 years. Operating and finance lease cost for the year ended December 31, 2022 were as follows:
| | | | | | | | | | | |
| (In thousands, USD) | Classification in Statement of operations | | December 31, 2022 |
| Operating lease cost | Selling, general and administrative | | $ | 3,531 | |
| Finance lease cost | | | |
| Amortization of leased assets | Depreciation and amortization | | $ | 350 | |
| Interest on lease liabilities | Interest expense | | 17 | |
Total finance lease cost | | | $ | 367 | |
Rent expense for the years ended December 31, 2022, and 2021 was $3.5 million and $2.7 million, respectively.
Supplemental disclosure for the balance sheet related to finance leases were as follows:
| | | | | |
| (In thousands, USD) | December 31, 2022 |
| Assets | |
| Finance lease right-of-use assets included in property and equipment, net | $ | 250 | |
| Liabilities | |
| Current portion of finance lease liabilities included in accrued liabilities | $ | 115 | |
| Non-current portion of finance lease liabilities included in other long-term liabilities | 135 |
Total finance lease liabilities | $ | 250 | |
The weighted-average remaining lease term and the weighted-average discount rate of our leases were as follows:
| | | | | |
| December 31, 2022 |
| Weighted average remaining lease term (in years) | |
| Operating leases | 7.71 years |
| Finance leases | 2.05 years |
| Weighted average discount rate: | |
| Operating leases | 7.6 | % |
| Finance leases | 5.5 | % |
The future minimum lease payments under operating and finance leases at December 31, 2022 for the next five years are as follows:
| | | | | | | | | | | |
| Operating
Leases | | Finance
Leases |
| (In thousands, USD) | Amount | | Amount |
| 2023 | $ | 2,532 | | | $ | 128 | |
| 2024 | 1,877 | | | 113 |
| 2025 | 1,662 | | | 24 |
| 2026 | 1,370 | | | — |
| 2027 | 1,385 | | | — |
| Thereafter | 6,220 | | | — |
Total minimum lease payments | 15,046 | | | 265 |
Interest expense | (3,960) | | | (15) | |
Total | 11,086 | | | 250 |
NOTE 9 – GOODWILL AND OTHER INTANGIBLE ASSETS
The Company’s goodwill balance consists of the following:
| | | | | |
| (In thousands, USD) | Amount |
| December 31, 2020 | $ | 384,202 | |
| Currency translation | (787) | |
| December 31, 2021 | $ | 383,415 | |
| Acquisition | 44,859 | |
| Impairment | (58,074) | |
| Currency translation | (494) | |
| December 31, 2022 | $ | 369,706 | |
The Company tests goodwill for impairment on an annual basis on October 1st and between annual tests whenever events or changes in circumstances indicate that the carrying amount may not be recoverable.
During the fourth quarter of 2022, the Company identified circumstances subsequent to the annual goodwill test that would more likely than not reduce the fair value of the reporting unit (the entity) below its carrying value. The Company performed qualitative and quantitative goodwill impairment tests during the third and the fourth quarters of 2022. These impairment indicators included increased interest rates impacting our weighted average cost of capital, an increase in the Company's specific risk premium, an increase in debt-free net working capital needs and a sustained decline in the Company's share price from the third quarter. In addition to the market data, the valuation
techniques utilized level 3 inputs such as the Company’s internal forecasts of its future results, cash flows and its weighted average cost of capital. As a result, the Company concluded that the carrying value of its reporting unit exceeded the estimated fair value of the reporting unit and recorded a goodwill impairment loss of $58.1 million, which represents the accumulated impairment loss as of December 31, 2022. The fair value of the reporting was estimated by equally weighing the results of the income approach and the market approach.
Key assumptions used in the impairment analysis included projected revenue growth rates, discount rates, and market factors such as earnings multiples from comparable publicly traded companies. The impairment loss has been recognized in our statement of operations as a goodwill impairment loss from operations for the year ended December 31, 2022. The Company did not record a goodwill impairment loss in any prior periods.
The Company’s other intangible assets consist of the following:
| | | | | | | | | | | | | | | | | |
| (In thousands, USD) | Carrying Gross
Amount | | Accumulated
Amortization | | Net Carrying Value |
| Customer relationships | $ | 327,317 | | | $ | (197,483) | | | $ | 129,834 | |
| Technology | 46,978 | | | (42,348) | | | 4,630 | |
| Carrier contracts | 70,210 | | | (47,483) | | | 22,727 | |
| Trademarks | 16,214 | | | (11,060) | | | 5,154 | |
| Internally developed computer software | 72,063 | | | (41,904) | | | 30,159 | |
| Total as of December 31, 2022 | $ | 532,782 | | | $ | (340,278) | | | $ | 192,504 | |
| | | | | | | | | | | | | | | | | |
| (In thousands, USD) | Carrying Gross
Amount | | Accumulated
Amortization | | Net Carrying Value |
| Customer relationships | $ | 305,648 | | | $ | (168,519) | | | $ | 137,129 | |
| Technology | 45,983 | | | (37,529) | | | 8,454 | |
| Carrier contracts | 65,700 | | | (40,488) | | | 25,212 | |
| Trademarks | 15,733 | | | (9,221) | | | 6,512 | |
| Internally developed computer software | 59,906 | | | (34,663) | | | 25,243 | |
| Total as of December 31, 2021 | $ | 492,970 | | | $ | (290,420) | | | $ | 202,550 | |
Amortization expense for the years ended December 31, 2022, and 2021, was $50.8 million, and $46.7 million, respectively.
The following table shows the weighted average remaining useful lives per intangible asset category as of December 31, 2022.
| | | | | |
| Years |
| Customer relationships | 5.0 |
| Technology | 2.6 |
| Carrier contracts | 3.6 |
| Trademarks | 4.3 |
| Internally developed computer software | 4.2 |
The following table shows the estimated amortization expense for the next five years and thereafter as of December 31, 2022.
| | | | | |
| (In thousands, USD) | Amount |
| 2023 | $ | 49,657 | |
| 2024 | 45,932 | |
| 2025 | 43,206 | |
| 2026 | 28,607 | |
| 2027 | 9,645 | |
| Thereafter | 15,457 | |
| Total | $ | 192,504 | |
NOTE 10 – LONG-TERM DEBT AND OTHER BORROWINGS, NET
The Company carries its long term debt based on amortized cost using the effective interest rate method. The following is a summary of long-term debt:
| | | | | | | | | | | |
| (In thousands, USD) | December 31,
2022 | | December 31,
2021 |
| Term Loan – UBS | $ | 302,654 | | | $ | 305,807 | |
| Notes under the Backstop Agreement | 120,000 | | | 120,000 | |
| Other Borrowings | 2,754 | | | 173 | |
| Total | 425,408 | | | 425,980 | |
| Less—current portion | (5,345) | | | (3,326) | |
| Less—equity component, net of accumulated amortization | — | | | (15,517) | |
Less—debt issuance cost, net of accumulated amortization of $8.5 million and $6.1 million, respectively | (6,153) | | | (8,022) | |
| Total Long-term debt and other borrowings | 413,910 | | | 399,115 | |
The following is the summary of future principal repayments on long-term debt:
| | | | | |
| (In thousands, USD) | Amount |
| 2023 | $ | 5,345 | |
| 2024 | 300,063 | |
| 2025 | — | |
| 2026 | — | |
| 2027 | — | |
| Thereafter | 120,000 | |
| Total | $ | 425,408 | |
Senior Secured Term Loan—UBS
On December 21, 2018, the Company entered into a credit agreement with UBS that consisted of a term loan of $280.0 million as well as a senior secured revolving credit facility with UBS (the “Senior Secured UBS Term Loan”, and together with the senior secured revolving credit facility, the “Credit Facilities”). The Senior Secured UBS Term Loan required quarterly principal and interest payments of Term LIBOR plus 5.5%. All remaining principal and interest payments are due on December 21, 2024.
On November 12, 2019, the Company amended the Senior Secured UBS Term Loan in order to raise an additional $35.0 million. Under the amended agreement, the maturity date of the term loan and interest rate
remained unchanged. However, the quarterly principal repayment changed to $0.8 million. The principal and quarterly interest are paid on the last business day of each quarter, except at maturity. As a result of this debt modification, the Company incurred $0.2 million in debt issuance costs, which was capitalized and is being amortized over the remaining term of the loan along with the unamortized debt issuance costs of the original debt.
On December 22, 2022, the Company amended the Senior Secured UBS Term Loan to facilitate the planned phase out of LIBOR by the UK Financial Conduct Authority. The amendment established the Secure Overnight Financing Rate ("SOFR") as the primary reference rate and replaced the Eurocurrency Rate to Term SOFR plus a SOFR adjustment of 0.10%. All the other terms remain unchanged.
For the year ended December 31, 2022, the Company recognized interest expense related to the contractual interest expense of $22.5 million and interest expense related to the amortization of the debt issuance costs of $2.4 million.
The term loan agreement limits cash dividends and other distributions from the Company’s subsidiaries to KORE Group Holdings Inc. and also restricts the Company’s ability to pay cash dividends to its shareholders. On December 31, 2022, and 2021, restricted net assets of the consolidated subsidiaries were $192.5 million and $256.7 million, respectively.
The term loan agreement contains, among other things, financial covenants related to maximum total debt to adjusted EBITDA ratio and a minimum total leverage ratio. The Company was in compliance with these covenants for the years ended December 31, 2022, and 2021. The credit agreement is substantially secured by all the Company’s assets.
The Company’s principal outstanding balances on the Senior Secured UBS Term Loan were $302.7 million and $305.8 million as of December 31, 2022 and 2021, respectively.
Senior Secured Revolving Credit Facility – UBS
On December 21, 2018, the Company entered into a $30.0 million senior secured revolving credit facility with UBS (the “Senior Secured Revolving Credit Facility”, and together with the Senior Secured UBS Term Loan, the “Credit Facilities”).
Borrowings under the Senior Secured Revolving Credit Facility bore interest at a floating rate which can be, at the Company’s option, either (1) a LIBOR rate for a specified interest period plus an applicable margin of up to 5.50% or (2) a base rate plus an applicable margin of up to 4.5%. After the Closing Date, the applicable margins for LIBOR rate and base rate borrowings were each subjected to a reduction of 5.25% and 4.25%, respectively, if the Company maintains a total leverage ratio of less than or equal to 5.00:1.00. The LIBOR rate was applicable to the Senior Secured Revolving Credit Facility is subject to a “floor” of 0.0%. Additionally, the Company is required to pay a commitment fee of up to 0.38% per annum of the unused balance.
On December 22, 2022, the Company amended the Senior Secured Revolving Credit Facility to facilitate the planned phase out of LIBOR by the UK Financial Conduct Authority. The amendment established the Secure Overnight Financing Rate (“SOFR”) as the primary reference rate and replaced the Euro currency Rate to Term SOFR plus a SOFR adjustment of 0.10%. All the other terms remain unchanged.
On December 23, 2022, the Company amended the Senior Secured Revolving Credit Facility to extend the maturity of the revolving credit facility to September 21, 2024.
As a result of the modifications, the Company incurred $0.2 million in debt issuance costs, which was capitalized and is being amortized over the remaining term of the loan along with the unamortized debt issuance costs of the original and amended debt.
The obligations of the Company and the obligations of the guarantors under the Credit Facilities are secured by first priority pledges of and security interests in (i) substantially all of the existing and future equity interests of KORE Wireless Group, Inc. and each of its subsidiaries organized in the U.S., as well as 65% of the existing and future equity interests of certain first-tier foreign subsidiaries held by the borrower or the guarantors under the Credit
Facilities and (ii) substantially all of the KORE Wireless Group, Inc.’s and each guarantor’s tangible and intangible assets, in each case subject to certain exceptions and thresholds.
As of December 31, 2022, and 2021, no amounts were drawn or outstanding on the Senior Secured Revolving Credit Facility.
Bank Overdraft Facility – BNP Paribas Fortis N.V.
On October 8, 2018, a Belgium subsidiary of the Company entered into a €250,000 bank overdraft facility with BNP Paribas Fortis, (the “Bank Overdraft Facility”). Borrowings under the Bank Overdraft Facility had an indefinite term. However, it was discontinued as of February 13, 2023. Borrowings under the Bank Overdraft Facility bore interest at a floating rate which was a base rate plus an applicable margin of up to 2.0%. The base fee amounts to 9.40% as of December 31, 2022 and was variable. Any overages were charged against a percentage of 6% on a yearly basis. There was no commitment fee payable for the unused balance of the Bank Overdraft Facility.
As of December 31, 2022, and December 31, 2021, the Company had €0 drawn on the Bank Overdraft Facility.
Backstop Agreement
On September 30, 2021, KORE Wireless Group Inc. issued $95.1 million in senior unsecured exchangeable notes due 2028 (the “Backstop Notes”) to affiliates of Fortress Credit Corp. (“Fortress”) pursuant to the terms of the backstop agreement (the “Backstop Agreement”), dated July 27, 2021, by and among KORE Wireless Group Inc. and Fortress. The Backstop Notes were issued pursuant to an indenture (the “Indenture”), dated September 30, 2021, by and among the Company, KORE Wireless Group Inc. and Wilmington Trust, National Association, as trustee, as amended and restated on November 15, 2021. On October 28, 2021, KORE Wireless Group issued an additional $24.9 million in additional notes (the “Additional Notes” and together with the Backstop Notes, the “Notes”) to Fortress, pursuant to the terms of an exchangeable notes purchase agreement (the “Exchangeable Notes Purchase Agreement”), dated October 28, 2021, by and among KORE Wireless Group Inc., the Company and Fortress. The Additional Notes were issued pursuant to the Indenture and contain identical terms to the Backstop Notes. The Notes were issued at par, have a maturity of seven years, bearing interest at the rate of 5.50% per annum which is paid semi-annually, March 30 and September 30 of each year, beginning on March 30, 2022. The Notes are guaranteed by the Company and are exchangeable into common stock of the Company at $12.50 per share (the “Base Exchange Rate”) at any time at the option of Fortress. At the Base Exchange Rate, the Notes are exchangeable for approximately 9.6 million shares of common stock. As of March 31, 2022, the value of the approximately 9.6 million shares underlying the Notes is less than the fair value of the Notes. The Base Exchange Rate may be adjusted for certain dilutive events or change in control events as defined by the Indenture (the “Adjusted Exchange Rate”). Additionally, if after the 2-year anniversary of September 30, 2021, the Company’s shares are trading at a defined premium to the Base Exchange Rate or applicable Adjusted Exchange Rate, the Company may redeem the Notes for cash, force an exchange into shares of its common stock at an amount per share based on a time-value make whole table, or settle with a combination of cash and an exchange (the “Company Option”). As consideration for Fortress entering into that certain commitment letter (the “Commitment Letter”), dated as of September 21, 2021, the Sponsor contributed 100,000 shares of common stock of the Company to LLC Merger Sub, which were transferred by LLC Merger Sub to Fortress, as a commitment fee, pursuant to the terms and upon the conditions set forth in the Commitment Letter. Prior to the implementation of ASU 2020-06 since the Company could use the Company Option to potentially settle all or part of the Notes for the cash equivalent of the fair value of the common stock for which the Notes may be exchanged, a portion of the proceeds of the Notes were required to be allocated to equity, based on the estimated fair value of the Notes had they not contained the exchange features. ASU 2020-06, simplifies and amends the cash conversion guidance so that the Company is no longer required to allocate to equity the estimated fair value of the Notes had they not contained the exchange features. Refer to “Note 2- Summary of Significant Accounting policies – Recently Adopted Accounting Pronouncements” to the consolidated financial statements for a summary of the effects of the adoption of ASU 2020-06. The unamortized discount and issuance costs will be amortized through September 30, 2028. The effective interest rate after the adoption of ASU 2020-06 for the Backstop Notes and the Additional Backstop Notes are 5.9% and 6.1% respectively.
The Backstop Agreement and the Exchangeable Notes Purchase Agreement each contain a customary six-month lock up following the Closing, which prohibits Fortress from hedging the Notes by short selling the Company’s common stock or hedging the Notes via the Company’s warrants or options.
The Indenture contains, among other things, financial covenants related to maximum total debt to adjusted EBITDA ratio. The Company was in compliance with these covenants as of December 31, 2022, and December 31, 2021.
As of December 31, 2022, the net carrying amount of the Notes was $117.5 million, with unamortized debt issuance costs of $2.5 million. The estimated fair value (Level 2) of the convertible debt instrument was $92.9 million.
As of December 31, 2021, prior to adoption of ASU 2020-06, the net carrying amount of the Notes was $102.0 million, with unamortized debt issuance costs of $2.5 million and unamortized equity component costs of $15.5 million. The estimated fair value (Level 2) of the convertible debt instrument was $118.6 million.
Premium Finance Agreement
The Company entered into a Premium Finance Agreement (“Premium Agreement”) on August 3, 2022, to purchase a two-year term Directors and Officers insurance policy. The Premium Agreement is for $3.6 million at a fixed rate of 4.6% per annum, amortized over twenty months. The Premium Agreement requires twenty fixed monthly principal and interest payments of $0.19 million from August 15, 2022, to March 15, 2024.
The Company’s principal outstanding balance on the Premium Agreement was $2.8 million as of December 31, 2022.
NOTE 11 – INCOME TAXES
Income (loss) before provision (benefit) for income taxes from operations for the years ended December 31, 2022, and 2021, consisted of the following:
| | | | | | | | | | | |
| Years Ended |
| (In thousands, USD) | December 31, 2022 | | December 31, 2021 |
| United States | $ | (92,021) | | | $ | (12,184) | |
| Foreign | (24,596) | | | (21,368) | |
| Total loss before income taxes | $ | (116,617) | | | $ | (33,552) | |
The components of the provision (benefit) for income taxes from operations consisted of the following:
| | | | | | | | | | | |
| Years Ended |
| (In thousands, USD) | December 31, 2022 | | December 31, 2021 |
| Current: | |
| Federal | $ | 4,309 | | | $ | 782 | |
| State | 905 | | | 442 | |
| Foreign | 558 | | | (309) | |
| Total current provision | 5,772 | | | 915 | |
| Deferred: | | | |
| Federal | (9,336) | | | (6,478) | |
| State | (4,455) | | | (748) | |
| Foreign | (2,398) | | | (2,465) | |
| Total deferred benefit | (16,189) | | | (9,691) | |
| Total income tax benefit | $ | (10,417) | | | $ | (8,776) | |
The reconciliation between income taxes computed at the U.S. statutory income tax rate to our provision for income taxes for the years ended December 31, 2022, and 2021 is as follows:
| | | | | | | | | | | | | | | | | | | | | | | |
| Years Ended |
| (In thousands, USD) | December 31, 2022 | | December 31, 2021 |
| Benefit for income taxes at 21% rate | $ | (24,490) | | | 21.0 | % | | $ | (7,045) | | | 21.0 | % |
| State taxes, net of federal benefit | (1,358) | | | 1.2 | % | | (1,147) | | | 3.4 | % |
| Change in valuation allowance | 10,628 | | | -9.1 | % | | (642) | | | 1.9 | % |
| Rate change | (1,687) | | | 1.4 | % | | 774 | | | -2.3 | % |
| Credits | (604) | | | 0.5 | % | | (602) | | | 1.8 | % |
| Permanent differences and other | (2,712) | | | 2.2 | % | | 2,852 | | | -8.5 | % |
| Revaluation of warrants | (53) | | | 0.0 | % | | (1,106) | | | 3.3 | % |
| Uncertain tax positions | 591 | | | -0.5 | % | | 544 | | | -1.6 | % |
| Foreign withholding tax | 134 | | | -0.1 | % | | 116 | | | -0.3 | % |
| Foreign rate differential | (2,120) | | | 1.8 | % | | (2,587) | | | 7.7 | % |
| Executive compensation expense | 872 | | | -0.7 | % | | 1,517 | | | -4.5 | % |
| Transaction related expense | 210 | | | -0.2 | % | | (1,450) | | | 4.3 | % |
| Global intangible low taxed income | 283 | | | -0.2 | % | | — | | | 0.0 | % |
| Foreign derived intangible income | (311) | | | 0.3 | % | | — | | | 0.0 | % |
| Goodwill impairment | 10,200 | | | -8.7 | % | | — | | | 0.0 | % |
Benefit for income taxes | $ | (10,417) | | | 8.9 | % | | $ | (8,776) | | | 26.2 | % |
Significant components of the Company’s deferred tax assets (liabilities) as of December 31, 2022, and 2021 are as follows:
| | | | | | | | | | | |
| Years Ended |
| (In thousands, USD) | December 31, 2022 | | December 31, 2021 |
| Deferred tax assets: | | | |
| Net operating loss carry-forward | $ | 13,617 | | | $ | 7,504 | |
| Credit carry-forward | 1,386 | | | 1,956 | |
| Interest expense limitation carry-forward | 15,844 | | | 12,053 | |
| Non-deductible reserves | 339 | | | 374 | |
| Accruals and other temporary differences | 2,835 | | | 1,288 | |
| Stock compensation | 1,164 | | | — | |
| Lease liability | 2,780 | | | — | |
| Property and equipment | 1,007 | | | 1,018 | |
| Gross deferred tax assets | 38,972 | | | 24,193 | |
| Less Valuation allowance | (16,177) | | | (5,750) | |
| Total deferred tax assets (after valuation allowance) | 22,795 | | | 18,443 | |
| Deferred tax liabilities: | | | |
| Property and equipment | (1,738) | | | (4,151) | |
| Intangible assets | (33,117) | | | (40,771) | |
| Goodwill | (5,914) | | | (7,474) | |
| Debt Discount | — | | | (3,972) | |
| Accounting method change | (1,378) | | | — | |
| Right of use asset | (2,514) | | | — | |
| Research and development costs | (3,327) | | | — | |
| Total deferred tax liabilities | $ | (47,988) | | | $ | (56,368) | |
| Net deferred tax liabilities | $ | (25,193) | | | $ | (37,925) | |
The valuation allowance increased by $10.4 million during 2022, primarily due to an increase in U.S. disallowed interest expense carryover and U.S. state tax attributes deemed not realizable. In determining the need for a valuation allowance, the Company has given consideration to its worldwide cumulative loss position when assessing the weight of the sources of taxable income that can be used to support the realization of deferred tax assets. The Company has assessed, on a jurisdictional basis, the available means of recovering deferred tax assets, including the ability to carry-back net operating losses, the existence of reversing temporary differences, the availability of tax planning strategies and available sources of future taxable income. The Company has also considered the ability to implement certain strategies that would, if necessary, be implemented to accelerate taxable income and use expiring deferred tax assets. The Company believes it is able to support the deferred tax assets recognized as of the end of the year based on all of the available evidence.
As of December 31, 2022, the Company has U.S. state tax net operating loss carryforwards of approximately $39 million which may be available to offset future income tax liabilities and expire at various dates beginning in 2032 through 2042. Additionally, the Company has U.S. state tax net operating loss carryforwards of approximately $13.0 million which carryforward indefinitely. Additionally, the Company has generated $38.0 million of foreign operating loss carryforwards which expire at various dates. As of December 31, 2022, the Company did not have U.S. federal tax loss carried forward.
As of December 31, 2022, the Company has U.S. state research and development tax credit carryforwards of $0.1 million which expire beginning in 2032 through 2033. As of December 31, 2022, the Company did not have
any federal research and development tax credit carried forward. Additionally, the Company has $1.3 million of foreign research and development tax credit carryforwards.
Due to provisions of the Tax Cuts and Jobs Act of 2017, the Company has a carryforward of U.S. disallowed interest expense of $68.8 million, which has an indefinite carryforward period.
Utilization of the NOL carryforwards may be subject to limitation under Section 382 of the Internal Revenue Code of 1986 due to ownership change limitations that have occurred previously or that could occur in the future. These ownership changes may limit the amount of NOL and tax credit carryforwards that can be utilized annually to offset future taxable income and tax, respectively. There could be additional ownership changes in the future, which may result in additional limitations on the utilization of the NOL and tax credit carryforwards.
For taxable years beginning after December 31, 2017, taxpayers are subjected to the global intangible low-taxed income provisions, or GILTI provisions. The GILTI provisions require the Company to currently recognize in U.S. taxable income a deemed dividend inclusion of foreign subsidiary earnings in excess of an allowable return on the foreign subsidiary’s tangible assets. The ability to benefit from a deduction and foreign tax credits against a portion of the GILTI income may be limited under the GILTI rules as a result of the utilization of net operating losses, foreign sourced income, and other potential limitations within the foreign tax credit calculation. For the year ended December 31, 2022, the Company recorded an income tax charge related to GILTI of $0.3 million. For the year ended December 31, 2021, the Company did not record an income tax charge related to GILTI. The Company has made an accounting policy election, as allowed by the SEC and FASB, to recognize the impacts of GILTI within the period incurred. Accordingly, no U.S. deferred taxes are provided on GILTI inclusions of future foreign subsidiary earnings.
As of December 31, 2022, the Company has not provided U.S. taxes on the undistributed earnings of its foreign subsidiaries that it considers indefinitely reinvested. This indefinite reinvestment determination is based on the future operational and capital requirements of the Company’s domestic and foreign operations. The Company expects that the cash held by its foreign subsidiaries of $19.5 million as of December 31, 2022 will continue to be used for its foreign operations and, therefore, does not anticipate repatriating these funds.
The Company conducts business globally and, as a result, its subsidiaries file income tax returns in U.S. federal and state jurisdictions and various foreign jurisdictions. In the normal course of business, the Company may be subject to examination by taxing authorities throughout the world, including such major jurisdictions as Australia, Canada, Malta, the Netherlands, the United Kingdom, and the United States. Since the Company is in a loss carry-forward position, the Company is generally subject to U.S. federal and state income tax examinations by tax authorities for all years for which a loss carry-forward is utilized. As of December 31, 2022, the Company is not under income tax examination in any jurisdiction.
During the ordinary course of business, there are many transactions and calculations for which the ultimate tax determination is uncertain. The Company establishes reserves for tax-related uncertainties based on estimates of whether, and the extent to which, additional taxes will be due. These reserves are established when the Company believes that certain positions might be challenged despite its belief that its tax return positions are fully supportable. The Company adjusts these reserves in light of changing facts and circumstances, such as the outcome of tax examinations.
The following table presents a reconciliation of the total amounts of unrecognized tax benefits, excluding interest and penalties, included in accrued liabilities and other long-term liabilities in the consolidated balance sheets.
| | | | | | | | | | | |
| Years Ended |
| (In thousands, USD) | December 31, 2022 | | December 31, 2021 |
| Unrecognized tax benefits at the beginning of the year | $ | 8,132 | | | $ | 7,690 | |
| Additions for tax positions of current year | 442 | | | 442 | |
| Unrecognized tax benefits at the end of the year | $ | 8,574 | | | $ | 8,132 | |
The Company and its subsidiaries have accumulated significant intercompany obligations owed to/from various other subsidiaries of the Company. During the year ended December 31, 2022, the Company completed its assessment of its U.S. and non-U.S. income and non-income tax risks related to these obligations and added both current and prior period unrecognized tax benefits associated with the intercompany balances.
If the unrecognized tax benefit balance as of December 31, 2022, were recognized, it would in its entirety result in a tax benefit impacting the effective tax rate. The Company does not anticipate any material changes to its unrecognized tax benefits within the next 12 months.
The Company recognizes interest and penalties accrued related to unrecognized tax benefits as income tax expense. During the years ended December 31, 2022, and 2021 the Company recognized $9 thousand and $100 thousand in interest and penalties, respectively. The Company had $1 million and $1 million of interest and penalties accrued on December 31, 2022, and 2021, respectively.
NOTE 12 – COMMITMENTS AND CONTINGENCIES
Off-Balance-Sheet Credit Exposures
The Company did not have off balance sheet standby letters of credit and bank guarantees as of December 31, 2022. The Company had off balance sheet standby letters of credit and bank guarantees of $0.4 million as of December 31, 2021.
Purchase Obligations
The Company has vendor commitments primarily relating to carrier and open purchase obligations that the Company incurs in the ordinary course of business. As of December 31, 2022, the purchase commitments were as follows:
| | | | | |
| (In thousands, USD) | Amount |
| 2023 | $ | 29,012 | |
| 2024 | 5,808 | |
| 2025 | 7,590 | |
| 2026 | 4,505 | |
| 2027 | 4,773 | |
| Thereafter | 5,000 | |
| Total | $ | 56,688 | |
Operating Leases
The Company leases various office spaces under non-cancellable operating leases expiring through 2029.
The future minimum lease payments under operating leases as of December 31, 2021, for the next five years were as follows:
| | | | | |
| (In thousands, USD) | Amount |
| 2022 | $ | 2,924 | |
| 2023 | 1,904 | |
| 2024 | 1,495 | |
| 2025 | 1,170 | |
| 2026 | 958 | |
| Thereafter | 3,412 | |
Total | $ | 11,863 | |
Capital Leases
The Company has capital lease obligations in the Netherlands for hardware and software leases.
The future minimum lease payments under capital leases as of December 31, 2021, for the next five years were as follows:
| | | | | |
| (In thousands, USD) | Amount |
| 2022 | $ | 207 | |
| 2023 | 143 | |
| 2024 | 119 | |
| 2025 | 26 | |
| 2026 | — | |
Total minimum lease payments | $ | 495 | |
| Interest expense | (40) | |
Total | $ | 455 | |
Legal Proceedings
From time to time, the Company is involved in litigation arising out of the ordinary course of our business. There are no material legal proceedings, other than ordinary routine litigation incidental to the business, to which the Company or any of the Company’s subsidiaries are a party or of which any of the Company or the Company’s subsidiaries’ property is subject.
NOTE 13 – STOCK BASED COMPENSATION
Restricted Stock Units
2021 Long-Term Stock Incentive Plan
On September 29, 2021, the board of directors (the “Board”) approved the KORE Group Holdings, Inc. 2021 Long-Term Stock Incentive Plan (the “2021 Plan”) to promote the interests of the Company and its stockholders by (i) attracting and retaining employees and directors of, and consultants to, the Company and its subsidiaries; (ii) motivating such individuals by means of performance-related incentives to achieve longer-range performance goals; and (iii) enabling such individuals to participate in the long-term growth and financial success of the Company. The 2021 Plan allows for the grant of share-based payment awards to employees, directors of the Board, and consultants to the Company. The 2021 Plan is administered by the Compensation Committee of the Board. On December 8, 2021, the Compensation Committee of the Board approved the future grants of certain Restricted Stock Unit Awards (“RSUs”), the effectiveness of which were contingent upon the filing and effectiveness of the Form S-8 Registration Statement of the common stock, which occurred on January 4, 2022.
A RSU is a contractual right to receive one share of our common stock in the future, and the fair value of the RSU is based on our share price on the grant date. The Company’s time-based RSUs generally vest one-quarter on each of the second and third anniversaries of the Business Combination date and the remaining one-half on the fourth anniversary of the Business Combination date; however, certain special retention awards may have different vesting terms. In addition, grants of RSUs to our non-employee directors and certain executive officers contain provisions as part of the respective employment agreements that accelerate the vesting of RSU grants in the event of a termination by the Company or a departure by a director or executive officers.
The Company also grants performance-based RSUs that vests subject to the achievement of specified performance goals within a specified time-frame. The performance-based RSUs contain provisions that increase or decrease the number of RSUs that ultimately vest, depending upon the level of performance achieved.
The Company has also granted RSUs that vest based upon the price of our common stock, which is a market condition. The fair value of awards that contain a market-based condition is estimated using a lattice model to analyze the fair value of the subject shares. The lattice model utilizes multiple stock paths, which are analyzed to determine the fair value of the subject shares.
The following table summarizes RSUs activity during the reporting periods shown below:
| | | | | | | | | | | | | | | | | | | | |
| | Number of awards outstanding
(in thousands) | | Weighted-average grant date fair value
(per share) | | Aggregate intrinsic value
(in thousands) |
| Unvested RSUs at December 31, 2021 | | — | | | — | | | — | |
| Granted | | 5,789 | | | $ | 6.24 | | | $ | 36,101 | |
| Vested | | (52) | | | 6.88 | | | (362) | |
| Forfeited and canceled | | (222) | | | 6.97 | | | (1,548) | |
Unvested RSUs at December 31, 2022 | | 5,515 | | | | | $ | 34,191 | |
For the year ended December 31, 2022 the Company granted 4.0 million RSUs that vest based on the passage of time.
The actual number of performance-based RSUs that could vest will range from 0% to 150% of the 1.6 million unvested RSUs granted, depending upon our level of achievement with respect to the performance goals. During the year, the Company granted 1.7 million of performance based RSUs.
During the year ended December 31, 2022, the Company granted approximately 0.2 million RSUs, which vest based on the Company’s stock price attaining a closing price equal to or greater than $13, $15, or $18 per share over any 20 trading days within any 30 consecutive trading day period. The fair value of these RSUs is estimated using a lattice model. Significant inputs used in our valuation of these RSUs included the following:
| | | | | | | | |
| | Year Ended |
| | December 31, 2022 |
| Expected volatility | | 57.1%-75.2% |
| Risk-free interest rate | | 1.4%-2.1% |
| Expected term (in years) | | 5 - 80 |
The following is a summary of the Company’s share-based compensation expense related to RSUs during the reporting periods shown below:
| | | | | | | | | | | | | | |
| | Years Ended |
| (In thousands, USD) | | December 31, 2022 | | December 31, 2021 |
| Total Stock Compensation Expense | | $ | 10,296 | | | $ | 4,564 | |
| Unrecognized Compensation Cost | | 24,272 | | | — | |
| Remaining recognition period (in years) | | 2.6 | | — | |
2014 Equity Incentive Plan
During 2021, the stock options granted under the 2014 equity incentive plan were cancelled and the plan was terminated as of September 30, 2021. Upon the closing of the Business Combination, the Company paid out cash consideration of $4.1 million net of applicable withholding taxes and issued 200,426 shares as share consideration valued at $4.3 million (4,325 common shares net of shares for applicable withholding taxes). The following is a summary of the Company’s cancelled stock options from January 1, 2021, through December 31, 2021:
| | | | | | | | | | | | | | | | | | | | | | | |
| Number of Options | | Weighted Average Grant Date Fair Value per Option
(Amount) | | Weighted Average Exercise Price
(Amount) | | Weighted Average Remaining Contractual Term
(Years) |
Balance, December 31, 2020 | 432,500 | | | $ | 15.45 | | | $ | 141.53 | | | 7.7 |
| Granted | — | | | — | | | — | | | |
| Exercised | — | | | — | | | — | | | |
| Forfeited | — | | | — | | | — | | | |
| Expired | — | | | — | | | — | | | |
| Cancelled | (432,500) | | | (15.45) | | | (141.53) | | | 7.7 |
Balance, December 31, 2021 | — | | | $ | — | | | $ | — | | | — | |
NOTE 14 – WARRANTS ON COMMON STOCK
Public Warrants
As part of CTAC’s initial public offering (the “CTAC IPO”) in 2020, CTAC issued warrants to third party investors, and each whole warrant entitles the holder to purchase one share of the Company’s common stock at an exercise price of $11.50 per share (the “Public Warrants”). Subsequent to the Business Combination, 8,638,966 Public Warrants remained outstanding as of December 31, 2022.
The Public Warrants may only be exercised for a whole number of common shares. The Public Warrants will become exercisable on the later of (a) 30 days after the completion of a Business Combination or (b) 12 months from the closing of the proposed public offering; provided in each case that the Company has an effective registration statement under the Securities Act covering the common shares issuable upon exercise of the Public Warrants and a current prospectus relating to them is available (or the Company permits holders to exercise their Public Warrants on a cashless basis and such cashless exercise is exempt from registration under the Securities Act). The Company completed its public offering on September 30, 2021 and filed an effective registration statement (form S-1) under the Securities Act covering the common shares which was effective on December 20, 2021. The Company plans to make commercially reasonable efforts to maintain the effectiveness of such registration statement and a current prospectus relating to those common shares until the warrants expire or are redeemed, as specified in the Warrant Agreement provided that if the common shares are at the time of any exercise of a warrant not listed on a national securities exchange such that they satisfy the definition of a “covered security” under Section 18(b)(1) of the Securities Act, the Company may, at its option, require holders of Public Warrants who exercise their warrants to do so on a “cashless basis” in accordance with Section 3(a)(9) of the Securities Act and, in the event the Company so elects, it will not be required to file or maintain in effect a registration statement. The Public Warrants will expire five years after the completion of the Business Combination or earlier upon redemption or liquidation.
The Company evaluated the Public Warrants for liability or equity classification in accordance with the provisions of ASC 480, Distinguishing Liabilities from Equity, and ASC 815-40, Derivatives and Hedging. As the surviving entity following the Business Combination has a single class of shares issued and outstanding, the Public Warrants are classified as equity, with the fair value of the Public Warrants as of the date of the Business Combination closed to additional paid-in capital.
Initial and Subsequent Measurement—Public Warrants
The Public Warrants were initially recorded at fair value. The fair value of the Public Warrants as of September 30, 2021, based on the closing price of KORE.WS, was closed to additional paid-in capital and the Public Warrants will not be remeasured in subsequent reporting periods.
Private Placement Warrants
As part of CTAC’s IPO in 2020, CTAC completed the private sale of warrants (“Private Placement Warrants”), and each Private Placement Warrant allows the holder to purchase one share of the Company’s common stock at $11.50 per share. Subsequent to the Business Combination, 272,779 Private Placement Warrants remained outstanding as of December 31, 2022.
The Private Placement Warrants and the common shares issuable upon exercise of the Private Placement Warrants were not transferable, assignable or salable until 30 days after the completion of the Business Combination (except pursuant to limited exceptions to the Company’s officers and directors and other persons or entities affiliated with the initial purchasers of the Private Placement Warrants) and they will not be redeemable by the Company (except as subject to certain conditions when the price per common share equals or exceeds $10.00) so long as they are held by the Sponsor or its permitted transferees. The Sponsor, or its permitted transferees, has the option to exercise the Private Placement Warrants on a cashless basis. If the Private Placement Warrants are held by holders other than the Sponsor or its permitted transferees, the Private Placement Warrants will be redeemable by the Company and exercisable by the holders on the same basis as the Public Warrants.
The Company evaluated the Private Placement Warrants for liability or equity classification in accordance with the provisions of ASC 480, Distinguishing Liabilities from Equity, and ASC 815-40, Derivatives and Hedging. Based on the provisions governing the warrants in the applicable agreement, the Company determined that the Private Placement Warrants met the criteria and were required to be classified as a liability subject to the guidance in ASC 815-10 and 815-40 and should effectively be treated as outstanding common shares in both basic and diluted EPS calculations.
Initial Measurement—Private Placement Warrants
The Private Placement Warrants were initially measured at fair value. As the transfer of Private Placement Warrants to anyone outside of a small group of individuals who are permitted transferees would result in the Private Placement Warrants having substantially the same terms as the Public Warrants, the Company determined that the fair value of each Private Placement Warrant is equivalent to that of each Public Warrant, with an insignificant adjustment for short-term marketability restrictions. As such, the Private Placement Warrants are classified as Level 2.
As of December 31, 2022, and 2021 the aggregate value of the Private Placement Warrants was $32.7 thousand and $0.3 million, respectively based on the closing price of KORE.WS on that date of $0.12 and $1.05, respectively.
Subsequent Measurement—Private Placement Warrants
The Private Placement Warrants are measured at fair value on a recurring basis based on the closing price of KORE.WS on the relevant date.
The change in fair value of the warrant liability for the periods ending December 31, 2022, and 2021, resulted in a gain of $0.3 million and $5.3 million, respectively.
KORE Warrants
In connection with the sale of Series B preferred stock, pre-combination KORE issued warrants (“KORE Warrants”) for the purchase of common stock at an exercise price of $0.01 per warrant. Upon the closing of the Business Combination, all KORE Warrants were exercised and converted into shares of common stock. As of December 31, 2022 and 2021, there were no outstanding KORE Warrants.
NOTE 15 – NET LOSS PER SHARE
The Company follows the two-class method when computing net loss per common share when shares are issued that meet the definition of participating securities. The two-class method requires income available to common shareholders for the period to be allocated between common and participating securities based upon their respective rights to receive dividends as if all income for the period had been distributed. The two-class method also requires
losses for the period to be allocated between common and participating securities based on their respective rights if the participating security contractually participates in losses. As holders of participating securities do not have a contractual obligation to fund losses, undistributed net losses were not allocated to participating securities in the current or comparative years presented. Earnings per share calculations for all periods prior to the Business Combination have been retrospectively restated to the equivalent number of shares reflecting the exchange ratio established in the merger agreement.
Presented in the table below is a reconciliation of the numerator and denominator for the basic and diluted earnings per share (“EPS”) calculations for the periods ended:
| | | | | | | | | | | |
| (In thousands, USD) | December 31, 2022 | | December 31, 2021 |
| Numerator: | | | |
| Net loss attributable to the Company | $ | (106,200) | | | $ | (24,776) | |
| Less cumulative earnings to preferred shareholder | — | | | (22,822) | |
| Add premium on preferred conversion to common shares | — | | | 4,074 | |
| Net income (loss) attributable to common stockholders | $ | (106,200) | | | $ | (43,524) | |
| Denominator: | | | |
| Weighted average common shares and warrants outstanding | | | |
| Basic (in number) | 75,710,904 | | | 41,933,050 | |
| Diluted (in number) | 75,710,904 | | | 41,933,050 | |
| Net loss per unit attributable to common stockholder | | | |
| Basic | $ | (1.40) | | | $ | (1.04) | |
| Diluted | $ | (1.40) | | | $ | (1.04) | |
The following securities were not included in the computation of diluted shares outstanding because the effect would be anti-dilutive:
| | | | | | | | | | | | |
| (number of shares) | December 31,
2022 | | December 31,
2021 | |
| Restricted stock grants with only service conditions | 3,552,416 | | | — | | |
| Common stock issued under the Backstop Agreement | 9,600,031 | | | 9,600,031 | | |
| Private Placement Warrants | 272,779 | | | 272,779 | | |
| Series C Convertible Preferred Stock | — | | | 2,566,186 | | |
| Stock Options | — | | | 432,500 | | |
NOTE 16 – RELATED PARTY TRANSACTIONS
Leasing and Professional Services Agreement
KORE TM Data Brasil Processamento de Dados Ltda., a wholly owned subsidiary of the Company, maintains a lease and a professional services agreement with a company controlled by a key member of the Company's management team.
Aggregated related party transactions, which have been recorded at the exchange amount, representing the amount of consideration established and agreed by the related parties, was $0.3 million, and $0.2 million, for the years ended December 31, 2022, and 2021, respectively. The amount was recorded under selling, general and administrative expenses in the consolidated statements of operations.
Business Mobility Partners, Inc. (BMP, Inc.) a wholly owned subsidiary of the Company, has an informal services agreement with BMP Brasil Locacoes Ltda (BMP Brasil), located in Sao Paulo, Brazil, which is controlled
by two key members of the Company's management team. The Company does not have any ownership interest or control over BMP Brasil.
BMP Brasil renders technical assistance services to purchase and deliver telecommunication equipment to BMP, Inc.’s clients in Brazil. For the services agreed upon, BMP Brasil was paid a nominal monthly fixed fee plus a fee of 7% of the gross amount of each cost incurred to purchase and deliver telecommunication equipment to the Company’s clients in Brazil. Since BMP, Inc.’s acquisition on February 16, 2022, the Company has incurred and paid $2.3 million to BMP Brasil for hardware and services rendered during 2022.
NOTE 17 – Quarterly Unaudited Financial Statements
As discussed in Note 3, the Company determined that its unaudited interim consolidated financial statements for the quarterly and year-to-date periods ended March 31, 2022 and 2021, June 30, 2022 and 2021 and September 30, 2022 and 2021 were not materially misstated but should be revised. The following tables present the impact of the revisions on the unaudited interim consolidated financial statements.
KORE Group Holdings, Inc. and Subsidiaries
Consolidated Balance Sheets
(In thousands USD, except share amounts)
| | | | | | | | | | | | | | | | | | | | | | | | | | | | | |
| March 31, 2022 | | | | | | |
| As previously reported | | Income tax adjustments | | Indirect tax adjustments | | Other adjustments | | Revised |
| Assets | | | | | | | | | |
| Current assets | | | | | | | | | |
| Cash | $ | 31,914 | | | $ | — | | | $ | — | | | $ | — | | | $ | 31,914 | |
| Accounts receivable, net | 57,073 | | | — | | | — | | | 366 | | | 57,439 | |
| Inventories, net | 12,069 | | | — | | | — | | | (280) | | | 11,789 | |
| Income taxes receivable | 1,239 | | | — | | | — | | | (14) | | | 1,225 | |
| Prepaid expenses and other current assets | 7,660 | | | — | | | — | | | (386) | | | 7,274 | |
Total current assets | $ | 109,955 | | | $ | — | | | $ | — | | | $ | (314) | | | $ | 109,641 | |
| Non-current assets | | | | | | | | | |
| Restricted cash | 370 | | | — | | | — | | | — | | | 370 | |
| Property and equipment, net | 12,167 | | | — | | | — | | | — | | | 12,167 | |
| Intangibles assets, net | 222,759 | | | — | | | — | | | (903) | | | 221,856 | |
| Goodwill | 426,700 | | | — | | | — | | | 1,453 | | | 428,153 | |
| Operating lease right-of-use assets | 9,050 | | | — | | | — | | | (485) | | | 8,565 | |
| Other long-term assets | 401 | | | — | | | — | | | — | | | 401 | |
Total assets | $ | 781,402 | | | $ | — | | | $ | — | | | $ | (249) | | | $ | 781,153 | |
| Liabilities and stockholders’ equity | | | | | | | | | |
| Current liabilities | | | | | | | | | |
| Accounts payable | $ | 19,901 | | | $ | — | | | $ | — | | | $ | — | | | $ | 19,901 | |
| Accrued liabilities | 11,424 | | | — | | | — | | | 252 | | | 11,676 | |
| Current portion of operating lease liabilities | 2,027 | | | — | | | — | | | (384) | | | 1,643 | |
| Income taxes payable | 959 | | | — | | | — | | | (405) | | | 554 | |
| Deferred revenue | 7,020 | | | — | | | — | | | — | | | 7,020 | |
| Current portion of long-term debt and other borrowings, net | 3,206 | | | — | | | — | | | — | | | 3,206 | |
Total current liabilities | $ | 44,537 | | | $ | — | | | $ | — | | | $ | (537) | | | $ | 44,000 | |
| Non-current liabilities | | | | | | | | | |
| Deferred tax liabilities | 36,443 | | | 1,627 | | | — | | | 126 | | | 38,196 | |
| Warrant liability | 259 | | | — | | | — | | | — | | | 259 | |
| Non-current portion of operating lease liabilities | 7,430 | | | — | | | — | | | — | | | 7,430 | |
| Long-term debt and other borrowings, net | 414,026 | | | — | | | — | | | — | | | 414,026 | |
| Other long-term liabilities | 3,624 | | | 2,112 | | | 1,335 | | | 313 | | | 7,384 | |
Total liabilities | $ | 506,319 | | | $ | 3,739 | | | $ | 1,335 | | | $ | (98) | | | $ | 511,295 | |
| Stockholders’ equity | | | | | | | | | |
| Common stock | $ | 8 | | | $ | — | | | $ | — | | | $ | — | | | $ | 8 | |
| Additional paid-in capital | 427,377 | | | — | | | — | | | (331) | | | 427,046 | |
| Accumulated other comprehensive loss | (3,515) | | | 15 | | | — | | | (86) | | | (3,586) | |
| Accumulated deficit | (148,787) | | | (3,754) | | | (1,335) | | | 266 | | | (153,610) | |
Total stockholders’ equity | $ | 275,083 | | | $ | (3,739) | | | $ | (1,335) | | | $ | (151) | | | $ | 269,858 | |
Total liabilities and stockholders’ equity | $ | 781,402 | | | $ | — | | | $ | — | | | $ | (249) | | | $ | 781,153 | |
KORE Group Holdings, Inc. and Subsidiaries
Consolidated Statements of Operations
(In thousands USD, except share and per share amounts) (unaudited)
| | | | | | | | | | | | | | | | | | | | | | | | | | | | | |
| For the three months ended | | | | | | |
| March 31, 2022 | | | | | | |
| As previously reported | | Income tax adjustments | | Indirect tax adjustments | | Other adjustments | | Revised |
| Revenue | | | | | | | | | |
| Services | $ | 47,506 | | | $ | — | | | $ | — | | | $ | 37 | | | $ | 47,543 | |
| Products | 21,435 | | | — | | | — | | | — | | | 21,435 | |
Total revenue | 68,941 | | | — | | | — | | | 37 | | | 68,978 | |
| Cost of revenue | | | | | | | | | |
| Cost of services | 17,529 | | | — | | | — | | | 21 | | | 17,550 | |
| Cost of products | 17,443 | | | — | | | — | | | 280 | | | 17,723 | |
Total cost of revenue (exclusive of depreciation and amortization shown separately below) | 34,972 | | | — | | | — | | | 301 | | | 35,273 | |
| Operating expenses | | | | | | | | | |
| Selling, general and administrative | 27,628 | | | — | | | 79 | | | 10 | | | 27,717 | |
| Depreciation and amortization | 13,196 | | | — | | | — | | | (21) | | | 13,175 | |
Total operating expenses | 40,824 | | | — | | | 79 | | | (11) | | | 40,892 | |
Operating income (loss) | (6,855) | | | — | | | (79) | | | (253) | | | (7,187) | |
| Interest expense, including amortization of deferred financing costs, net | 6,624 | | | — | | | — | | | — | | | 6,624 | |
| Change in fair value of warrant liability | (27) | | | — | | | — | | | — | | | (27) | |
Loss before income taxes | (13,452) | | | — | | | (79) | | | (253) | | | (13,784) | |
| Income tax expense (benefit) | (2,545) | | | 371 | | | — | | | (38) | | | (2,212) | |
Net loss | $ | (10,907) | | | $ | (371) | | | $ | (79) | | | $ | (215) | | | $ | (11,572) | |
| Loss per share: | | | | | | | | | |
| Basic | $ | (0.15) | | | $ | (0.01) | | | $ | 0.00 | | | $ | 0.00 | | | $ | (0.16) | |
| Diluted | $ | (0.15) | | | $ | (0.01) | | | $ | 0.00 | | | $ | 0.00 | | | $ | (0.16) | |
| Weighted average number of shares outstanding: | | | | | | | | | |
| Basic | 74,040,261 | | | — | | | — | | | — | | | 74,040,261 | |
| Diluted | 74,040,261 | | | — | | | — | | | — | | | 74,040,261 | |
KORE Group Holdings, Inc. and Subsidiaries
Consolidated Statements of Comprehensive Loss
(In thousands USD) (unaudited)
| | | | | | | | | | | | | | | | | | | | | | | | | | | | | |
| For the three months ended | | | | | | |
| March 31, 2022 | | | | | | |
| As previously reported | | Income tax adjustments | | Indirect tax adjustments | | Other adjustments | | Revised |
Net loss | $ | (10,907) | | | $ | (371) | | | $ | (79) | | | $ | (215) | | | $ | (11,572) | |
| Other comprehensive loss: | | | | | | | | | |
| Foreign currency translation adjustment | (184) | | | 61 | | | — | | | — | | | (123) | |
Comprehensive loss | $ | (11,091) | | | $ | (310) | | | $ | (79) | | | $ | (215) | | | $ | (11,695) | |
KORE Group Holdings, Inc. and Subsidiaries
Consolidated Statements of Stockholders’ Equity
(In thousands, USD, except share amounts) (unaudited)
| | | | | | | | | | | | | | | | | | | | | | | | | | | | | | | | | | | |
| Common Stock | | Additional paid-in capital | | Accumulated Other Comprehensive Loss | | Accumulated Deficit | | Total Stockholders’ Equity |
| Shares | | Amount | | Amount | | Amount | | Amount | | Amount |
| As Reported | | | | | | | | | | | |
Balance at December 31, 2021 | 72,027,743 | | | $ | 7 | | | $ | 413,646 | | | $ | (3,331) | | | $ | (138,179) | | | $ | 272,143 | |
| Opening balance sheet adjustment (as previously reported) | — | | | — | | | (11,613) | | | — | | | 299 | | | (11,314) | |
Balance at December 31, 2021 - Adjusted | 72,027,743 | | | 7 | | | 402,033 | | | (3,331) | | | (137,880) | | | 260,829 | |
| Foreign currency translation adjustment | — | | | — | | | — | | | (184) | | | — | | | (184) | |
| Stock-based compensation | — | | | — | | | 2,050 | | | — | | | — | | | 2,050 | |
| Common stock issued pursuant to acquisition | 4,212,246 | | | 1 | | | 23,294 | | | — | | | — | | | 23,295 | |
| Net loss | — | | | — | | | — | | | — | | | (10,907) | | | (10,907) | |
Balance at March 31, 2022 | 76,239,989 | | | $ | 8 | | | $ | 427,377 | | | $ | (3,515) | | | $ | (148,787) | | | $ | 275,083 | |
| | | | | | | | | | | |
| Adjustments | | | | | | | | | | | |
| Balance, December 31, 2021 | — | | | — | | | (331) | | | (132) | | | (4,158) | | | (4,621) | |
| March 31, 2022 | — | | | — | | | — | | | — | | | — | | | — | |
| Foreign currency translation adjustment | — | | | — | | | — | | | 61 | | | — | | | 61 | |
| Net loss | — | | | — | | | — | | | — | | | (665) | | | (665) | |
Total Adjustments - March 31, 2022 | — | | | $ | — | | | $ | (331) | | | $ | (71) | | | $ | (4,823) | | | $ | (5,225) | |
| | | | | | | | | | | |
| As Revised | | | | | | | | | | | |
Balance at December 31, 2021 | 72,027,743 | | | 7 | | | 413,315 | | | (3,463) | | | (142,337) | | | 267,522 | |
Opening balance sheet adjustment (as previously reported) | — | | | — | | | (11,613) | | | — | | | 299 | | | (11,314) | |
Balance at December 31, 2021 | 72,027,743 | | | 7 | | | 401,702 | | | (3,463) | | | (142,038) | | | 256,208 | |
| Foreign currency translation adjustment | — | | | — | | | — | | | (123) | | | — | | | (123) | |
| Stock-based compensation | — | | | — | | | 2,050 | | | — | | | — | | | 2,050 | |
| Common stock issued pursuant to acquisition | 4,212,246 | | | 1 | | | 23,294 | | | — | | | — | | | 23,295 | |
| Net loss | — | | | — | | | — | | | — | | | (11,572) | | | (11,572) | |
Balance at March 31, 2022 | 76,239,989 | | | $ | 8 | | | $ | 427,046 | | | $ | (3,586) | | | $ | (153,610) | | | $ | 269,858 | |
KORE Group Holdings, Inc. and Subsidiaries
Consolidated Statements of Cash Flows
(In thousands USD) (unaudited)
| | | | | | | | | | | | | | | | | | | | | | | | | | | | | |
| For the three months ended | | | | | | |
| March 31, 2022 | | | | | | |
| As previously reported | | Income tax adjustments | | Indirect tax adjustments | | Other adjustments | | Revised |
| Cash flows from operating activities | | | | | | | | | |
| Net loss | $ | (10,907) | | | $ | (371) | | | $ | (79) | | | $ | (215) | | | $ | (11,572) | |
| Adjustments to reconcile net loss to net cash used in operating activities | | | | | | | | | |
| Depreciation and amortization | 13,196 | | | — | | | — | | | (21) | | | 13,175 | |
| Amortization of deferred financing costs | 587 | | | — | | | — | | | — | | | 587 | |
| Non-cash reduction to the operating lease right-of-use assets | 587 | | | — | | | — | | | — | | | 587 | |
| Deferred income taxes | (3,851) | | | 196 | | | — | | | 359 | | | (3,296) | |
| Non-cash foreign currency loss | (3) | | | — | | | — | | | — | | | (3) | |
| Share-based compensation | 2,050 | | | — | | | — | | | — | | | 2,050 | |
| Provision for doubtful accounts | 55 | | | — | | | — | | | — | | | 55 | |
| Change in fair value of warrant liability | (27) | | | — | | | — | | | — | | | (27) | |
| Change in operating assets and liabilities, net of operating assets and liabilities acquired: | | | | | | | | | |
| Accounts receivable | (2,580) | | | — | | | — | | | (55) | | | (2,635) | |
| Inventories | 4,714 | | | — | | | — | | | 280 | | | 4,994 | |
| Prepaid expenses and other receivables | 806 | | | — | | | — | | | 785 | | | 1,591 | |
| Accounts payable and accrued liabilities | (8,428) | | | 175 | | | 79 | | | (337) | | | (8,511) | |
| Deferred revenue | 132 | | | — | | | — | | | — | | | 132 | |
| Income taxes payable | 199 | | | — | | | — | | | (412) | | | (213) | |
| Operating lease liabilities | (510) | | | — | | | — | | | (384) | | | (894) | |
Net cash used in operating activities | $ | (3,980) | | | $ | — | | | $ | — | | | $ | — | | | $ | (3,980) | |
| | | | | | | | | |
| | | | | | | | | |
| | | | | | | | | |
| | | | | | | | | |
Net cash used in investing activities | $ | (48,503) | | | $ | — | | | $ | — | | | $ | — | | | $ | (48,503) | |
| | | | | | | | | |
| | | | | | | | | |
| | | | | | | | | |
| | | | | | | | | |
| | | | | | | | | |
| | | | | | | | | |
Net cash used in financing activities | $ | (1,550) | | | $ | — | | | $ | — | | | $ | — | | | $ | (1,550) | |
| Effect of Exchange Rate Change on Cash and Restricted Cash | (26) | | | — | | | — | | | — | | | (26) | |
| Change in Cash and Restricted Cash | (54,059) | | | — | | | — | | | — | | | (54,059) | |
Cash and Restricted Cash, beginning of period | 86,343 | | | — | | | — | | | — | | | 86,343 | |
Cash and Restricted Cash, end of period | $ | 32,284 | | | $ | — | | | $ | — | | | $ | — | | | $ | 32,284 | |
| | | | | | | | | |
| | | | | | | | | |
| | | | | | | | | |
| | | | | | | | | |
| | | | | | | | | |
| | | | | | | | | |
| | | | | | | | | |
| | | | | | | | | |
KORE Group Holdings, Inc. and Subsidiaries
Consolidated Balance Sheets
(In thousands USD, except share amounts)
| | | | | | | | | | | | | | | | | | | | | | | | | | | | | |
| June 30, 2022 | | | | | | |
| As previously reported | | Income tax adjustments | | Indirect tax adjustments | | Other adjustments | | Revised |
| Assets | | | | | | | | | |
| Current assets | | | | | | | | | |
| Cash | $ | 40,441 | | | $ | — | | | $ | — | | | $ | — | | | $ | 40,441 | |
| Accounts receivable, net | 50,767 | | | — | | | — | | | 277 | | | 51,044 | |
| Inventories, net | 9,897 | | | — | | | — | | | — | | | 9,897 | |
| Income taxes receivable | 712 | | | — | | | — | | | 189 | | | 901 | |
| Prepaid expenses and other receivables | 9,089 | | | — | | | — | | | (386) | | | 8,703 | |
Total current assets | 110,906 | | | — | | | — | | | 80 | | | 110,986 | |
| Non-current assets | | | | | | | | | |
| Restricted cash | 363 | | | — | | | — | | | — | | | 363 | |
| Property and equipment, net | 11,890 | | | — | | | — | | | — | | | 11,890 | |
| Intangibles assets, net | 211,829 | | | — | | | — | | | (883) | | | 210,946 | |
| Goodwill | 426,126 | | | — | | | — | | | 1,453 | | | 427,579 | |
| Operating lease right-of-use assets | 7,914 | | | — | | | — | | | 196 | | | 8,110 | |
| Other long-term assets | 381 | | | — | | | — | | | — | | | 381 | |
Total assets | $ | 769,409 | | | $ | — | | | $ | — | | | $ | 846 | | | $ | 770,255 | |
| Liabilities and stockholders’ equity | | | | | | | | | |
| Current liabilities | | | | | | | | | |
| Accounts payable | $ | 19,288 | | | $ | — | | | $ | — | | | $ | — | | | $ | 19,288 | |
| Accrued liabilities | 15,348 | | | — | | | — | | | 312 | | | 15,660 | |
| Current portion of operating lease liabilities | 1,764 | | | — | | | — | | | 212 | | | 1,976 | |
| Income taxes payable | 502 | | | — | | | — | | | (502) | | | — | |
| Deferred revenue | 7,698 | | | — | | | — | | | (684) | | | 7,014 | |
| Current portion of long-term debt and other borrowings, net | 3,165 | | | — | | | — | | | — | | | 3,165 | |
Total current liabilities | 47,765 | | | — | | | — | | | (662) | | | 47,103 | |
| Non-current liabilities | | | | | | | | | |
| Deferred tax liabilities | 32,618 | | | 1,801 | | | — | | | 615 | | | 35,034 | |
| Warrant liability | 153 | | | — | | | — | | | — | | | 153 | |
| Non-current portion of operating lease liabilities | 6,852 | | | — | | | — | | | — | | | 6,852 | |
| Long-term debt and other borrowings, net | 413,788 | | | — | | | — | | | — | | | 413,788 | |
| Other long-term liabilities | 4,349 | | | 2,102 | | | 1,414 | | | 264 | | | 8,129 | |
Total liabilities | $ | 505,525 | | | $ | 3,903 | | | $ | 1,414 | | | $ | 217 | | | $ | 511,059 | |
| Stockholders’ equity | | | | | | | | | |
| Common stock | $ | 8 | | | $ | — | | | $ | — | | | $ | — | | | $ | 8 | |
| Additional paid-in capital | 429,878 | | | — | | | — | | | (331) | | | 429,547 | |
| Accumulated other comprehensive loss | (6,074) | | | 201 | | | — | | | (86) | | | (5,959) | |
| Accumulated deficit | (159,928) | | | (4,104) | | | (1,414) | | | 1,046 | | | (164,400) | |
Total stockholders’ equity | $ | 263,884 | | | $ | (3,903) | | | $ | (1,414) | | | $ | 629 | | | $ | 259,196 | |
Total liabilities and stockholders’ equity | $ | 769,409 | | | $ | — | | | $ | — | | | $ | 846 | | | $ | 770,255 | |
KORE Group Holdings, Inc. and Subsidiaries
Consolidated Statements of Operations
(In thousands USD, except share and per share amounts) (unaudited)
| | | | | | | | | | | | | | | | | | | | | | | | | | | | | |
| For the three months ended | | | | | | |
| June 30, 2022 | | | | | | |
| As previously reported | | Income tax adjustments | | Indirect tax adjustments | | Other adjustments | | Revised |
| Revenue | | | | | | | | | |
| Services | $ | 47,778 | | | $ | — | | | $ | — | | | $ | 27 | | | $ | 47,805 | |
| Products | 22,575 | | | — | | | — | | | 541 | | | 23,116 | |
Total revenue | 70,353 | | | — | | | — | | | 568 | | | 70,921 | |
| Cost of revenue | | | | | | | | | |
| Cost of services | 16,577 | | | — | | | — | | | 33 | | | 16,610 | |
| Cost of products | 17,298 | | | — | | | — | | | (280) | | | 17,018 | |
Total cost of revenue (exclusive of depreciation and amortization shown separately below) | 33,875 | | | — | | | — | | | (247) | | | 33,628 | |
| Operating expenses | | | | | | | | | |
| Selling, general and administrative | 29,413 | | | — | | | 79 | | | (85) | | | 29,407 | |
| Depreciation and amortization | 13,774 | | | — | | | — | | | (21) | | | 13,753 | |
Total operating expenses | 43,187 | | | — | | | 79 | | | (106) | | | 43,160 | |
Operating income (loss) | (6,709) | | | — | | | (79) | | | 921 | | | (5,867) | |
| Interest expense, including amortization of deferred financing costs, net | 7,297 | | | — | | | — | | | — | | | 7,297 | |
| Change in fair value of warrant liability | (106) | | | — | | | — | | | — | | | (106) | |
Loss before income taxes | (13,900) | | | — | | | (79) | | | 921 | | | (13,058) | |
| Income tax expense (benefit) | (2,759) | | | 350 | | | — | | | 141 | | | (2,268) | |
Net loss | $ | (11,141) | | | $ | (350) | | | $ | (79) | | | $ | 780 | | | $ | (10,790) | |
| Loss per share: | | | | | | | | | |
| Basic | $ | (0.15) | | | $ | — | | | $ | — | | | $ | 0.01 | | | $ | (0.14) | |
| Diluted | $ | (0.15) | | | $ | — | | | $ | — | | | $ | 0.01 | | | $ | (0.14) | |
| Weighted average number of shares outstanding: | | | | | | | | | |
| Basic | 76,239,989 | | — | | | — | | | — | | | 76,239,989 |
| Diluted | 76,239,989 | | — | | | — | | | — | | | 76,239,989 |
KORE Group Holdings, Inc. and Subsidiaries
Consolidated Statements of Operations
(In thousands USD, except share and per share amounts) (unaudited)
| | | | | | | | | | | | | | | | | | | | | | | | | | | | | |
| For the six months ended | | | | | | |
| June 30, 2022 | | | | | | |
| As previously reported | | Income tax adjustments | | Indirect tax adjustments | | Other adjustments | | Revised |
| Revenue | | | | | | | | | |
| Services | $ | 95,284 | | | $ | — | | | $ | — | | | $ | 64 | | | $ | 95,348 | |
| Products | 44,010 | | | — | | | — | | | 541 | | | 44,551 | |
Total revenue | 139,294 | | | — | | | — | | | 605 | | | 139,899 | |
| Cost of revenue | | | | | | | | | |
| Cost of services | 34,105 | | | — | | | — | | | 54 | | | 34,159 | |
| Cost of products | 34,741 | | | — | | | — | | | — | | | 34,741 | |
Total cost of revenue (exclusive of depreciation and amortization shown separately below) | 68,846 | | | — | | | — | | | 54 | | | 68,900 | |
| Operating expenses | | | | | | | | | |
| Selling, general and administrative | 57,042 | | | — | | | 158 | | | (75) | | | 57,125 | |
| Depreciation and amortization | 26,970 | | | — | | | — | | | (42) | | | 26,928 | |
Total operating expenses | 84,012 | | | — | | | 158 | | | (117) | | | 84,053 | |
Operating income (loss) | (13,564) | | | — | | | (158) | | | 668 | | | (13,054) | |
| Interest expense, including amortization of deferred financing costs, net | 13,921 | | | — | | | — | | | — | | | 13,921 | |
| Change in fair value of warrant liability | (133) | | | — | | | — | | | — | | | (133) | |
Loss before income taxes | (27,352) | | | — | | | (158) | | | 668 | | | (26,842) | |
| Income tax expense (benefit) | (5,304) | | | 721 | | | — | | | 103 | | | (4,480) | |
Net loss | $ | (22,048) | | | $ | (721) | | | $ | (158) | | | $ | 565 | | | $ | (22,362) | |
| Loss per share: | | | | | | | | | |
| Basic | $ | (0.29) | | | $ | (0.01) | | | $ | — | | | $ | 0.01 | | | $ | (0.30) | |
| Diluted | $ | (0.29) | | | $ | (0.01) | | | $ | — | | | $ | 0.01 | | | $ | (0.30) | |
| Weighted average number of shares outstanding: | | | | | | | | | |
| Basic | 75,146,201 | | — | | | — | | | — | | | 75,146,201 | |
| Diluted | 75,146,201 | | — | | | — | | | — | | | 75,146,201 | |
KORE Group Holdings, Inc. and Subsidiaries
Consolidated Statements of Comprehensive Loss
(In thousands USD) (unaudited)
| | | | | | | | | | | | | | | | | | | | | | | | | | | | | |
| For the three months ended | | | | | | |
| June 30, 2022 | | | | | | |
| As previously reported | | Income tax adjustments | | Indirect tax adjustments | | Other adjustments | | Revised |
Net loss | $ | (11,141) | | | $ | (350) | | | $ | (79) | | | $ | 780 | | | $ | (10,790) | |
| Other comprehensive loss: | | | | | | | | | |
| Foreign currency translation adjustment | (2,559) | | | 186 | | | — | | | — | | | (2,373) | |
Comprehensive loss | $ | (13,700) | | | $ | (164) | | | $ | (79) | | | $ | 780 | | | $ | (13,163) | |
| | | | | | | | | | | | | | | | | | | | | | | | | | | | | |
| For the six months ended | | | | | | |
| June 30, 2022 | | | | | | |
| As previously reported | | Income tax adjustments | | Indirect tax adjustments | | Other adjustments | | Revised |
Net loss | $ | (22,048) | | | $ | (721) | | | $ | (158) | | | $ | 565 | | | $ | (22,362) | |
| Other comprehensive loss: | | | | | | | | | |
| Foreign currency translation adjustment | (2,743) | | | 247 | | | — | | | — | | | (2,496) | |
Comprehensive loss | $ | (24,791) | | | $ | (474) | | | $ | (158) | | | $ | 565 | | | $ | (24,858) | |
KORE Group Holdings, Inc. and Subsidiaries
Consolidated Statements of Stockholders’ Equity
(In thousands, USD, except share amounts) (unaudited)
| | | | | | | | | | | | | | | | | | | | | | | | | | | | | | | | | | | |
| Common Stock | | Additional paid-in capital | | Accumulated Other Comprehensive Loss | | Accumulated Deficit | | Total Stockholders’ Equity |
| Shares | | Amount | | Amount | | Amount | | Amount | | Amount |
| As Reported | | | | | | | | | | | |
Balance at December 31, 2021 | 72,027,743 | | | 7 | | | 413,646 | | | (3,331) | | | (138,179) | | | 272,143 | |
Opening balance sheet adjustment (as previously reported) | — | | | — | | | (11,613) | | | — | | | 299 | | | (11,314) | |
Balance at December 31, 2021 - Adjusted | 72,027,743 | | | 7 | | | 402,033 | | | (3,331) | | | (137,880) | | | 260,829 | |
| Foreign currency translation adjustment | — | | | — | | | — | | | (184) | | | — | | | (184) | |
| Stock-based compensation | — | | | — | | | 2,050 | | | — | | | — | | | 2,050 | |
| Common stock issued pursuant to acquisition | 4,212,246 | | | 1 | | | 23,294 | | | — | | | — | | | 23,295 | |
| Net loss | — | | | — | | | — | | | — | | | (10,907) | | | (10,907) | |
Balance at March 31, 2022 | 76,239,989 | | | 8 | | | 427,377 | | | (3,515) | | | (148,787) | | | 275,083 | |
| Foreign currency translation adjustment | — | | | — | | | — | | | (2,559) | | | — | | | (2,559) | |
| Stock-based compensation | — | | | — | | | 2,501 | | | — | | | — | | | 2,501 | |
| Net loss | — | | | — | | | — | | | — | | | (11,141) | | | (11,141) | |
Balance at June 30, 2022 | 76,239,989 | | | 8 | | | 429,878 | | | (6,074) | | | (159,928) | | | 263,884 | |
| | | | | | | | | | | |
| Adjustments | | | | | | | | | | | |
| Balance, December 31, 2021 | — | | | — | | | (331) | | | (132) | | | (4,158) | | | (4,621) | |
| March 31, 2022 | — | | | — | | | — | | | — | | | — | | | — | |
| Foreign currency translation adjustment | — | | | — | | | — | | | 61 | | | — | | | 61 | |
| Net loss | — | | | — | | | — | | | — | | | (665) | | | (665) | |
Total Adjustments - March 31, 2022 | — | | | — | | | (331) | | | (71) | | | (4,823) | | | (5,225) | |
| June 30, 2022 | | | | | | | | | | | |
| Foreign currency translation adjustment | — | | | — | | | — | | | 186 | | | — | | | 186 | |
| Net loss | — | | | — | | | — | | | — | | | 351 | | | 351 | |
Total Adjustments - June 30, 2022 | — | | | — | | | (331) | | | 115 | | | (4,472) | | | (4,688) | |
| | | | | | | | | | | |
| As Revised | | | | | | | | | | | |
Balance at December 31, 2021 | 72,027,743 | | | 7 | | | 413,315 | | | (3,463) | | | (142,337) | | | 267,522 | |
| | | | | | | | | | | | | | | | | | | | | | | | | | | | | | | | | | | |
Opening balance sheet adjustment (as previously reported) | — | | | — | | | (11,613) | | | — | | | 299 | | | (11,314) | |
Balance at December 31, 2021 | 72,027,743 | | | 7 | | | 401,702 | | | (3,463) | | | (142,038) | | | 256,208 | |
| Foreign currency translation adjustment | — | | | — | | | — | | | (123) | | | — | | | (123) | |
| Stock-based compensation | — | | | — | | | 2,050 | | | — | | | — | | | 2,050 | |
| Common stock issued pursuant to acquisition | 4,212,246 | | | 1 | | | 23,294 | | | — | | | — | | | 23,295 | |
| Net loss | — | | | — | | | — | | | — | | | (11,572) | | | (11,572) | |
Balance at March 31, 2022 | 76,239,989 | | | 8 | | | 427,046 | | | (3,586) | | | (153,610) | | | 269,858 | |
| Foreign currency translation adjustment | — | | | — | | | — | | | (2,373) | | | — | | | (2,373) | |
| Stock-based compensation | — | | | — | | | 2,501 | | | — | | | — | | | 2,501 | |
| Net loss | — | | | — | | | — | | | — | | | (10,790) | | | (10,790) | |
Balance at June 30, 2022 | 76,239,989 | | | $ | 8 | | | $ | 429,547 | | | $ | (5,959) | | | $ | (164,400) | | | $ | 259,196 | |
KORE Group Holdings, Inc. and Subsidiaries
Consolidated Statements of Cash Flows
(In thousands USD) (unaudited)
| | | | | | | | | | | | | | | | | | | | | | | | | | | | | |
| For the six months ended | | | | | | |
| June 30, 2022 | | | | | | |
| As previously reported | | Income tax adjustments | | Indirect tax adjustments | | Other adjustments | | Revised |
| Cash flows from operating activities | | | | | | | | | |
| Net loss | $ | (22,048) | | | $ | (721) | | | $ | (158) | | | $ | 565 | | | $ | (22,362) | |
| Adjustments to reconcile net loss to net cash provided by operating activities | | | | | | | | | |
| Depreciation and amortization | 26,970 | | | — | | | — | | | (42) | | | 26,928 | |
| Amortization of deferred financing costs | 1,188 | | | — | | | — | | | — | | | 1,188 | |
| Non-cash reduction to the operating lease right-of-use assets | 1,129 | | | — | | | — | | | — | | | 1,129 | |
| Deferred income taxes | (7,666) | | | 398 | | | — | | | 847 | | | (6,421) | |
| Non-cash foreign currency loss | 489 | | | — | | | — | | | — | | | 489 | |
| Share-based compensation | 4,551 | | | — | | | — | | | — | | | 4,551 | |
| Provision for doubtful accounts | 183 | | | — | | | — | | | — | | | 183 | |
| Change in fair value of warrant liability | (133) | | | — | | | — | | | — | | | (133) | |
| Change in operating assets and liabilities, net of operating assets and liabilities acquired: | | | | | | | | | |
| Accounts receivable | 2,421 | | | — | | | — | | | 33 | | | 2,454 | |
| Inventories | 6,661 | | | — | | | — | | | — | | | 6,661 | |
| Prepaid expenses and other receivables | (769) | | | — | | | — | | | 105 | | | (664) | |
| Accounts payable and accrued liabilities | (2,674) | | | 323 | | | 158 | | | (325) | | | (2,518) | |
| Deferred revenue | 872 | | | — | | | — | | | (684) | | | 188 | |
| Income taxes payable | 269 | | | — | | | — | | | (711) | | | (442) | |
| Operating lease liabilities | (752) | | | — | | | — | | | 212 | | | (540) | |
Net cash provided by operating activities | $ | 10,691 | | | $ | — | | | $ | — | | | $ | — | | | $ | 10,691 | |
| | | | | | | | | |
| | | | | | | | | |
| | | | | | | | | |
| | | | | | | | | |
Net cash used in investing activities | $ | (53,201) | | | $ | — | | | $ | — | | | $ | — | | | $ | (53,201) | |
| | | | | | | | | |
| | | | | | | | | |
| | | | | | | | | |
| | | | | | | | | |
| | | | | | | | | |
| | | | | | | | | |
| | | | | | | | | |
Net cash used in financing activities | $ | (2,454) | | | $ | — | | | $ | — | | | $ | — | | | $ | (2,454) | |
| Effect of exchange rate change on cash and restricted cash | (575) | | | — | | | — | | | — | | | (575) | |
| Change in cash and restricted cash | (45,539) | | | — | | | — | | | — | | | (45,539) | |
Cash and restricted cash, beginning of period | 86,343 | | | — | | | — | | | — | | | 86,343 | |
Cash and restricted cash, end of period | $ | 40,804 | | | $ | — | | | $ | — | | | $ | — | | | $ | 40,804 | |
| | | | | | | | | |
| | | | | | | | | |
| | | | | | | | | |
| | | | | | | | | |
| | | | | | | | | |
| | | | | | | | | |
| | | | | | | | | |
KORE Group Holdings, Inc. and Subsidiaries
Consolidated Balance Sheets (Unaudited)
(In thousands USD, except share and per share amounts)
| | | | | | | | | | | | | | | | | | | | | | | | | | | | | |
| September 30, 2022 | | | | | | |
| As previously reported | | Income tax adjustments | | Indirect tax adjustments | | Other adjustments | | Revised |
| Assets | | | | | | | | | |
| Current assets | | | | | | | | | |
| Cash | $ | 42,925 | | | $ | — | | | $ | — | | | $ | — | | | $ | 42,925 | |
| Accounts receivable, net | 41,237 | | | — | | | — | | | 475 | | | 41,712 | |
| Inventories, net | 8,272 | | | — | | | — | | | — | | | 8,272 | |
| Income taxes receivable | 711 | | | — | | | — | | | 821 | | | 1,532 | |
| Prepaid expenses and other current assets | 13,316 | | | — | | | — | | | (386) | | | 12,930 | |
Total current assets | 106,461 | | | — | | | — | | | 910 | | | 107,371 | |
Non-current assets | | | | | | | — | | | |
| Restricted cash | 358 | | | — | | | — | | | — | | | 358 | |
| Property and equipment, net | 12,141 | | | — | | | — | | | — | | | 12,141 | |
| Intangibles assets, net | 201,260 | | | — | | | — | | | (862) | | | 200,398 | |
| Goodwill | 425,604 | | | — | | | — | | | 1,453 | | | 427,057 | |
| Operating lease right-of-use assets | 10,430 | | | — | | | — | | | — | | | 10,430 | |
| Deferred tax assets | 566 | | | — | | | — | | | (1) | | | 565 | |
| Other long-term assets | 653 | | | — | | | — | | | — | | | 653 | |
Total assets | $ | 757,473 | | | $ | — | | | $ | — | | | $ | 1,500 | | | $ | 758,973 | |
| Liabilities and stockholders’ equity | | | | | | | | | |
| Current liabilities | | | | | | | | | |
| Accounts payable | $ | 18,201 | | | $ | — | | | $ | — | | | $ | — | | | $ | 18,201 | |
| Accrued liabilities | 14,290 | | | — | | | — | | | 300 | | | 14,590 | |
| Current portion of operating lease liabilities | 1,872 | | | — | | | — | | | — | | | 1,872 | |
| Income taxes payable | 381 | | | — | | | — | | | (381) | | | — | |
| Deferred revenue | 7,012 | | | — | | | — | | | — | | | 7,012 | |
| Current portion of long-term debt and other borrowings, net | 5,319 | | | — | | | — | | | — | | | 5,319 | |
Total current liabilities | 47,075 | | | — | | | — | | | (81) | | | 46,994 | |
Non-current liabilities | | | | | | | | | |
| Deferred tax liabilities | 29,926 | | | 2,497 | | | — | | | 1,031 | | | 33,454 | |
| Warrant liability | 33 | | | — | | | — | | | — | | | 33 | |
| Non-current portion of operating lease liabilities | 9,501 | | | — | | | — | | | — | | | 9,501 | |
| Long-term debt and other borrowings, net | 414,683 | | | — | | | — | | | — | | | 414,683 | |
| Other long-term liabilities | 4,794 | | | 2,013 | | | 1,493 | | | 285 | | | 8,585 | |
Total liabilities | $ | 506,012 | | | $ | 4,510 | | | $ | 1,493 | | | $ | 1,235 | | | $ | 513,250 | |
| Stockholders’ equity | | | | | | | | | |
| Common stock | $ | 8 | | | $ | — | | | $ | — | | | $ | — | | | $ | 8 | |
| Additional paid-in capital | 432,897 | | | — | | | — | | | (331) | | | 432,566 | |
| Accumulated other comprehensive loss | (8,491) | | | 403 | | | — | | | (86) | | | (8,174) | |
| Accumulated deficit | (172,953) | | | (4,913) | | | (1,493) | | | 682 | | | (178,677) | |
Total stockholders’ equity | $ | 251,461 | | | $ | (4,510) | | | $ | (1,493) | | | $ | 265 | | | $ | 245,723 | |
Total liabilities and stockholders’ equity | $ | 757,473 | | | $ | — | | | $ | — | | | $ | 1,500 | | | $ | 758,973 | |
KORE Group Holdings, Inc. and Subsidiaries
Consolidated Statements of Operations (Unaudited)
(In thousands USD, except share and per share amounts)
| | | | | | | | | | | | | | | | | | | | | | | | | | | | | |
| For the three months ended | | | | | | |
| September 30, 2022 | | | | | | |
| As previously reported | | Income tax adjustments | | Indirect tax adjustments | | Other adjustments | | Revised |
| Revenue | | | | | | | | | |
| Services | $ | 46,410 | | | $ | — | | | $ | — | | | $ | 38 | | | $ | 46,448 | |
| Products | 20,230 | | | — | | | — | | | (541) | | | 19,689 | |
Total revenue | 66,640 | | | — | | | — | | | (503) | | | 66,137 | |
Cost of revenue | | | | | | | | | |
| Cost of services | 16,609 | | | — | | | — | | | (28) | | | 16,581 | |
| Cost of products | 14,960 | | | — | | | — | | | — | | | 14,960 | |
Total cost of revenue (exclusive of depreciation and amortization shown separately below) | 31,569 | | | — | | | — | | | (28) | | | 31,541 | |
Operating expenses | | | | | | | | | |
| Selling, general and administrative | 28,841 | | | — | | | 79 | | | (16) | | | 28,904 | |
| Depreciation and amortization | 13,709 | | | — | | | — | | | (21) | | | 13,688 | |
Total operating expenses | 42,550 | | | — | | | 79 | | | (37) | | | 42,592 | |
Operating loss | (7,479) | | | — | | | (79) | | | (438) | | | (7,996) | |
| Interest expense, including amortization of deferred financing costs, net | 8,206 | | | — | | | — | | | — | | | 8,206 | |
| Change in fair value of warrant liability | (120) | | | — | | | — | | | — | | | (120) | |
Loss before income taxes | (15,565) | | | — | | | (79) | | | (438) | | | (16,082) | |
| Income tax expense (benefit) | (2,540) | | | 808 | | | — | | | (73) | | | (1,805) | |
Net loss | $ | (13,025) | | | (808) | | | (79) | | | (365) | | | (14,277) | |
Loss per share: | | | | | | | | | |
| Basic | $ | (0.17) | | | $ | (0.01) | | | $ | — | | | $ | — | | | $ | (0.19) | |
| Diluted | $ | (0.17) | | | $ | (0.01) | | | $ | — | | | $ | — | | | $ | (0.19) | |
Weighted average number of shares outstanding: | | | | | | | | | |
| Basic | 76,240,530 | | — | | | — | | | — | | | 76,240,530 | |
| Diluted | 76,240,530 | | — | | | — | | | — | | | 76,240,530 | |
KORE Group Holdings, Inc. and Subsidiaries
Consolidated Statements of Operations (Unaudited)
(In thousands USD, except share and per share amounts)
| | | | | | | | | | | | | | | | | | | | | | | | | | | | | |
| For the nine months ended | | | | | | |
| September 30, 2022 | | | | | | |
| As previously reported | | Income tax adjustments | | Indirect tax adjustments | | Other adjustments | | Revised |
| Revenue | | | | | | | | | |
| Services | $ | 141,694 | | | $ | — | | | $ | — | | | $ | 102 | | | $ | 141,796 | |
| Products | 64,240 | | | — | | | — | | | — | | | 64,240 | |
Total revenue | 205,934 | | | — | | | — | | | 102 | | | 206,036 | |
| Cost of revenue | | | | | | | | | |
| Cost of services | 50,714 | | | — | | | — | | | 26 | | | 50,740 | |
| Cost of products | 49,701 | | | — | | | — | | | — | | | 49,701 | |
Total cost of revenue (exclusive of depreciation and amortization shown separately below) | 100,415 | | | — | | | — | | | 26 | | | 100,441 | |
| Operating expenses | | | | | | | | | |
| Selling, general and administrative | 85,883 | | | — | | | 237 | | | (91) | | | 86,029 | |
| Depreciation and amortization | 40,679 | | | — | | | — | | | (63) | | | 40,616 | |
Total operating expenses | 126,562 | | | — | | | 237 | | | (154) | | | 126,645 | |
Operating loss | (21,043) | | | — | | | (237) | | | 230 | | | (21,050) | |
| Interest expense, including amortization of deferred financing costs, net | 22,127 | | | — | | | — | | | — | | | 22,127 | |
| Change in fair value of warrant liability | (253) | | | — | | | — | | | — | | | (253) | |
Loss before income taxes | (42,917) | | | — | | | (237) | | | 230 | | | (42,924) | |
| Income tax expense (benefit) | (7,844) | | | 1,529 | | | — | | | 30 | | | (6,285) | |
Net loss | $ | (35,073) | | | $ | (1,529) | | | $ | (237) | | | $ | 200 | | | $ | (36,639) | |
| Loss per share: | | | | | | | | | |
| Basic | $ | (0.46) | | | $ | (0.02) | | | $ | — | | | $ | — | | | $ | (0.48) | |
| Diluted | $ | (0.46) | | | $ | (0.02) | | | $ | — | | | $ | — | | | $ | (0.48) | |
Weighted average number of shares outstanding: | | | | | | | | | |
| Basic | 75,514,986 | | — | | | — | | | — | | | 75,514,986 | |
| Diluted | 75,514,986 | | — | | | — | | | — | | | 75,514,986 | |
KORE Group Holdings, Inc. and Subsidiaries
Consolidated Statements of Comprehensive Loss (Unaudited)
(In thousands USD)
| | | | | | | | | | | | | | | | | | | | | | | | | | | | | |
| For the three months ended | | | | | | |
| September 30, 2022 | | | | | | |
| As previously reported | | Income tax adjustments | | Indirect tax adjustments | | Other adjustments | | Revised |
Net loss | $ | (13,025) | | | $ | (808) | | | $ | (79) | | | $ | (365) | | | $ | (14,277) | |
Other comprehensive loss: | | | | | | | | | |
| Foreign currency translation adjustment | (2,417) | | | 202 | | | — | | | — | | | (2,215) | |
Comprehensive loss | $ | (15,442) | | | $ | (606) | | | $ | (79) | | | $ | (365) | | | $ | (16,492) | |
| | | | | | | | | | | | | | | | | | | | | | | | | | | | | |
| For the nine months ended |
| September 30, 2022 |
| As previously reported | | Income tax adjustments | | Indirect tax adjustments | | Other adjustments | | Revised |
Net loss | $ | (35,073) | | | $ | (1,529) | | | $ | (237) | | | $ | 200 | | | $ | (36,639) | |
| Other comprehensive loss: | | | | | | | | | |
| Foreign currency translation adjustment | (5,160) | | | 449 | | | — | | | — | | | (4,711) | |
Comprehensive loss | $ | (40,233) | | | $ | (1,080) | | | $ | (237) | | | $ | 200 | | | $ | (41,350) | |
KORE Group Holdings, Inc. and Subsidiaries
Consolidated Statements of Stockholders’ Equity (Unaudited)
(In thousands, USD)
| | | | | | | | | | | | | | | | | | | | | | | | | | | | | | | | | | | |
| Common Stock | | Additional
Paid-in Capital | | Accumulated
Other
Comprehensive
Loss | | Accumulated
Deficit | | Total
Stockholders’
Equity |
| Shares | | Amount | | Amount | | Amount | | Amount | | Amount |
| As Reported | | | | | | | | | | | |
Balance at December 31, 2021 | 72,027,743 | | | $ | 7 | | | $ | 413,646 | | | $ | (3,331) | | | $ | (138,179) | | | $ | 272,143 | |
Opening balance sheet adjustment (as previously reported) | — | | | — | | | (11,613) | | | — | | | 299 | | | (11,314) | |
Balance at December 31, 2021 - As adjusted | 72,027,743 | | | 7 | | | 402,033 | | | (3,331) | | | (137,880) | | | 260,829 | |
| Foreign currency translation adjustment | — | | | — | | | — | | | (184) | | | — | | | (184) | |
| Stock-based compensation | — | | | — | | | 2,050 | | | — | | | — | | | 2,050 | |
| Common stock issued pursuant to acquisition | 4,212,246 | | | 1 | | | 23,294 | | | — | | | — | | | 23,295 | |
| Net loss | — | | | — | | | — | | | — | | | (10,907) | | | (10,907) | |
Balance at March 31, 2022 | 76,239,989 | | | 8 | | | 427,377 | | | (3,515) | | | (148,787) | | | 275,083 | |
| Foreign currency translation adjustment | — | | | — | | | — | | | (2,559) | | | — | | | (2,559) | |
| Stock-based compensation | — | | | — | | | 2,501 | | | — | | | — | | | 2,501 | |
| Net loss | — | | | — | | | — | | | — | | | (11,141) | | | (11,141) | |
Balance at June 30, 2022 | 76,239,989 | | | 8 | | | 429,878 | | | (6,074) | | | (159,928) | | | 263,884 | |
| Foreign currency translation adjustment | — | | | — | | | — | | | (2,417) | | | — | | | (2,417) | |
| Stock-based compensation | — | | | — | | | 3,019 | | | — | | | — | | | 3,019 | |
| Vesting of restricted stock units | 52,252 | | | — | | | — | | | — | | | — | | | — | |
| Net loss | — | | | — | | | — | | | — | | | (13,025) | | | (13,025) | |
Balance at September 30, 2022 | 76,292,241 | | | 8 | | | 432,897 | | | (8,491) | | | (172,953) | | | 251,461 | |
| | | | | | | | | | | |
| Adjustments | | | | | | | | | | | |
| Balance, December 31, 2021 | — | | | — | | | (331) | | | (132) | | | (4,158) | | | (4,621) | |
March 31, 2022 | — | | | — | | | — | | | — | | | — | | | — | |
| Foreign currency translation adjustment | — | | | — | | | — | | | 61 | | | — | | | 61 | |
| Net loss | — | | | — | | | — | | | — | | | (665) | | | (665) | |
Total Adjustments - March 31, 2022 | — | | | — | | | (331) | | | (71) | | | (4,823) | | | (5,225) | |
June 30, 2022 | | | | | | | | | | | |
| Foreign currency translation adjustment | — | | | — | | | — | | | 186 | | | — | | | 186 | |
| | | | | | | | | | | | | | | | | | | | | | | | | | | | | | | | | | | |
| Net loss | — | | | — | | | — | | | — | | | 351 | | | 351 | |
Total Adjustments - June 30, 2022 | — | | | — | | | (331) | | | 115 | | | (4,472) | | | (4,688) | |
September 30, 2022 | | | | | | | | | | | |
| Foreign currency translation adjustment | — | | | — | | | — | | | 202 | | | — | | | 202 | |
| Net loss | — | | | — | | | — | | | — | | | (1,252) | | | (1,252) | |
Total Adjustments - September 30, 2022 | — | | | — | | | (331) | | | 317 | | | (5,724) | | | (5,738) | |
| | | | | | | | | | | |
| As Revised | | | | | | | | | | | |
Balance at December 31, 2021 | 72,027,743 | | | 7 | | | 413,315 | | | (3,463) | | | (142,337) | | | 267,522 | |
Opening balance sheet adjustment (as previously reported) | — | | | — | | | (11,613) | | | — | | | 299 | | | (11,314) | |
Balance at December 31, 2021 | 72,027,743 | | | $ | 7 | | | $ | 401,702 | | | $ | (3,463) | | | $ | (142,038) | | | $ | 256,208 | |
| Foreign currency translation adjustment | — | | | — | | | — | | | (123) | | | — | | | (123) | |
| Stock-based compensation | — | | | — | | | 2,050 | | | — | | | — | | | 2,050 | |
| Common stock issued pursuant to acquisition | 4,212,246 | | | 1 | | | 23,294 | | | — | | | — | | | 23,295 | |
| Net loss | — | | | — | | | — | | | — | | | (11,572) | | | (11,572) | |
Balance at March 31, 2022 | 76,239,989 | | | $ | 8 | | | $ | 427,046 | | | $ | (3,586) | | | $ | (153,610) | | | $ | 269,858 | |
| Foreign currency translation adjustment | — | | | — | | | — | | | (2,373) | | | — | | | (2,373) | |
| Stock-based compensation | — | | | — | | | 2,501 | | | — | | | — | | | 2,501 | |
| Net loss | — | | | — | | | — | | | — | | | (10,790) | | | (10,790) | |
Balance at June 30, 2022 | 76,239,989 | | | $ | 8 | | | $ | 429,547 | | | $ | (5,959) | | | $ | (164,400) | | | $ | 259,196 | |
| Foreign currency translation adjustment | — | | | — | | | — | | | (2,215) | | | — | | | (2,215) | |
| Stock-based compensation | — | | | — | | | 3,019 | | | — | | | — | | | 3,019 | |
| Vesting of restricted stock units | 52,252 | | | — | | | — | | | — | | | — | | | — | |
| Net loss | — | | | — | | | — | | | — | | | (14,277) | | | (14,277) | |
Balance at September 30, 2022 | 76,292,241 | | | $ | 8 | | | $ | 432,566 | | | $ | (8,174) | | | $ | (178,677) | | | $ | 245,723 | |
KORE Group Holdings, Inc. and Subsidiaries
Consolidated Statements of Cash Flows (Unaudited)
(In thousands USD)
| | | | | | | | | | | | | | | | | | | | | | | | | | | | | |
| For the nine months ended | | | | | | |
| September 30, 2022 | | | | | | |
| As previously reported | | Income tax adjustments | | Indirect tax adjustments | | Other adjustments | | Revised |
| Cash flows from operating activities | | | | | | | | | |
| Net loss | $ | (35,073) | | | $ | (1,529) | | | $ | (237) | | | $ | 200 | | | $ | (36,639) | |
| Adjustments to reconcile net loss to net cash provided by operating activities | | | | | | | | | |
| Depreciation and amortization | 40,679 | | | — | | | — | | | (63) | | | 40,616 | |
| Amortization of deferred financing costs | 1,806 | | | — | | | — | | | — | | | 1,806 | |
| Non-cash reduction to the operating lease right-of-use assets | 1,678 | | | — | | | — | | | — | | | 1,678 | |
| Deferred income taxes | (10,875) | | | 1,028 | | | — | | | 1,264 | | | (8,583) | |
| Non-cash foreign currency loss (gain) | 1,566 | | | — | | | — | | | — | | | 1,566 | |
| Stock-based compensation | 7,570 | | | — | | | — | | | — | | | 7,570 | |
| Provision for doubtful accounts | 424 | | | — | | | — | | | — | | | 424 | |
| Change in fair value of warrant liability | (253) | | | — | | | — | | | — | | | (253) | |
| Change in operating assets and liabilities, net of operating assets and liabilities acquired: | | | | | | | | | |
| Accounts receivable | 11,155 | | | — | | | — | | | (164) | | | 10,991 | |
| Inventories | 8,192 | | | — | | | — | | | — | | | 8,192 | |
| Prepaid expenses and other current assets | (1,934) | | | — | | | — | | | 301 | | | (1,633) | |
| Accounts payable and accrued liabilities | (3,756) | | | 501 | | | 237 | | | (316) | | | (3,334) | |
| Deferred revenue | 252 | | | — | | | — | | | — | | | 252 | |
| Income taxes payable | 144 | | | — | | | — | | | (1,222) | | | (1,078) | |
| Operating lease liabilities | (1,048) | | | — | | | — | | | — | | | (1,048) | |
Net cash provided by operating activities | $ | 20,527 | | | $ | — | | | $ | — | | | $ | — | | | $ | 20,527 | |
| | | | | | | | | |
| | | | | | | | | |
| | | | | | | | | |
| | | | | | | | | |
Net cash used in investing activities | $ | (57,974) | | | $ | — | | | $ | — | | | $ | — | | | $ | (57,974) | |
| | | | | | | | | |
| | | | | | | | | |
| | | | | | | | | |
| | | | | | | | | |
| | | | | | | | | |
| | | | | | | | | |
Net cash used in financing activities | $ | (3,599) | | | $ | — | | | $ | — | | | $ | — | | | $ | (3,599) | |
| Effect of exchange rate change on cash | (2,014) | | | — | | | — | | | — | | | (2,014) | |
| Change in cash and restricted cash | (43,060) | | | — | | | — | | | — | | | (43,060) | |
Cash and restricted cash, beginning of period | 86,343 | | | — | | | — | | | — | | | 86,343 | |
Cash and restricted cash, end of period | $ | 43,283 | | | $ | — | | | $ | — | | | $ | — | | | $ | 43,283 | |
| | | | | | | | | |
| | | | | | | | | |
| | | | | | | | | |
| | | | | | | | | |
| | | | | | | | | |
| | | | | | | | | |
| | | | | | | | | |
| | | | | | | | | |
| | | | | | | | | |
KORE Group Holdings, Inc. and Subsidiaries
Condensed Consolidated Balance Sheets
(In thousands USD, except share amounts)
| | | | | | | | | | | | | | | | | | | | | | | | | | | | | |
| March 31, 2021 | | | | | | |
| As previously reported | | Income tax adjustments | | Indirect tax adjustments | | Other adjustments | | Revised |
| Assets | | | | | | | | | |
| Current assets | | | | | | | | | |
| Cash | $ | 13,134 | | | — | | | — | | | — | | | $ | 13,134 | |
| Accounts receivable, net | 42,210 | | | — | | | — | | | 148 | | | 42,358 | |
| Inventories, net | 6,627 | | | — | | | — | | | — | | | 6,627 | |
| Prepaid expenses and other receivables | 10,811 | | | — | | | — | | | (903) | | | 9,908 | |
| Income taxes receivable | 324 | | | — | | | — | | | 3 | | | 327 | |
Total current assets | 73,106 | | | — | | | — | | | (752) | | | 72,354 | |
Non-current assets | | | | | | | | | |
| Restricted cash | 372 | | | — | | | — | | | — | | | 372 | |
| Property and equipment, net | 13,338 | | | — | | | — | | | — | | | 13,338 | |
| Intangibles assets, net | 229,926 | | | — | | | — | | | (987) | | | 228,939 | |
| Goodwill | 382,283 | | | — | | | — | | | 1,453 | | | 383,736 | |
| Operating lease right-of-use assets | 122 | | | — | | | — | | | — | | | 122 | |
| Other long-term assets | 2,595 | | | — | | | — | | | — | | | 2,595 | |
Total assets | $ | 701,742 | | | $ | — | | | $ | — | | | $ | (286) | | | $ | 701,456 | |
| Liabilities and stockholders’ equity | | | | | | | | | |
Current liabilities | | | | | | | | | |
| Bank indebtedness | $ | 20,000 | | | $ | — | | | $ | — | | | $ | — | | | $ | 20,000 | |
| Accounts payable | 19,515 | | | — | | | — | | | — | | | 19,515 | |
| Accrued liabilities | 8,685 | | | — | | | — | | | 1,078 | | | 9,763 | |
| Income tax payable | 730 | | | — | | | — | | | (20) | | | 710 | |
| Current portion of operating lease liabilities | 504 | | | — | | | — | | | — | | | 504 | |
| Deferred revenue | 7,634 | | | — | | | — | | | — | | | 7,634 | |
| Current portion of long-term debt and other borrowings, net | 3,153 | | | — | | | — | | | — | | | 3,153 | |
Total current liabilities | 60,221 | | | — | | | — | | | 1,058 | | | 61,279 | |
| Non-current liabilities | | | | | | | | | |
| Deferred tax liabilities | 41,393 | | | 1,326 | | | — | | | (344) | | | 42,375 | |
| Due to related parties | 1,539 | | | — | | | — | | | — | | | 1,539 | |
| Warrant Liability | 13,520 | | | — | | | — | | | — | | | 13,520 | |
| Long-term portion of capital lease obligations | 420 | | | — | | | — | | | — | | | 420 | |
| Long-term debt | 298,010 | | | — | | | — | | | — | | | 298,010 | |
| Other long-term liabilities | 4,194 | | | 1,658 | | | 914 | | | 36 | | | 6,802 | |
Total liabilities | $ | 419,297 | | | $ | 2,984 | | | $ | 914 | | | $ | 750 | | | $ | 423,945 | |
| | | | | | | | | |
| | | | | | | | | |
| | | | | | | | | |
| | | | | | | | | |
| | | | | | | | | |
| Total temporary equity | $ | 271,288 | | | $ | — | | | $ | — | | | $ | (300) | | | $ | 270,988 | |
Stockholders’ equity | | | | | | | | | |
| Common stock | $ | 3 | | | $ | — | | | $ | — | | | $ | — | | | $ | 3 | |
| Additional paid-in capital | 128,538 | | | — | | | — | | | — | | | 128,538 | |
| Accumulated other comprehensive loss | (2,577) | | | (95) | | | — | | | 214 | | | (2,458) | |
| Accumulated deficit | (114,807) | | | (2,889) | | | (914) | | | (950) | | | (119,560) | |
Total stockholders’ equity | $ | 11,157 | | | $ | (2,984) | | | $ | (914) | | | $ | (736) | | | $ | 6,523 | |
Total liabilities and stockholders’ equity | $ | 701,742 | | | $ | — | | | $ | — | | | $ | (286) | | | $ | 701,456 | |
KORE Group Holdings, Inc. and Subsidiaries
Condensed Consolidated Statements of Operations
(In thousands USD, except share and per share amounts) (unaudited)
| | | | | | | | | | | | | | | | | | | | | | | | | | | | | |
| For the three months ended | | | | | | |
| March 31, 2021 | | | | | | |
| As previously reported | | Income tax adjustments | | Indirect tax adjustments | | Other adjustments | | Revised |
| Revenue | | | | | | | | | |
| Services | $ | 45,062 | | | $ | — | | | $ | — | | | $ | 55 | | | $ | 45,117 | |
| Products | 10,235 | | | — | | | — | | | — | | | 10,235 | |
Total revenue | 55,297 | | | — | | | — | | | 55 | | | 55,352 | |
Cost of revenue | | | | | | | | | |
| Cost of services | 16,211 | | | — | | | — | | | (268) | | | 15,943 | |
| Cost of products | 8,161 | | | — | | | — | | | (235) | | | 7,926 | |
Total cost of revenue (exclusive of depreciation and amortization shown separately below) | 24,372 | | | — | | | — | | | (503) | | | 23,869 | |
Operating expenses | | | | | | | | | |
| Selling, general and administrative | 17,521 | | | — | | | 114 | | | 1,375 | | | 19,010 | |
| Depreciation and amortization | 13,114 | | | — | | | — | | | (21) | | | 13,093 | |
Total operating expenses | 30,635 | | | — | | | 114 | | | 1,354 | | | 32,103 | |
Operating income (loss) | 290 | | | — | | | (114) | | | (796) | | | (620) | |
| Interest expense, including amortization of deferred financing costs, net | 5,059 | | | — | | | — | | | — | | | 5,059 | |
| Change in fair value of warrant liability | (2,424) | | | — | | | — | | | — | | | (2,424) | |
Loss before income taxes | (2,345) | | | — | | | (114) | | | (796) | | | (3,255) | |
| Income tax expense (benefit) | (1,264) | | | 238 | | | — | | | (230) | | | (1,256) | |
Net loss | $ | (1,081) | | | $ | (238) | | | $ | (114) | | | $ | (566) | | | $ | (1,999) | |
| Loss per share: | | | | | | | | | |
| Basic | $ | (0.27) | | | $ | (0.01) | | | $ | — | | | $ | (0.02) | | | $ | (0.30) | |
| Diluted | $ | (0.27) | | | $ | (0.01) | | | $ | — | | | $ | (0.02) | | | $ | (0.30) | |
| Weighted average number of shares outstanding: | | | | | | | | | |
| Basic | 31,647,131 | | — | | | — | | | — | | | 31,647,131 | |
| Diluted | 31,647,131 | | — | | | — | | | — | | | 31,647,131 | |
KORE Group Holdings, Inc. and Subsidiaries
Condensed Consolidated Statements of Comprehensive Loss
(In thousands USD) (unaudited)
| | | | | | | | | | | | | | | | | | | | | | | | | | | | | |
| For the three months ended | | | | | | |
| March 31, 2021 | | | | | | |
| As previously reported | | Income tax adjustments | | Indirect tax adjustments | | Other adjustments | | Revised |
Net loss | $ | (1,081) | | | $ | (238) | | | $ | (114) | | | $ | (566) | | | $ | (1,999) | |
| Other comprehensive loss: | | | | | | | | | |
| Foreign currency translation adjustment | (900) | | | 4 | | | — | | | — | | | (896) | |
Comprehensive loss | $ | (1,981) | | | $ | (234) | | | $ | (114) | | | $ | (566) | | | $ | (2,895) | |
KORE Group Holdings, Inc. and Subsidiaries
Condensed Consolidated Statements of Temporary Equity and Stockholders’ Equity
(In thousands, USD, except share amounts) (unaudited)
| | | | | | | | | | | | | | | | | | | | | | | | | | | | | | | | | | | | | | | | | | | | | | | | | | | | | | | | | | | | | | | | | | | | | | | | | | | | | | | | | | | | | | | | | | | | |
| Series A Preferred Stock | | Series A-1 Preferred Stock | | Series B Preferred Stock | | Series C Convertible Preferred Stock | | Total Temporary Equity | | | Common Stock | | Additional paid-in capital | | Accumulated Other Comprehensive Income (Loss) | | Accumulated Deficit | | Total Stockholders’ Equity |
| Temporary Equity | | | | | | | | | | | | | |
| Shares | | Amount | | Shares | | Amount | | Shares | | Amount | | Shares | | Amount | | Amount | | | Shares | | Amount | | Amount | | Amount | | Amount | | Amount |
| As Reported | | | | | | | | | | | | | | | | | | | | | | | | | | | | | | |
Balance at December 31, 2020 (as previously reported) | 7,756,158 | | | $ | 77,562 | | | 7,862,107 | | | $ | 78,621 | | | 9,090,975 | | | $ | 90,910 | | | 2,566,186 | | | $ | 16,802 | | | $ | 263,895 | | | | 30,281,520 | | | $ | 3 | | | $ | 135,616 | | | $ | (1,677) | | | $ | (113,726) | | | $ | 20,216 | |
| Accrued dividends payable | 248,622 | | | 2,486 | | | 266,558 | | | 2,666 | | | 224,161 | | | 2,241 | | | — | | | — | | | 7,393 | | | | — | | | — | | | (7,393) | | | — | | | — | | | (7,393) | |
| Foreign currency translation adjustment | — | | | — | | | — | | | — | | | — | | | — | | | — | | | — | | | — | | | | — | | | — | | | — | | | (900) | | | — | | | (900) | |
| Stock-based compensation | — | | | — | | | — | | | — | | | — | | | — | | | — | | | — | | | — | | | | — | | | — | | | 315 | | | — | | | — | | | 315 | |
| Net loss | — | | | — | | | — | | | — | | | — | | | — | | | — | | | — | | | — | | | | — | | | — | | | — | | | — | | | (1,081) | | | (1,081) | |
Balance at March 31, 2021 | 8,004,780 | | | 80,048 | | | 8,128,665 | | | 81,287 | | | 9,315,136 | | | 93,151 | | | 2,566,186 | | | 16,802 | | | 271,288 | | | | 30,281,520 | | | 3 | | | 128,538 | | | (2,577) | | | (114,807) | | | 11,157 | |
| | | | | | | | | | | | | | | | | | | | | | | | | | | | | | |
| Adjustments | | | | | | | | | | | | | | | | | | | | | | | | | | | | | | |
| Balance, December 31, 2020 | — | | | — | | | — | | | — | | | — | | | — | | | (45,818) | | | (300) | | | (300) | | | | — | | | — | | | — | | | 115 | | | (3,835) | | | (3,720) | |
| March 31, 2021 | | | | | | | | | | | | | | | | | | | | — | | | — | | | — | | | — | | | — | | | — | |
| Foreign currency translation adjustment | — | | | — | | | — | | | — | | | — | | | — | | | — | | | — | | | — | | | | — | | | — | | | — | | | 4 | | | — | | | 4 | |
| Net loss | — | | | — | | | — | | | — | | | — | | | — | | | — | | | — | | | — | | | | — | | | — | | | — | | | — | | | (918) | | | (918) | |
| Total Adjustments - March 31, 2021 | — | | | — | | | — | | | — | | | — | | | — | | | (45,818) | | | (300) | | | (300) | | | | — | | | — | | | — | | | 119 | | | (4,753) | | | (4,634) | |
| | | | | | | | | | | | | | | | | | | | | | | | | | | | | | |
| As Revised | | | | | | | | | | | | | | | | | | | | | | | | | | | | | | |
| Balance at December 31, 2020 | 7,756,158 | | | 77,562 | | | 7,862,107 | | | 78,621 | | | 9,090,975 | | | 90,910 | | | 2,520,368 | | | 16,502 | | | 263,595 | | | | 30,281,520 | | | 3 | | | 135,616 | | | (1,562) | | | (117,561) | | | 16,496 | |
| Accrued dividends payable | 248,622 | | | 2,486 | | | 266,558 | | | 2,666 | | | 224,161 | | | 2,241 | | | — | | | — | | | 7,393 | | | | — | | | — | | | (7,393) | | | — | | | — | | | (7,393) | |
| Foreign currency translation adjustment | — | | | — | | | — | | | — | | | — | | | — | | | — | | | — | | | — | | | | — | | | — | | | — | | | (896) | | | — | | | (896) | |
| Stock-based compensation | — | | | — | | | — | | | — | | | — | | | — | | | — | | | — | | | — | | | | — | | | — | | | 315 | | | — | | | — | | | 315 | |
| Net loss | — | | | — | | | — | | | — | | | — | | | — | | | — | | | — | | | — | | | | — | | | — | | | — | | | — | | | (1,999) | | | (1,999) | |
| Balance at March 31, 2021 | 8,004,780 | | | $ | 80,048 | | | 8,128,665 | | | $ | 81,287 | | | 9,315,136 | | | $ | 93,151 | | | 2,520,368 | | | $ | 16,502 | | | $ | 270,988 | | | | 30,281,520 | | | $ | 3 | | | $ | 128,538 | | | $ | (2,458) | | | $ | (119,560) | | | $ | 6,523 | |
KORE Group Holdings, Inc. and Subsidiaries
Condensed Consolidated Statements of Cash Flows
(In thousands USD) (unaudited)
| | | | | | | | | | | | | | | | | | | | | | | | | | | | | |
| For the three months ended | | | | | | |
| March 31, 2021 | | | | | | |
| As previously reported | | Income tax adjustments | | Indirect tax adjustments | | Other adjustments | | Revised |
| Cash flows from operating activities | | | | | | | | | |
| Net loss | $ | (1,081) | | | $ | (238) | | | $ | (114) | | | $ | (566) | | | $ | (1,999) | |
| Adjustments to reconcile net loss to net cash used in operating activities | | | | | | | | | |
| Depreciation and amortization | 13,114 | | | — | | | — | | | (21) | | | 13,093 | |
| Amortization of deferred financing costs | 524 | | | — | | | — | | | — | | | 524 | |
| Deferred income taxes | (1,366) | | | 238 | | | — | | | (259) | | | (1,387) | |
| Non-cash foreign currency loss | (70) | | | — | | | — | | | — | | | (70) | |
| Share-based compensation | 315 | | | — | | | — | | | — | | | 315 | |
| Provision for doubtful accounts | (18) | | | — | | | — | | | — | | | (18) | |
| Change in fair value of warrant liability | (2,424) | | | — | | | — | | | — | | | (2,424) | |
| Change in operating assets and liabilities, net of operating assets and liabilities acquired: | | | | | | | | | |
| Accounts receivable | (1,855) | | | — | | | — | | | (55) | | | (1,910) | |
| Inventories | (878) | | | — | | | — | | | — | | | (878) | |
| Prepaid expenses and other receivables | (5,375) | | | — | | | — | | | 1,274 | | | (4,101) | |
| Accounts payable and accrued liabilities | (13,311) | | | — | | | 114 | | | (365) | | | (13,562) | |
| Deferred revenue | (81) | | | — | | | — | | | — | | | (81) | |
| Income taxes payable | 186 | | | — | | | — | | | (8) | | | 178 | |
Net cash used in operating activities | $ | (12,320) | | | $ | — | | | $ | — | | | $ | — | | | $ | (12,320) | |
| | | | | | | | | |
| | | | | | | | | |
| | | | | | | | | |
Net cash used in investing activities | $ | (3,091) | | | $ | — | | | $ | — | | | $ | — | | | $ | (3,091) | |
| | | | | | | | | |
| | | | | | | | | |
| | | | | | | | | |
| | | | | | | | | |
| | | | | | | | | |
| | | | | | | | | |
Net cash provided financing activities | $ | 18,291 | | | $ | — | | | $ | — | | | $ | — | | | $ | 18,291 | |
| Effect of Exchange Rate Change on Cash and Restricted Cash | (67) | | | — | | | — | | | — | | | (67) | |
| Change in Cash and Restricted Cash | 2,813 | | | — | | | — | | | — | | | 2,813 | |
Cash and Restricted Cash, beginning of period | 10,693 | | | — | | | — | | | — | | | 10,693 | |
Cash and Restricted Cash, end of period | $ | 13,506 | | | $ | — | | | $ | — | | | $ | — | | | $ | 13,506 | |
| | | | | | | | | |
| | | | | | | | | |
| | | | | | | | | |
| | | | | | | | | |
| | | | | | | | | |
| | | | | | | | | |
| | | | | | | | | |
| | | | | | | | | |
KORE Group Holdings, Inc. and Subsidiaries
Condensed Consolidated Balance Sheets
(In thousands USD, except share amounts)
| | | | | | | | | | | | | | | | | | | | | | | | | | | | | |
| June 30, 2021 | | | | | | |
| As previously reported | | Income tax adjustments | | Indirect tax adjustments | | Other adjustments | | Revised |
| Assets | | | | | | | | | |
| Current assets | | | | | | | | | |
| Cash | $ | 8,300 | | | $ | — | | | $ | — | | | $ | — | | | $ | 8,300 | |
| Accounts receivable, net | 47,639 | | | — | | | — | | | 202 | | | 47,841 | |
| Inventories, net | 9,864 | | | — | | | — | | | — | | | 9,864 | |
| Prepaid expenses and other receivables | 14,246 | | | — | | | — | | | 480 | | | 14,726 | |
| Income taxes receivable | 441 | | | — | | | — | | | 283 | | | 724 | |
Total current assets | 80,490 | | | — | | | — | | | 965 | | | 81,455 | |
Non-current assets | | | | | | | | | |
| Restricted cash | 371 | | | — | | | — | | | — | | | 371 | |
| Property and equipment, net | 12,606 | | | — | | | — | | | — | | | 12,606 | |
| Intangibles assets, net | 221,990 | | | — | | | — | | | (966) | | | 221,024 | |
| Goodwill | 382,427 | | | — | | | — | | | 1,453 | | | 383,880 | |
| Operating lease right-of-use assets | 119 | | | — | | | — | | | — | | | 119 | |
| Other long-term assets | 3,531 | | | — | | | — | | | — | | | 3,531 | |
Total assets | 701,534 | | | — | | | — | | | 1,452 | | | 702,986 | |
| Liabilities and stockholders’ equity | | | | | | | | | |
| Current liabilities | | | | | | | | | |
| Bank indebtedness | $ | 22,000 | | | $ | — | | | $ | — | | | $ | — | | | $ | 22,000 | |
| Accounts payable | 23,181 | | | — | | | — | | | — | | | 23,181 | |
| Accrued liabilities | 12,496 | | | — | | | — | | | 881 | | | 13,377 | |
| Income taxes payable | 640 | | | — | | | — | | | — | | | 640 | |
| Current portion of operating lease liabilities | 641 | | | — | | | — | | | — | | | 641 | |
| Deferred revenue | 7,074 | | | — | | | — | | | — | | | 7,074 | |
| Current portion of long-term debt and other borrowings, net | 3,153 | | | — | | | — | | | — | | | 3,153 | |
Total current liabilities | 69,185 | | | — | | | — | | | 881 | | | 70,066 | |
| Non-current liabilities | | | | | | | | | |
| Deferred tax liabilities | 38,474 | | | 1,378 | | | — | | | 610 | | | 40,462 | |
| Due to related parties | 1,565 | | | — | | | — | | | — | | | 1,565 | |
| Warrant Liability | 13,561 | | | — | | | — | | | — | | | 13,561 | |
| Long-term portion of capital lease obligations | 362 | | | — | | | — | | | — | | | 362 | |
| Long-term debt | 297,773 | | | — | | | — | | | — | | | 297,773 | |
| Other long-term liabilities | 4,296 | | | 1,796 | | | 1,028 | | | 35 | | | 7,155 | |
Total liabilities | $ | 425,216 | | | $ | 3,174 | | | $ | 1,028 | | | $ | 1,526 | | | $ | 430,944 | |
| | | | | | | | | |
| | | | | | | | | |
| | | | | | | | | |
| | | | | | | | | |
| | | | | | | | | |
Total temporary equity | $ | 278,520 | | | $ | — | | | $ | — | | | $ | — | | | $ | 278,520 | |
| Stockholders’ equity | | | | | | | | | |
| | | | | | | | | | | | | | | | | | | | | | | | | | | | | |
| Common stock | 3 | | | — | | | — | | | — | | | 3 | |
| Additional paid-in capital | 121,321 | | | — | | | — | | | — | | | 121,321 | |
| Accumulated other comprehensive loss | (1,834) | | | (120) | | | — | | | (86) | | | (2,040) | |
| Accumulated deficit | (121,692) | | | (3,054) | | | (1,028) | | | 12 | | | (125,762) | |
Total stockholders’ equity | $ | (2,202) | | | $ | (3,174) | | | $ | (1,028) | | | $ | (74) | | | $ | (6,478) | |
Total liabilities, temporary and stockholders’ equity | $ | 701,534 | | | $ | — | | | $ | — | | | $ | 1,452 | | | $ | 702,986 | |
KORE Group Holdings, Inc. and Subsidiaries
Condensed Consolidated Statements of Operations
(In thousands USD, except share and per share amounts) (unaudited)
| | | | | | | | | | | | | | | | | | | | | | | | | | | | | |
| For the three months ended | | | | | | |
| June 30, 2021 | | | | | | |
| As previously reported | | Income tax adjustments | | Indirect tax adjustments | | Other adjustments | | Revised |
| Revenue | | | | | | | | | |
| Services | $ | 46,375 | | | $ | — | | | $ | — | | | $ | 55 | | | $ | 46,430 | |
| Products | 14,368 | | | — | | | — | | | — | | | 14,368 | |
Total revenue | 60,743 | | | — | | | — | | | 55 | | | 60,798 | |
| Cost of revenue | | | | | | | | | |
| Cost of services | 17,826 | | | — | | | — | | | (202) | | | 17,624 | |
| Cost of products | 11,511 | | | — | | | — | | | — | | | 11,511 | |
Total cost of revenue (exclusive of depreciation and amortization shown separately below) | 29,337 | | | — | | | — | | | (202) | | | 29,135 | |
| Operating expenses | | | | | | | | | |
| Selling, general and administrative | 23,004 | | | — | | | 114 | | | (1,377) | | | 21,741 | |
| Depreciation and amortization | 12,393 | | | — | | | — | | | (21) | | | 12,372 | |
Total operating expenses | 35,397 | | | — | | | 114 | | | (1,398) | | | 34,113 | |
Operating income (loss) | (3,991) | | | — | | | (114) | | | 1,655 | | | (2,450) | |
| Interest expense, including amortization of deferred financing costs, net | 5,506 | | | — | | | — | | | — | | | 5,506 | |
| Change in fair value of warrant liability | 41 | | | — | | | — | | | — | | | 41 | |
Loss before income taxes | (9,538) | | | — | | | (114) | | | 1,655 | | | (7,997) | |
| Income tax expense (benefit) | (2,653) | | | 165 | | | — | | | 693 | | | (1,795) | |
Net loss | $ | (6,885) | | | $ | (165) | | | $ | (114) | | | $ | 962 | | | $ | (6,202) | |
| Loss per share: | | | | | | | | | |
| Basic | $ | (0.46) | | | $ | (0.01) | | | $ | — | | | $ | 0.03 | | | $ | (0.43) | |
| Diluted | $ | (0.46) | | | $ | (0.01) | | | $ | — | | | $ | 0.03 | | | $ | (0.43) | |
| Weighted average number of shares outstanding: | | | | | | | | | |
| Basic | 31,647,131 | | — | | | — | | | — | | | 31,647,131 | |
| Diluted | 31,647,131 | | — | | | — | | | — | | | 31,647,131 | |
KORE Group Holdings, Inc. and Subsidiaries
Condensed Consolidated Statements of Operations
(In thousands USD, except share and per share amounts) (unaudited)
| | | | | | | | | | | | | | | | | | | | | | | | | | | | | |
| For the six months ended | | | | | | |
| June 30, 2021 | | | | | | |
| As previously reported | | Income tax adjustments | | Indirect tax adjustments | | Other adjustments | | Revised |
| Revenue | | | | | | | | | |
| Services | $ | 91,437 | | | $ | — | | | $ | — | | | $ | 110 | | | $ | 91,547 | |
| Products | 24,603 | | | — | | | — | | | — | | | 24,603 | |
Total revenue | 116,040 | | | — | | | — | | | 110 | | | 116,150 | |
| Cost of revenue | | | | | | | | | |
| Cost of services | 34,037 | | | — | | | — | | | (470) | | | 33,567 | |
| Cost of products | 19,672 | | | — | | | — | | | (235) | | | 19,437 | |
Total cost of revenue (exclusive of depreciation and amortization shown separately below) | 53,709 | | | — | | | — | | | (705) | | | 53,004 | |
| Operating expenses | | | | | | | | | |
| Selling, general and administrative | 40,525 | | | — | | | 228 | | | (2) | | | 40,751 | |
| Depreciation and amortization | 25,507 | | | — | | | — | | | (42) | | | 25,465 | |
Total operating expenses | 66,032 | | | — | | | 228 | | | (44) | | | 66,216 | |
Operating income (loss) | (3,701) | | | — | | | (228) | | | 859 | | | (3,070) | |
| Interest expense, including amortization of deferred financing costs, net | 10,565 | | | — | | | — | | | — | | | 10,565 | |
| Change in fair value of warrant liability | (2,383) | | | — | | | — | | | — | | | (2,383) | |
Loss before income taxes | (11,883) | | | — | | | (228) | | | 859 | | | (11,252) | |
| Income tax expense (benefit) | (3,917) | | | 403 | | | — | | | 463 | | | (3,051) | |
Net loss | $ | (7,966) | | | $ | (403) | | | $ | (228) | | | $ | 396 | | | $ | (8,201) | |
| Loss per share: | | | | | | | | | |
| Basic | $ | (0.72) | | | $ | (0.01) | | | $ | (0.01) | | | $ | 0.01 | | | $ | (0.73) | |
| Diluted | $ | (0.72) | | | $ | (0.01) | | | $ | (0.01) | | | $ | 0.01 | | | $ | (0.73) | |
| Weighted average number of shares outstanding: | | | | | | | | | |
| Basic | 31,647,131 | | — | | | — | | | — | | | 31,647,131 | |
| Diluted | 31,647,131 | | — | | | — | | | — | | | 31,647,131 | |
KORE Group Holdings, Inc. and Subsidiaries
Condensed Consolidated Statements of Comprehensive Loss
(In thousands USD) (unaudited)
| | | | | | | | | | | | | | | | | | | | | | | | | | | | | |
| For the three months ended | | | | | | |
| June 30, 2021 | | | | | | |
| As previously reported | | Income tax adjustments | | Indirect tax adjustments | | Other adjustments | | Revised |
Net loss | (6,885) | | | (165) | | | (114) | | | 962 | | | (6,202) | |
| Other comprehensive loss: | | | | | | | | | |
| Foreign currency translation adjustment | 743 | | | (25) | | | — | | | (300) | | | 418 | |
Comprehensive loss | (6,142) | | | (190) | | | (114) | | | 662 | | | (5,784) | |
| | | | | | | | | | | | | | | | | | | | | | | | | | | | | |
| For the six months ended | | | | | | |
| June 30, 2021 | | | | | | |
| As previously reported | | Income tax adjustments | | Indirect tax adjustments | | Other adjustments | | Revised |
Net loss | (7,966) | | | (403) | | | (228) | | | 396 | | | (8,201) | |
| Other comprehensive loss: | | | | | | | | | |
| Foreign currency translation adjustment | (157) | | | (21) | | | — | | | (300) | | | (478) | |
Comprehensive loss | (8,123) | | | (424) | | | (228) | | | 96 | | | (8,679) | |
KORE Group Holdings, Inc. and Subsidiaries
Condensed Consolidated Statements of Stockholders’ Equity
(In thousands, USD, except share amounts) (unaudited)
| | | | | | | | | | | | | | | | | | | | | | | | | | | | | | | | | | | | | | | | | | | | | | | | | | | | | | | | | | | | | | | | | | | | | | | | | | | | | | | | | | | | | | | | | | |
| Series A Preferred Stock | | Series A-1 Preferred Stock | | Series B Preferred Stock | | Series C Convertible Preferred Stock | | Total Temporary Equity | | | Common Stock | | Additional paid-in capital | | Accumulated Other Comprehensive Income (Loss) | | Accumulated Deficit | | Total Stockholders’ Equity |
| | | | | | | | | | | | | | |
| Temporary Equity | | | | | | | | | | | | | |
| Shares | | Amount | | Shares | | Amount | | Shares | | Amount | | Shares | | Amount | | Amount | | | Shares | | Amount | | Amount | | Amount | | Amount | | Amount |
| As Reported | | | | | | | | | | | | | | | | | | | | | | | | | | | | | | |
| Balance at December 31, 2020 | 7,756,158 | | | $ | 77,562 | | | 7,862,107 | | | $ | 78,621 | | | 9,090,975 | | | $ | 90,910 | | | 2,566,186 | | | $ | 16,802 | | | $ | 263,895 | | | | 30,281,520 | | | $ | 3 | | | $ | 135,616 | | | $ | (1,677) | | | $ | (113,726) | | | $ | 20,216 | |
| Accrued dividends payable | 248,622 | | | 2,486 | | | 266,558 | | | 2,666 | | | 224,161 | | | 2,241 | | | — | | | — | | | 7,393 | | | | — | | | — | | | (7,393) | | | — | | | — | | | (7,393) | |
| Foreign currency translation adjustment | — | | | — | | | — | | | — | | | — | | | — | | | — | | | — | | | — | | | | — | | | — | | | — | | | (900) | | | — | | | (900) | |
| Stock-based compensation | — | | | — | | | — | | | — | | | — | | | — | | | — | | | — | | | — | | | | — | | | — | | | 315 | | | — | | | — | | | 315 | |
| Net loss | — | | | — | | | — | | | — | | | — | | | — | | | — | | | — | | | — | | | | — | | | — | | | — | | | — | | | (1,081) | | | (1,081) | |
| Balance at March 31, 2021 | 8,004,780 | | | 80,048 | | | 8,128,665 | | | 81,287 | | | 9,315,136 | | | 93,151 | | | 2,566,186 | | | 16,802 | | | 271,288 | | | | 30,281,520 | | | 3 | | | 128,538 | | | (2,577) | | | (114,807) | | | 11,157 | |
| Derecognition of shares | — | | | — | | | — | | | — | | | — | | | — | | | (45,818) | | | (300) | | | (300) | | | | — | | | — | | | — | | | — | | | — | | | — | |
| Accrued dividends payable | 251,385 | | | 2,514 | | | 269,520 | | | 2,695 | | | 232,240 | | | 2,323 | | | — | | | — | | | 7,532 | | | | — | | | — | | | (7,532) | | | — | | | — | | | (7,532) | |
| Foreign currency translation adjustment | — | | | — | | | — | | | — | | | — | | | — | | | — | | | — | | | — | | | | — | | | — | | | — | | | 743 | | | — | | | 743 | |
| Stock-based compensation | — | | | — | | | — | | | — | | | — | | | — | | | — | | | — | | | — | | | | — | | | — | | | 315 | | | — | | | — | | | 315 | |
| Net loss | — | | | — | | | — | | | — | | | — | | | — | | | — | | | — | | | — | | | | — | | | — | | | — | | | — | | | (6,885) | | | (6,885) | |
| Balance at June 30, 2021 | 8,256,165 | | | 82,562 | | | 8,398,185 | | | 83,982 | | | 9,547,376 | | | 95,474 | | | 2,520,368 | | | 16,502 | | | 278,520 | | | | 30,281,520 | | | 3 | | | 121,321 | | | (1,834) | | | (121,692) | | | (2,202) | |
| | | | | | | | | | | | | | | | | | | | | | | | | | | | | | |
| Adjustments | | | | | | | | | | | | | | | | | | | | | | | | | | | | | | |
| Balance, December 31, 2020 | — | | | — | | | — | | | — | | | — | | | — | | | (45,818) | | | (300) | | | (300) | | | | — | | | — | | | — | | | 115 | | | (3,835) | | | (3,720) | |
| March 31, 2021 | | | | | | | | | | | | | | | | | | | | — | | | — | | | — | | | — | | | — | | | — | |
| Foreign currency translation adjustment | — | | | — | | | — | | | — | | | — | | | — | | | — | | | — | | | — | | | | — | | | — | | | — | | | 4 | | | — | | | 4 | |
| Net loss | — | | | — | | | — | | | — | | | — | | | — | | | — | | | — | | | — | | | | — | | | — | | | — | | | — | | | (918) | | | (918) | |
| Total Adjustments - March 31, 2021 | — | | | — | | | — | | | — | | | — | | | — | | | (45,818) | | | (300) | | | (300) | | | | — | | | — | | | — | | | 119 | | | (4,753) | | | (4,634) | |
| June 30, 2021 | | | | | | | | | | | | | | | | | | | | — | | | — | | | — | | | — | | | — | | | — | |
| Derecognition of shares | — | | | — | | | — | | | — | | | — | | | — | | | 45,818 | | | 300 | | | 300 | | | | — | | | — | | | — | | | — | | | — | | | — | |
| Foreign currency translation adjustment | — | | | — | | | — | | | — | | | — | | | — | | | — | | | — | | | — | | | | — | | | — | | | — | | | (325) | | | — | | | (325) | |
| Net loss | — | | | — | | | — | | | — | | | — | | | — | | | — | | | — | | | — | | | | — | | | — | | | — | | | — | | | 683 | | | 683 | |
| Total Adjustments - June 30, 2021 | — | | | — | | | — | | | — | | | — | | | — | | | — | | | — | | | — | | | | — | | | — | | | — | | | (206) | | | (4,070) | | | (4,276) | |
| | | | | | | | | | | | | | | | | | | | | | | | | | | | | | |
| As Revised | | | | | | | | | | | | | | | | | | | | | | | | | | | | | | |
| Balance at December 31, 2020 | 7,756,158 | | | 77,562 | | | 7,862,107 | | | 78,621 | | | 9,090,975 | | | 90,910 | | | 2,520,368 | | | 16,502 | | | 263,595 | | | | 30,281,520 | | | 3 | | | 135,616 | | | (1,562) | | | (117,561) | | | 16,496 | |
| Accrued dividends payable | 248,622 | | | 2,486 | | | 266,558 | | | 2,666 | | | 224,161 | | | 2,241 | | | — | | | — | | | 7,393 | | | | — | | | — | | | (7,393) | | | — | | | — | | | (7,393) | |
| | | | | | | | | | | | | | | | | | | | | | | | | | | | | | | | | | | | | | | | | | | | | | | | | | | | | | | | | | | | | | | | | | | | | | | | | | | | | | | | | | | | | | | | | | |
| Foreign currency translation adjustment | — | | | — | | | — | | | — | | | — | | | — | | | — | | | — | | | — | | | | — | | | — | | | — | | | (896) | | | — | | | (896) | |
| Stock-based compensation | — | | | — | | | — | | | — | | | — | | | — | | | — | | | — | | | — | | | | — | | | — | | | 315 | | | — | | | — | | | 315 | |
| Net loss | — | | | — | | | — | | | — | | | — | | | — | | | — | | | — | | | — | | | | — | | | — | | | — | | | — | | | (1,999) | | | (1,999) | |
| Balance at March 31, 2021 | 8,004,780 | | | 80,048 | | | 8,128,665 | | | 81,287 | | | 9,315,136 | | | 93,151 | | | 2,520,368 | | | 16,502 | | | 270,988 | | | | 30,281,520 | | | 3 | | | 128,538 | | | (2,458) | | | (119,560) | | | 6,523 | |
| Accrued dividends payable | 251,385 | | | 2,514 | | | 269,520 | | | 2,695 | | | 232,240 | | | 2,323 | | | — | | | — | | | 7,532 | | | | — | | | — | | | (7,532) | | | — | | | — | | | (7,532) | |
| Foreign currency translation adjustment | — | | | — | | | — | | | — | | | — | | | — | | | — | | | — | | | — | | | | — | | | — | | | — | | | 418 | | | — | | | 418 | |
| Stock-based compensation | — | | | — | | | — | | | — | | | — | | | — | | | — | | | — | | | — | | | | — | | | — | | | 315 | | | — | | | — | | | 315 | |
| Net loss | — | | | — | | | — | | | — | | | — | | | — | | | — | | | — | | | — | | | | — | | | — | | | — | | | — | | | (6,202) | | | (6,202) | |
| Balance at June 30, 2021 | 8,256,165 | | | $ | 82,562 | | | 8,398,185 | | | $ | 83,982 | | | 9,547,376 | | | $ | 95,474 | | | 2,520,368 | | | $ | 16,502 | | | $ | 278,520 | | | | 30,281,520 | | | $ | 3 | | | $ | 121,321 | | | $ | (2,040) | | | $ | (125,762) | | | $ | (6,478) | |
KORE Group Holdings, Inc. and Subsidiaries
Condensed Consolidated Statements of Cash Flows
(In thousands USD) (unaudited)
| | | | | | | | | | | | | | | | | | | | | | | | | | | | | |
| For the six months ended | | | | | | |
| June 30, 2021 | | | | | | |
| As previously reported | | Income tax adjustments | | Indirect tax adjustments | | Other adjustments | | Revised |
| Cash flows from operating activities | | | | | | | | | |
| Net loss | $ | (7,966) | | | $ | (403) | | | $ | (228) | | | $ | 396 | | | $ | (8,201) | |
| Adjustments to reconcile net loss to net cash used in operating activities | | | | | | | | | |
| Depreciation and amortization | 25,507 | | | — | | | — | | | (42) | | | 25,465 | |
| Amortization of deferred financing costs | 1,047 | | | — | | | — | | | — | | | 1,047 | |
| Deferred income taxes | (4,308) | | | 237 | | | — | | | 694 | | | (3,377) | |
| Non-cash foreign currency loss | 77 | | | — | | | — | | | — | | | 77 | |
| Share-based compensation | 630 | | | — | | | — | | | — | | | 630 | |
| Provision for doubtful accounts | 11 | | | — | | | — | | | — | | | 11 | |
| Change in fair value of warrant liability | (2,383) | | | — | | | — | | | — | | | (2,383) | |
| Change in operating assets and liabilities, net of operating assets and liabilities acquired: | | | | | | | | | |
| Accounts receivable | (7,049) | | | — | | | — | | | (109) | | | (7,158) | |
| Inventories | (4,089) | | | — | | | — | | | — | | | (4,089) | |
| Prepaid expenses and other receivables | (9,016) | | | — | | | — | | | (109) | | | (9,125) | |
| Accounts payable and accrued liabilities | (6,103) | | | 166 | | | 228 | | | (563) | | | (6,272) | |
| Deferred revenue | (671) | | | — | | | — | | | — | | | (671) | |
| Income taxes payable | (32) | | | — | | | — | | | (267) | | | (299) | |
Net cash used in operating activities | $ | (14,345) | | | $ | — | | | $ | — | | | $ | — | | | $ | (14,345) | |
| | | | | | | | | |
| | | | | | | | | |
| | | | | | | | | |
Net cash used in investing activities | $ | (5,973) | | | $ | — | | | $ | — | | | $ | — | | | $ | (5,973) | |
| | | | | | | | | |
| | | | | | | | | |
| | | | | | | | | |
| | | | | | | | | |
| | | | | | | | | |
Net cash provided by financing activities | $ | 18,375 | | | | | | | $ | — | | | $ | 18,375 | |
| Effect of exchange rate change on cash and restricted cash | (82) | | | — | | | — | | | — | | | (82) | |
| Change in cash and restricted cash | (2,025) | | | — | | | — | | | — | | | (2,025) | |
Cash and restricted cash, beginning of period | 10,693 | | | — | | | — | | | — | | | 10,693 | |
Cash and restricted cash, end of period | $ | 8,668 | | | $ | — | | | $ | — | | | $ | — | | | $ | 8,668 | |
| | | | | | | | | |
| | | | | | | | | |
| | | | | | | | | |
| | | | | | | | | |
| | | | | | | | | |
KORE Group Holdings, Inc. and Subsidiaries
Condensed Consolidated Balance Sheets (Unaudited)
(In thousands USD, except share and per share amounts)
| | | | | | | | | | | | | | | | | | | | | | | | | | | | | |
| September 30, 2021 | | | | | | |
| As previously reported | | Income tax adjustments | | Indirect tax adjustments | | Other adjustments | | Revised |
| Assets | | | | | | | | | |
| Current assets | | | | | | | | | |
| Cash | $ | 72,689 | | | $ | — | | | $ | — | | | $ | — | | | $ | 72,689 | |
| Accounts receivable, net | 52,638 | | | — | | | — | | | 257 | | | 52,895 | |
| Inventories, net | 12,147 | | | — | | | — | | | — | | | 12,147 | |
| Prepaid expenses and other receivables | 14,540 | | | — | | | — | | | 420 | | | 14,960 | |
| Income taxes receivable | 418 | | | — | | | — | | | 286 | | | 704 | |
| Total current assets | 152,432 | | | — | | | — | | | 963 | | | 153,395 | |
| Non-current assets | | | | | | | | | |
| Restricted cash | 367 | | | — | | | — | | | — | | | 367 | |
| Property and equipment, net | 12,630 | | | — | | | — | | | — | | | 12,630 | |
| Intangibles assets, net | 212,633 | | | — | | | — | | | (945) | | | 211,688 | |
| Goodwill | 382,190 | | | — | | | — | | | 1,453 | | | 383,643 | |
| Operating lease right-of-use assets | 114 | | | — | | | — | | | — | | | 114 | |
| Other long-term assets | 458 | | | — | | | — | | | — | | | 458 | |
Total assets | $ | 760,824 | | | $ | — | | | $ | — | | | $ | 1,471 | | | $ | 762,295 | |
| Liabilities and stockholders’ equity | | | | | | | | | |
| Current liabilities | | | | | | | | | |
| Accounts payable | $ | 20,522 | | | $ | — | | | $ | — | | | $ | — | | | $ | 20,522 | |
| Accrued liabilities | 26,362 | | | — | | | — | | | 1,143 | | | 27,505 | |
| Income taxes payable | 706 | | | — | | | — | | | (110) | | | 596 | |
| Current portion of operating lease liabilities | 528 | | | — | | | — | | | — | | | 528 | |
| Deferred revenue | 6,797 | | | — | | | — | | | — | | | 6,797 | |
| Current portion of long-term debt and other borrowings, net | 3,153 | | | — | | | — | | | — | | | 3,153 | |
Total current liabilities | 58,068 | | | — | | | — | | | 1,033 | | | 59,101 | |
| Non-current liabilities | | | | | | | | | |
| Deferred tax liabilities | 34,580 | | | 1,419 | | | — | | | 379 | | | 36,378 | |
| Due to related parties | 1,122 | | | — | | | — | | | — | | | 1,122 | |
| Warrant Liability | 273 | | | — | | | — | | | — | | | 273 | |
| Long-term portion of capital lease obligations | 304 | | | — | | | — | | | — | | | 304 | |
| Long-term debt | 378,356 | | | — | | | — | | | — | | | 378,356 | |
| Other long-term liabilities | 4,154 | | | 1,986 | | | 1,142 | | | (83) | | | 7,199 | |
Total liabilities | $ | 476,857 | | | $ | 3,405 | | | $ | 1,142 | | | $ | 1,329 | | | $ | 482,733 | |
| Stockholders’ equity | | | | | | | | | |
| Common stock | 7 | | | — | | | — | | | — | | | 7 | |
| Additional paid-in capital | 413,316 | | | — | | | — | | | (331) | | | 412,985 | |
| Accumulated other comprehensive loss | (3,156) | | | (53) | | | — | | | (86) | | | (3,295) | |
| Accumulated deficit | (126,200) | | | (3,352) | | | (1,142) | | | 559 | | | (130,135) | |
Total stockholders’ equity | $ | 283,967 | | | $ | (3,405) | | | $ | (1,142) | | | $ | 142 | | | $ | 279,562 | |
Total liabilities and stockholders’ equity | $ | 760,824 | | | $ | — | | | $ | — | | | $ | 1,471 | | | $ | 762,295 | |
KORE Group Holdings, Inc. and Subsidiaries
Consolidated Statements of Operations (Unaudited)
(In thousands USD, except share and per share amounts)
| | | | | | | | | | | | | | | | | | | | | | | | | | | | | |
| For the three months ended | | | | | | |
| September 30, 2021 | | | | | | |
| As previously reported | | Income tax adjustments | | Indirect tax adjustments | | Other adjustments | | Revised |
| Revenue | | | | | | | | | |
| Services | $ | 48,428 | | | $ | — | | | $ | — | | | $ | 55 | | | $ | 48,483 | |
| Products | 19,450 | | | — | | | — | | | — | | | 19,450 | |
Total revenue | 67,878 | | | — | | | — | | | 55 | | | 67,933 | |
| Cost of revenue | | | | | | | | | |
| Cost of services | 17,379 | | | — | | | — | | | (9) | | | 17,370 | |
| Cost of products | 17,585 | | | — | | | — | | | — | | | 17,585 | |
Total cost of revenue (exclusive of depreciation and amortization shown separately below) | 34,964 | | | — | | | — | | | (9) | | | 34,955 | |
| Operating expenses | | | | | | | | | |
| Selling, general and administrative | 26,001 | | | — | | | 114 | | | (1) | | | 26,114 | |
| Depreciation and amortization | 12,440 | | | — | | | — | | | (21) | | | 12,419 | |
Total operating expenses | 38,441 | | | — | | | 114 | | | (22) | | | 38,533 | |
Operating loss | (5,527) | | | — | | | (114) | | | 86 | | | (5,555) | |
| Interest expense, including amortization of deferred financing costs, net | 5,589 | | | — | | | — | | | — | | | 5,589 | |
| Change in fair value of warrant liability | (2,898) | | | — | | | — | | | — | | | (2,898) | |
Loss before income taxes | (8,218) | | | — | | | (114) | | | 86 | | | (8,246) | |
Income tax expense (benefit) | (3,710) | | | 299 | | | — | | | (462) | | | (3,873) | |
Net loss | $ | (4,508) | | | $ | (299) | | | $ | (114) | | | $ | 548 | | | $ | (4,373) | |
| Loss per share: | | | | | | | | | |
| Basic | $ | (0.26) | | | $ | (0.01) | | | $ | — | | | $ | 0.02 | | | $ | (0.26) | |
| Diluted | $ | (0.26) | | | $ | (0.01) | | | $ | — | | | $ | 0.02 | | | $ | (0.26) | |
| Weighted average number of shares outstanding: | | | | | | | | | |
| Basic | 32,098,715 | | | — | | | — | | | — | | | 32,098,715 | |
| Diluted | 32,098,715 | | | — | | | — | | | — | | | 32,098,715 | |
KORE Group Holdings, Inc. and Subsidiaries
Consolidated Statements of Operations (Unaudited)
(In thousands USD, except share and per share amounts)
| | | | | | | | | | | | | | | | | | | | | | | | | | | | | |
| For the nine months ended | | | | | | |
| September 30, 2021 | | | | | | |
| As previously reported | | Income tax adjustments | | Indirect tax adjustments | | Other adjustments | | Revised |
| Revenue | | | | | | | | | |
| Services | $ | 139,866 | | | $ | — | | | $ | — | | | $ | 165 | | | $ | 140,031 | |
| Products | 44,053 | | | — | | | — | | | — | | | 44,053 | |
Total revenue | 183,919 | | | — | | | — | | | 165 | | | 184,084 | |
| Cost of revenue | | | | | | | | | |
| Cost of services | 51,417 | | | — | | | — | | | (479) | | | 50,938 | |
| Cost of products | 37,258 | | | — | | | — | | | (235) | | | 37,023 | |
Total cost of revenue (exclusive of depreciation and amortization shown separately below) | 88,675 | | | — | | | — | | | (714) | | | 87,961 | |
| Operating expenses | | | | | | | | | |
| Selling, general and administrative | 66,525 | | | — | | | 342 | | | (3) | | | 66,864 | |
| Depreciation and amortization | 37,947 | | | — | | | — | | | (63) | | | 37,884 | |
Total operating expenses | 104,472 | | | — | | | 342 | | | (66) | | | 104,748 | |
Operating loss | (9,228) | | | — | | | (342) | | | 945 | | | (8,625) | |
| Interest expense, including amortization of deferred financing costs, net | 16,155 | | | — | | | — | | | — | | | 16,155 | |
| Change in fair value of warrant liability | (5,281) | | | — | | | — | | | — | | | (5,281) | |
Loss before income taxes | (20,102) | | | — | | | (342) | | | 945 | | | (19,499) | |
| Income tax expense (benefit) | (7,628) | | | 702 | | | — | | | 1 | | | (6,925) | |
Net loss | $ | (12,474) | | | $ | (702) | | | $ | (342) | | | $ | 944 | | | $ | (12,574) | |
| Loss per share: | | | | | | | | | |
| Basic | $ | (0.98) | | | $ | (0.02) | | | $ | (0.01) | | | $ | 0.03 | | | $ | (0.98) | |
| Diluted | $ | (0.98) | | | $ | (0.02) | | | $ | (0.01) | | | $ | 0.03 | | | $ | (0.98) | |
| Weighted average number of shares outstanding: | | | | | | | | | |
| Basic | 31,799,313 | | | — | | | — | | | — | | | 31,799,313 | |
| Diluted | 31,799,313 | | | — | | | — | | | — | | | 31,799,313 | |
KORE Group Holdings, Inc. and Subsidiaries
Consolidated Statements of Comprehensive Loss (Unaudited)
(In thousands USD)
| | | | | | | | | | | | | | | | | | | | | | | | | | | | | |
| For the three months ended | | | | | | |
| September 30, 2021 | | | | | | |
| As previously reported | | Income tax adjustments | | Indirect tax adjustments | | Other adjustments | | Revised |
Net loss | $ | (4,508) | | | $ | (299) | | | $ | (114) | | | $ | 548 | | | $ | (4,373) | |
| Other comprehensive loss: | | | | | | | | | |
| Foreign currency translation adjustment | (1,322) | | | 67 | | | — | | | — | | | (1,255) | |
Comprehensive loss | $ | (5,830) | | | $ | (232) | | | $ | (114) | | | $ | 548 | | | $ | (5,628) | |
| | | | | | | | | | | | | | | | | | | | | | | | | | | | | |
| For the nine months ended | | | | | | |
| September 30, 2021 | | | | | | |
| As previously reported | | Income tax adjustments | | Indirect tax adjustments | | Other adjustments | | Revised |
Net loss | $ | (12,474) | | | $ | (702) | | | $ | (342) | | | $ | 944 | | | $ | (12,574) | |
| Other comprehensive loss: | | | | | | | | | |
| Foreign currency translation adjustment | (1,479) | | | 46 | | | — | | | (300) | | | (1,733) | |
Comprehensive loss | $ | (13,953) | | | $ | (656) | | | $ | (342) | | | $ | 644 | | | $ | (14,307) | |
KORE Group Holdings, Inc. and Subsidiaries
Consolidated Statements of Stockholders’ Equity (Unaudited)
(In thousands, USD)
| | | | | | | | | | | | | | | | | | | | | | | | | | | | | | | | | | | | | | | | | | | | | | | | | | | | | | | | | | | | | | | | | | | | | | | | | | | | | | | | | | | | | | | | | | |
| Series A Preferred Stock | | Series A-1 Preferred Stock | | Series B Preferred Stock | | Series C Convertible Preferred Stock | | Total Temporary Equity | | | Common Stock | | Additional paid-in capital | | Accumulated Other Comprehensive Income (Loss) | | Accumulated
Other
Comprehensive
Income (Loss) | | Accumulated
Deficit | | Total Stockholders’ Equity |
| | |
| | |
| | |
| | | | | | | | | | | | | | |
| Temporary Equity | | | | | | | | | | | | | |
| Shares | | Amount | | Shares | | Amount | | Shares | | Amount | | Shares | | Amount | | Amount | | | Shares | | Amount | | Amount | | Amount | | Amount | | Amount |
| As Reported | | | | | | | | | | | | | | | | | | | | | | | | | | | | | | |
| Balance at December 31, 2020 | 7,756,158 | | | $ | 77,562 | | | 7,862,107 | | | $ | 78,621 | | | 9,090,975 | | | $ | 90,910 | | | 2,566,186 | | | $ | 16,802 | | | $ | 263,895 | | | | 30,281,520 | | | $ | 3 | | | $ | 135,616 | | | $ | (1,677) | | | $ | (113,726) | | | $ | 20,216 | |
| Accrued dividends payable | 248,622 | | | 2,486 | | | 266,558 | | | 2,666 | | | 224,161 | | | 2,241 | | | — | | | — | | | 7,393 | | | | — | | | — | | | (7,393) | | | — | | | — | | | (7,393) | |
| Foreign currency translation adjustment | — | | | — | | | — | | | — | | | — | | | — | | | — | | | — | | | — | | | | — | | | — | | | — | | | (900) | | | — | | | (900) | |
| Stock-based compensation | — | | | — | | | — | | | — | | | — | | | — | | | — | | | — | | | — | | | | — | | | — | | | 315 | | | — | | | — | | | 315 | |
| Net loss | — | | | — | | | — | | | — | | | — | | | — | | | — | | | — | | | — | | | | — | | | — | | | — | | | — | | | (1,081) | | | (1,081) | |
| Balance at March 31, 2021 | 8,004,780 | | | 80,048 | | | 8,128,665 | | | 81,287 | | | 9,315,136 | | | 93,151 | | | 2,566,186 | | | 16,802 | | | 271,288 | | | | 30,281,520 | | | 3 | | | 128,538 | | | (2,577) | | | (114,807) | | | 11,157 | |
| Derecognition of shares | — | | | — | | | — | | | — | | | — | | | — | | | (45,818) | | | (300) | | | (300) | | | | — | | | — | | | — | | | — | | | — | | | — | |
| Accrued dividends payable | 251,385 | | | 2,514 | | | 269,520 | | | 2,695 | | | 232,240 | | | 2,323 | | | — | | | — | | | 7,532 | | | | — | | | — | | | (7,532) | | | — | | | — | | | (7,532) | |
| Foreign currency translation adjustment | — | | | — | | | — | | | — | | | — | | | — | | | — | | | — | | | — | | | | — | | | — | | | — | | | 743 | | | — | | | 743 | |
| Stock-based compensation | — | | | — | | | — | | | — | | | — | | | — | | | — | | | — | | | — | | | | — | | | — | | | 315 | | | — | | | — | | | 315 | |
| Net loss | — | | | — | | | — | | | — | | | — | | | — | | | — | | | — | | | — | | | | — | | | — | | | — | | | — | | | (6,885) | | | (6,885) | |
| Balance at June 30, 2021 | 8,256,165 | | | 82,562 | | | 8,398,185 | | | 83,982 | | | 9,547,376 | | | 95,474 | | | 2,520,368 | | | 16,502 | | | 278,520 | | | | 30,281,520 | | | 3 | | | 121,321 | | | (1,834) | | | (121,692) | | | (2,202) | |
| Accrued dividends payable | 265,602 | | | 2,656 | | | 287,998 | | | 2,880 | | | 236,142 | | | 2,361 | | | — | | | — | | | 7,897 | | | | — | | | — | | | (7,897) | | | — | | | — | | | (7,897) | |
| Foreign currency translation adjustment | — | | | — | | | — | | | — | | | — | | | — | | | — | | | — | | | — | | | | — | | | — | | | — | | | (1,322) | | | — | | | (1,322) | |
| Stock-based compensation | — | | | — | | | — | | | — | | | — | | | — | | | — | | | — | | | — | | | | — | | | — | | | (3,519) | | | — | | | — | | | (3,519) | |
| Distributions to and conversions of preferred stock | (8,521,767) | | | (85,218) | | | (8,686,183) | | | (86,862) | | | (9,783,518) | | | (97,835) | | | (2,520,368) | | | (16,502) | | | (286,417) | | | | 7,120,368 | | | 1 | | | 56,502 | | | — | | | — | | | 56,503 | |
CTAC shares recapitalized, net of equity issuance costs of $15,912 | — | | | — | | | — | | | — | | | — | | | — | | | — | | | — | | | — | | | | 10,373,491 | | | 1 | | | 6,456 | | | — | | | — | | | 6,457 | |
| Conversion of KORE warrants | — | | | — | | | — | | | — | | | — | | | — | | | — | | | — | | | — | | | | 1,365,612 | | | | | 10,663 | | | — | | | — | | | 10,663 | |
Private offering and merger financing, net of equity issuance costs of $7,718 | — | | | — | | | — | | | — | | | — | | | — | | | — | | | — | | | — | | | | 22,686,326 | | | 2 | | | 217,280 | | | — | | | — | | | 217,282 | |
Equity portion of convertible debt, net of issuance costs of $224 | — | | | — | | | — | | | — | | | — | | | — | | | — | | | — | | | — | | | | — | | | — | | | 12,510 | | | — | | | — | | | 12,510 | |
| Net loss | — | | | — | | | — | | | — | | | — | | | — | | | — | | | — | | | — | | | | — | | | — | | | — | | | — | | | (4,508) | | | (4,508) | |
| Balance at September 30, 2021 | — | | | — | | | — | | | — | | | — | | | — | | | — | | | — | | | — | | | | 71,827,317 | | | 7 | | | 413,316 | | | (3,156) | | | (126,200) | | | 283,967 | |
| | | | | | | | | | | | | | | | | | | | | | | | | | | | | | |
| Adjustments | | | | | | | | | | | | | | | | | | | | | | | | | | | | | | |
| | | | | | | | | | | | | | | | | | | | | | | | | | | | | | | | | | | | | | | | | | | | | | | | | | | | | | | | | | | | | | | | | | | | | | | | | | | | | | | | | | | | | | | | | | |
| Series A Preferred Stock | | Series A-1 Preferred Stock | | Series B Preferred Stock | | Series C Convertible Preferred Stock | | Total Temporary Equity | | | Common Stock | | Additional paid-in capital | | Accumulated Other Comprehensive Income (Loss) | | Accumulated
Other
Comprehensive
Income (Loss) | | Accumulated
Deficit | | Total Stockholders’ Equity |
| | |
| | |
| | |
| | | | | | | | | | | | | | |
| Temporary Equity | | | | | | | | | | | | | |
| Balance, December 31, 2020 | — | | | — | | | — | | | — | | | — | | | — | | | (45,818) | | | (300) | | | (300) | | | | — | | | — | | | — | | | 115 | | | (3,835) | | | (3,720) | |
| March 31, 2021 | | | | | | | | | | | | | | | | | | | | | | | | | | | | | | |
| Foreign currency translation adjustment | — | | | — | | | — | | | — | | | — | | | — | | | — | | | — | | | — | | | | — | | | — | | | — | | | 4 | | | — | | | 4 | |
| Net loss | — | | | — | | | — | | | — | | | — | | | — | | | — | | | — | | | — | | | | — | | | — | | | — | | | — | | | (918) | | | (918) | |
| Total Adjustments - March 31, 2021 | — | | | — | | | — | | | — | | | — | | | — | | | (45,818) | | | (300) | | | (300) | | | | — | | | — | | | — | | | 119 | | | (4,753) | | | (4,634) | |
| June 30, 2021 | | | | | | | | | | | | | | | | | | | | | | | | | | | | | | |
| Derecognition of shares | — | | | — | | | — | | | — | | | — | | | — | | | 45,818 | | | 300 | | | 300 | | | | — | | | — | | | — | | | — | | | — | | | — | |
| Foreign currency translation adjustment | — | | | — | | | — | | | — | | | — | | | — | | | — | | | — | | | — | | | | — | | | — | | | — | | | (325) | | | — | | | (325) | |
| Net loss | — | | | — | | | — | | | — | | | — | | | — | | | — | | | — | | | — | | | | — | | | — | | | — | | | — | | | 683 | | | 683 | |
| Total Adjustments - June 30, 2021 | — | | | — | | | — | | | — | | | — | | | — | | | — | | | — | | | — | | | | — | | | — | | | — | | | (206) | | | (4,070) | | | (4,276) | |
| September 30, 2021 | | | | | | | | | | | | | | | | | | | | | | | | | | | | | | |
| Foreign currency translation adjustment | — | | | — | | | — | | | — | | | — | | | — | | | — | | | — | | | — | | | | — | | | — | | | — | | | 67 | | | — | | | 67 | |
| Private offering and merger financing | — | | | — | | | — | | | — | | | — | | | — | | | — | | | — | | | — | | | | — | | | — | | | (331) | | | — | | | — | | | (331) | |
| Net loss | — | | | — | | | — | | | — | | | — | | | — | | | — | | | — | | | — | | | | — | | | — | | | — | | | — | | | 135 | | | 135 | |
| Total Adjustments - September 30, 2021 | — | | | — | | | — | | | — | | | — | | | — | | | — | | | — | | | — | | | | — | | | — | | | (331) | | | (139) | | | (3,935) | | | (4,405) | |
| As Revised | | | | | | | | | | | | | | | | | | | | | | | | | | | | | | |
| Balance at December 31, 2020 | 7,756,158 | | | 77,562 | | | 7,862,107 | | | 78,621 | | | 9,090,975 | | | 90,910 | | | 2,520,368 | | | 16,502 | | | 263,595 | | | | 30,281,520 | | | 3 | | | 135,616 | | | (1,562) | | | (117,561) | | | 16,496 | |
| Accrued dividends payable | 248,622 | | | 2,486 | | | 266,558 | | | 2,666 | | | 224,161 | | | 2,241 | | | — | | | — | | | 7,393 | | | | — | | | — | | | (7,393) | | | — | | | — | | | (7,393) | |
| Foreign currency translation adjustment | — | | | — | | | — | | | — | | | — | | | — | | | — | | | — | | | — | | | | — | | | — | | | — | | | (896) | | | — | | | (896) | |
| Stock-based compensation | — | | | — | | | — | | | — | | | — | | | — | | | — | | | — | | | — | | | | — | | | — | | | 315 | | | — | | | — | | | 315 | |
| Net loss | — | | | — | | | — | | | — | | | — | | | — | | | — | | | — | | | — | | | | — | | | — | | | — | | | — | | | (1,999) | | | (1,999) | |
| Balance at March 31, 2021 | 8,004,780 | | | 80,048 | | | 8,128,665 | | | 81,287 | | | 9,315,136 | | | 93,151 | | | 2,520,368 | | | 16,502 | | | 270,988 | | | | 30,281,520 | | | 3 | | | 128,538 | | | (2,458) | | | (119,560) | | | 6,523 | |
| Accrued dividends payable | 251,385 | | | 2,514 | | | 269,520 | | | 2,695 | | | 232,240 | | | 2,323 | | | — | | | — | | | 7,532 | | | | — | | | — | | | (7,532) | | | — | | | — | | | (7,532) | |
| Foreign currency translation adjustment | — | | | — | | | — | | | — | | | — | | | — | | | — | | | — | | | — | | | | — | | | — | | | — | | | 418 | | | — | | | 418 | |
| Stock-based compensation | — | | | — | | | — | | | — | | | — | | | — | | | — | | | — | | | — | | | | — | | | — | | | 315 | | | — | | | — | | | 315 | |
| | | | | | | | | | | | | | | | | | | | | | | | | | | | | | | | | | | | | | | | | | | | | | | | | | | | | | | | | | | | | | | | | | | | | | | | | | | | | | | | | | | | | | | | | | |
| Series A Preferred Stock | | Series A-1 Preferred Stock | | Series B Preferred Stock | | Series C Convertible Preferred Stock | | Total Temporary Equity | | | Common Stock | | Additional paid-in capital | | Accumulated Other Comprehensive Income (Loss) | | Accumulated
Other
Comprehensive
Income (Loss) | | Accumulated
Deficit | | Total Stockholders’ Equity |
| | |
| | |
| | |
| | | | | | | | | | | | | | |
| Temporary Equity | | | | | | | | | | | | | |
| Net loss | — | | | — | | | — | | | — | | | — | | | — | | | — | | | — | | | — | | | | — | | | — | | | — | | | — | | | (6,202) | | | (6,202) | |
| Balance at June 30, 2021 | 8,256,165 | | | 82,562 | | | 8,398,185 | | | 83,982 | | | 9,547,376 | | | 95,474 | | | 2,520,368 | | | 16,502 | | | 278,520 | | | | 30,281,520 | | | 3 | | | 121,321 | | | (2,040) | | | (125,762) | | | (6,478) | |
| Accrued dividends payable | 265,602 | | | 2,656 | | | 287,998 | | | 2,880 | | | 236,142 | | | 2,361 | | | — | | | — | | | 7,897 | | | | — | | | — | | | (7,897) | | | — | | | — | | | (7,897) | |
| Foreign currency translation adjustment | — | | | — | | | — | | | — | | | — | | | — | | | — | | | — | | | — | | | | — | | | — | | | — | | | (1,255) | | | — | | | (1,255) | |
| Stock-based compensation | — | | | — | | | — | | | — | | | — | | | — | | | — | | | — | | | — | | | | — | | | — | | | (3,519) | | | — | | | — | | | (3,519) | |
| Distributions to and conversions of preferred stock | (8,521,767) | | | (85,218) | | | (8,686,183) | | | (86,862) | | | (9,783,518) | | | (97,835) | | | (2,520,368) | | | (16,502) | | | (286,417) | | | | 7,120,368 | | | 1 | | | 56,502 | | | — | | | — | | | 56,503 | |
CTAC shares recapitalized, net of equity issuance costs of $15,912 | — | | | — | | | — | | | — | | | — | | | — | | | — | | | — | | | — | | | | 10,373,491 | | | 1 | | | 6,456 | | | — | | | — | | | 6,457 | |
| Conversion of KORE warrants | — | | | — | | | — | | | — | | | — | | | — | | | — | | | — | | | — | | | | 1,365,612 | | | — | | | 10,663 | | | — | | | — | | | 10,663 | |
Private offering and merger financing, net of equity issuance costs of $7,718 | — | | | — | | | — | | | — | | | — | | | — | | | — | | | — | | | — | | | | 22,686,326 | | | 2 | | | 216,949 | | | — | | | — | | | 216,951 | |
Equity portion of convertible debt, net of issuance costs of $224 | — | | | — | | | — | | | — | | | — | | | — | | | — | | | — | | | — | | | | — | | | — | | | 12,510 | | | — | | | — | | | 12,510 | |
| Net loss | — | | | — | | | — | | | — | | | — | | | — | | | — | | | — | | | — | | | | — | | | — | | | — | | | — | | | (4,373) | | | (4,373) | |
| Balance at September 30, 2021 | — | | | — | | | — | | | — | | | — | | | — | | | — | | | — | | | — | | | | 71,827,317 | | | $ | 7 | | | $ | 412,985 | | | $ | (3,295) | | | $ | (130,135) | | | $ | 279,562 | |
KORE Group Holdings, Inc. and Subsidiaries
Consolidated Statements of Cash Flows (Unaudited)
(In thousands USD)
| | | | | | | | | | | | | | | | | | | | | | | | | | | | | |
| For nine months ended | | | | | | |
| September 30, 2021 | | | | | | |
| As previously reported | | Income tax adjustments | | Indirect tax adjustments | | Other adjustments | | Revised |
| Cash flows from operating activities | | | | | | | | | |
| Net loss | $ | (12,474) | | | $ | (702) | | | $ | (342) | | | $ | 944 | | | $ | (12,574) | |
| Adjustments to reconcile net loss to net cash provided by (used in) operating activities | | | | | | | | | |
| Depreciation and amortization | 37,947 | | | — | | | — | | | (63) | | | 37,884 | |
| Amortization of deferred financing costs | 1,569 | | | — | | | — | | | — | | | 1,569 | |
| Deferred income taxes | (8,197) | | | 293 | | | — | | | 463 | | | (7,441) | |
| Non-cash foreign currency loss (gain) | (163) | | | — | | | — | | | — | | | (163) | |
| Stock-based compensation | 4,564 | | | — | | | — | | | — | | | 4,564 | |
| Provision for doubtful accounts | 117 | | | — | | | — | | | — | | | 117 | |
| Change in fair value of warrant liability | (5,281) | | | — | | | — | | | — | | | (5,281) | |
| Change in operating assets and liabilities, net of operating assets and liabilities acquired: | | | | | | | | | |
| Accounts receivable | (12,792) | | | — | | | — | | | (164) | | | (12,956) | |
| Inventories | (6,461) | | | — | | | — | | | — | | | (6,461) | |
| Prepaid expenses and other current assets | (5,054) | | | — | | | — | | | (51) | | | (5,105) | |
| Accounts payable and accrued liabilities | (2,366) | | | 409 | | | 342 | | | (749) | | | (2,364) | |
| Deferred revenue | (911) | | | — | | | — | | | — | | | (911) | |
| Income taxes payable | 63 | | | — | | | — | | | (380) | | | (317) | |
| | | | | | | | | |
Net cash used in operating activities | $ | (9,439) | | | $ | — | | | $ | — | | | $ | — | | | $ | (9,439) | |
| | | | | | | | | |
| | | | | | | | | |
| | | | | | | | | |
Net cash used in investing activities | $ | (9,782) | | | $ | — | | | $ | — | | | $ | — | | | $ | (9,782) | |
| | | | | | | | | |
| | | | | | | | | |
| | | | | | | | | |
| | | | | | | | | |
| | | | | | | | | |
| | | | | | | | | |
| | | | | | | | | |
| | | | | | | | | |
| | | | | | | | | |
| | | | | | | | | |
| | | | | | | | | |
Net cash provided by financing activities | $ | 81,772 | | | $ | — | | | $ | — | | | $ | — | | | $ | 81,772 | |
| Effect of exchange rate change on cash | (188) | | | | | | | | | (188) | |
| Change in cash and restricted cash | 62,363 | | | — | | | — | | | — | | | 62,363 | |
Cash and restricted cash, beginning of period | $ | 10,693 | | | — | | | — | | | — | | | $ | 10,693 | |
Cash and restricted cash, end of period | $ | 73,056 | | | $ | — | | | $ | — | | | $ | — | | | $ | 73,056 | |
| | | | | | | | | |
| | | | | | | | | |
| | | | | | | | | |
| | | | | | | | | |
| | | | | | | | | |
| | | | | | | | | |
| | | | | | | | | |
| | | | | | | | | |
NOTE 18 – GEOGRAPHIC AREA INFORMATION
No sales to an individual country other than the United States accounted for more than 10% of revenue for fiscal years 2022 and 2021. Revenue classified by the major geographic areas in which our customers were located and long-lived assets classified where held:
| | | | | | | | | | | | | | | | | | | | | | | |
| Net Sales | | Long Lived Assets* |
| December 31 | | December 31 |
| (in Thousands, USD) | 2022 | | 2021 | | 2022 | | 2021 |
| United States | $ | 211,599 | | | $ | 187,392 | | | $ | 152,361 | | | $ | 141,511 | |
| Other Countries | 56,848 | | | 61,043 | | | 62,062 | | | 73,279 | |
Total | $ | 268,447 | | | $ | 248,435 | | | $ | 214,423 | | | $ | 214,790 | |
__________________
*For 2022, Long Lived Assets includes property and equipment, net, intangible assets, net and operating leases -right of use assets. For 2021, Long Lived Assets includes property and equipment net, intangible assets, net.
NOTE 19 – SUBSEQUENT EVENTS
The Company has completed an evaluation of all subsequent events through April 7, 2023, to ensure that these consolidated financial statements include appropriate disclosure of events both recognized in the consolidated financial statements and events which occurred but were not recognized in the consolidated financial statements. Except as described below, the Company has concluded that no subsequent event has occurred that requires disclosure.
As of March 26, 2023, KORE entered into an agreement to acquire Twilio's IoT business unit for ten million shares of KORE common stock to be issued to Twilio. This acquisition expands KORE's existing Deploy, Manage, and Scale capabilities by adding Build services to our one-stop-shop and, importantly, bolsters KORE's global, independent IoT Connectivity leadership position. Completion of the acquisition transaction is subject to customary closing conditions and is expected to close in the late second quarter of 2023.
Financial Statement Schedule
(In thousands USD, except share and per share amounts)
SCHEDULE I – PARENT ONLY FINANCIAL INFORMATION
The following presents condensed parent company only financial information of KORE Group Holdings, Inc.
Condensed Balance Sheet (in thousands USD)
| | | | | | | | | | | |
| December 31,
2022 | | December 31,
2021 |
| Assets | | | |
| Non-current assets | | | |
| Investment in subsidiaries | $ | 192,549 | | | $ | 256,725 | |
| Total non-current assets | 192,549 | | | 256,725 | |
| Total assets | $ | 192,549 | | | $ | 256,725 | |
| Liabilities and stockholders’ equity | | | |
| Long-term liabilities | | | |
| Warrant liability | 33 | | | 286 | |
| Total liabilities | $ | 33 | | | $ | 286 | |
| Stockholders’ equity | | | |
Common stock, voting; par value $0.0001 per share; 315,000,000 shares authorized, 76,292,241 and 72,027,743 shares issued and outstanding at December 31, 2022, and December 31, 2021 | 8 | | | 7 | |
| Additional paid-in capital | 435,293 | | | 401,690 | |
| Accumulated other comprehensive loss | (6,390) | | | (3,463) | |
| Accumulated deficit | (236,394) | | | (141,795) | |
| Total stockholders’ equity | $ | 192,517 | | | $ | 256,439 | |
| Total liabilities and stockholders’ equity | $ | 192,550 | | | $ | 256,725 | |
Condensed Statements of Loss and Comprehensive Loss (in thousands USD)
| | | | | | | | | | | |
| For the years ended | December 31,
2022 | | December 31,
2021 |
| Equity in net loss of unconsolidated subsidiaries | $ | (94,759) | | | $ | (29,892) | |
| Change in fair value of warrant liability | (254) | | | (5,267) | |
| Loss before income taxes | (94,505) | | | (24,625) | |
| Net loss | $ | (94,505) | | | $ | (24,625) | |
| Other comprehensive loss: | | | |
| Foreign currency translation adjustment | (2,927) | | | (1,987) | |
| Comprehensive loss | $ | (97,432) | | | $ | (26,612) | |
Condensed Statements of Cash Flows (in thousands USD)
| | | | | | | | | | | |
| For the years ended | December 31,
2022 | | December 31,
2021 |
| Cash flows from operating activities | | | |
| Net loss | $ | (94,505) | | | $ | (24,625) | |
| Adjustments to reconcile net loss to net cash provided by operating activities | | | |
| Equity in net loss of unconsolidated subsidiaries | 94,759 | | | 29,892 | |
| Change in fair value of warrant liability | (254) | | | (5,267) | |
| Cash provided by operating activities | $ | — | | | $ | — | |
| Cash flows from investing activities | | | |
| Distribution from subsidiary | — | | | 5,947 | |
| Cash provided by investing activities | $ | — | | | $ | 5,947 | |
| Issuance of common stock, net of transaction costs | — | | | 223,968 | |
| Settlement of preferred stock | — | | | (229,915) | |
| Cash used in financing activities | $ | — | | | $ | (5,947) | |
| Effect of exchange rate change on cash and restricted | — | | | — | |
| Change in cash and restricted cash | — | | | — | |
| Cash and restricted cash, beginning of year | — | | | — | |
| Cash and restricted cash, end of year | $ | — | | | $ | — | |
| Non-cash investing and financing activities: | | | |
| Fair value of KORE common stock issued pursuant to acquisition | $ | 23,295 | | | $ | — | |
| Share-based payment awards issued to employees of subsidiaries | 10,296 | | | 1,839 | |
(i)Basis of presentation and business combination
On March 12, 2021, Maple Holdings Inc. (“Maple” or “pre-combination KORE”) entered into a definitive merger agreement (the “Business Combination”) with Cerberus Telecom Acquisition Corp. (NYSE: CTAC) (“CTAC”). On September 29, 2021, CTAC held a special meeting, at which CTAC’s shareholders voted to approve the proposals outlined in the proxy statement filed by CTAC with the Securities Exchange Commission (the “SEC”) on August 13, 2021, including, among other things, the adoption of the Business Combination and approval of the other transactions contemplated by the merger agreement. On September 30, 2021 (the “Closing Date”), as contemplated by the merger agreement, (i) CTAC merged with and into King LLC Merger Sub, LLC (“LLC Merger Sub”) (the “Pubco Merger”), with LLC Merger Sub being the surviving entity of the Pubco Merger and King Pubco, Inc. (“Pubco”) as parent of the surviving entity, (ii) immediately prior to the First Merger (as defined below), Cerberus Telecom Acquisition Holdings, LLC (the “Sponsor”) contributed 100% of its equity interests in King Corp Merger Sub, Inc. (“Corp Merger Sub”) to Pubco (the “Corp Merger Sub Contribution”), as a result of which Corp Merger Sub became a wholly owned subsidiary of Pubco, (iii) following the Corp Merger Sub Contribution, Corp Merger Sub merged with and into Maple (the “First Merger”), with Maple being the surviving corporation of the First Merger, and (iv) immediately following the First Merger and as part of the same overall transaction as the First Merger, Maple merged with and into LLC Merger Sub (the “Second Merger” and, together with the First Merger, being collectively referred to as the “Mergers” and, together with the other transactions contemplated by the merger agreement, the “Transactions” and the closing of the Transactions, the Business Combination), with LLC Merger Sub being the surviving entity of the Second Merger and Pubco being the sole member of LLC Merger Sub. In connection with the Business Combination, Pubco changed its name to “KORE Group Holdings, Inc.” (the “Company”). The combined Company remained listed on the NYSE under the new ticker symbol “KORE.”
The Business Combination was accounted for as a reverse recapitalization as pre-combination KORE was determined to be the accounting acquirer and CTAC was treated as the “acquired” company for accounting purposes
under FASB’s ASC Topic 805, Business Combination (“ASC 805”). Pre-combination KORE was determined to be the accounting acquirer based on the evaluation of the following facts and circumstances:
•the equity holders of pre-combination KORE held the majority (54%) of voting rights in the Company;
•the senior management of pre-combination KORE became the senior management of the Company;
•in comparison with CTAC, pre-combination KORE has significantly more revenues and total assets and a larger net loss; and
•the operations of pre-combination KORE comprise the ongoing operations of the Company, and the Company assumed pre-Combination KORE’s headquarters.
Accordingly, for accounting purposes, the financial statements of the Company represent a continuation of the financial statements of pre-combination KORE with the acquisition being treated as the equivalent of pre-combination KORE issuing stock for the net assets of CTAC, accompanied by a recapitalization. The net assets of CTAC were stated at historical cost, with no goodwill or other intangible assets recorded. Pre-combination KORE was deemed to be the predecessor and the consolidated assets and liabilities and results of operations prior to September 30, 2021 are those of pre-combination KORE.
In the condensed parent-company-only financial statements, the Company’s investment in subsidiaries is stated at cost plus equity in undistributed earnings of subsidiaries since the subsidiaries were originally acquired. The Company’s share of net loss of its subsidiaries is included in the condensed statements of loss and comprehensive loss using the equity method of accounting. These condensed parent-company-only financial statements should be read in connection with the consolidated financial statements and notes thereto of KORE Group Holdings, Inc. and subsidiaries.
As of December 31, 2022, the Company has no purchase commitment, capital commitment and operating lease commitments. The Company is the guarantor of indebtedness for certain of its subsidiaries.
(ii)Restricted Net Assets
Schedule I of Rule 5-04 of Regulation S-X requires the condensed financial information of a registrant to be filed when the restricted net assets of the registrant’s subsidiaries exceed 25 percent of the registrant’s consolidated net assets as of the end of the most recently completed fiscal year. For purposes of this test, restricted net assets of the consolidated subsidiaries means the amount of the registrant’s proportionate share of net assets of the consolidated subsidiaries (after intercompany eliminations) which as of the end of the most recent fiscal year may not be transferred to the parent company by subsidiaries in the form of loans, advances or cash dividends without the consent of a third party (e.g., lender, regulatory agency, foreign government).
The parent company financial statements have been prepared in accordance with Rule 12-04, Schedule I of Regulation S-X as the restricted net assets of the Company’s subsidiaries exceed 25% of the Company’s consolidated net assets. The Company is a holding company that conducts substantially all its business operations through its subsidiaries. The Company’s ability to pay dividends on the Company’s common stock is limited by restrictions on the ability of the Company and its subsidiaries to pay dividends or make distributions under the terms of agreements governing the indebtedness of the Company’s subsidiaries. Subject to the full terms and conditions under the agreements governing its indebtedness, the Company and its subsidiaries may be permitted to make dividends and distributions under such agreements if there is no event of default and certain pro-forma financial ratios (as defined by such agreements) are met.