Delaware |
7370 |
86-3078783 | ||
(State or other jurisdiction of incorporation or organization) |
(Primary Standard Industrial Classification Code Number) |
(I.R.S. Employer Identification Number) |
Large accelerated filer |
☐ |
Accelerated filer |
☐ | |||
Non-accelerated filer |
☒ |
Smaller reporting company |
||||
Emerging growth company |
Page |
||||
iii | ||||
v | ||||
1 | ||||
5 | ||||
29 | ||||
30 | ||||
31 | ||||
36 | ||||
48 | ||||
68 | ||||
76 | ||||
83 | ||||
86 | ||||
91 | ||||
93 | ||||
102 | ||||
106 | ||||
107 | ||||
111 | ||||
112 | ||||
113 |
• | our ability to develop and introduce new products and services successfully; |
• | our ability to compete in the market in which we operate; |
• | our ability to meet the price and performance standards of the evolving 5G New Radio products and technologies; |
• | our ability to expand our customer reach/reduce customer concentration; |
• | our ability to grow the IoT and mobile portfolio outside of North America; |
• | our ability to make scheduled payments on or to refinance our indebtedness; |
• | our ability to introduce and sell new products that comply with current and evolving industry standards and government regulations; |
• | our ability to develop and maintain strategic relationships to expand into new markets; |
• | our ability to properly manage the growth of our business to avoid significant strains on our management and operations and disruptions to our business; |
• | our reliance on third parties to manufacture components of our solutions; |
• | our ability to accurately forecast customer demand and timely delivery of sufficient product quantities; |
• | our reliance on sole source suppliers for some products, services and devices used in our solutions; |
• | the continuing impact of uncertain global economic conditions on the demand for our products; |
• | the impact of geopolitical instability on our business; |
• | the emergence of global public health emergencies, such as the outbreak of the 2019 novel coronavirus, now known as “COVID-19,” which could extend lead times in our supply chain and lengthen sales cycles with our customers; |
• | direct and indirect effects of COVID-19 on our employees, customers and supply chain and the economy and financial markets; |
• | the impact that new or adjusted tariffs may have on the costs of components or our products, and our ability to sell products internationally; |
• | our ability to be cost competitive while meeting time-to-market |
• | our ability to meet the product performance needs of our customers in wireless broadband data access markets; |
• | demand for software-as-a-service |
• | our dependence on wireless telecommunication operators delivering acceptable wireless services; |
• | the outcome of any pending or future litigation, including intellectual property litigation; |
• | infringement claims with respect to intellectual property contained in our solutions; |
• | our continued ability to license necessary third-party technology for the development and sale of our solutions; |
• | the introduction of new products that could contain errors or defects; |
• | conducting business abroad, including foreign currency risks; |
• | the pace of 5G wireless network rollouts globally and their adoption by customers; |
• | our ability to make focused investments in research and development; |
• | our ability to identify suitable acquisition candidates or to successfully integrate and realize the benefits of our past or future strategic acquisitions or investments, including our acquisitions of Business Mobility Partners Inc. and SIMON IoT LLC; |
• | our ability to hire, retain and manage additional qualified personnel to maintain and expand our business; |
• | the potential liquidity and trading of public securities; and |
• | the ability to raise financing in the future. |
December 31, | ||||||||||||
2021 | 2020 | 2019 | ||||||||||
Revenue |
$ | 248,217 | $ | 213,760 | $ | 169,152 | ||||||
Net loss |
(24,453 | ) | (35,201 | ) | (23,443 | ) | ||||||
Adjusted EBITDA |
59,754 | 57,819 | 50,885 |
• | Connected Health |
• | Fleet Management |
• | Asset Monitoring |
• | Communication Services |
• | Industrial IoT |
• | The 5G market may take longer to materialize than KORE expects or, if it does materialize rapidly, KORE may not be able to meet the development schedule and other customer demands. |
• | KORE’s development and investments in new technologies, may not generate operating income or contribute to future results of operations that meet its expectations. |
• | If KORE is unable to support customers with low latency and/or high throughput IoT use cases, its revenue growth and profitability will be harmed. |
• | If KORE is unable to effectively manage its increasingly diverse and complex businesses and operations, its ability to generate growth and revenue from new or existing customers may be adversely affected. |
• | The loss of KORE’s largest customers, particularly its single largest customer could significantly impact its revenue and profitability. |
• | KORE’s products are highly technical and may contain undetected errors, product defects, security vulnerabilities, or software errors. |
• | If there are interruptions or performance problems associated with the network infrastructure used to provide KORE’s services, customers may experience service outages, which may impact KORE’s reputation and future sales. |
• | KORE’s inability to adapt to rapid technological change in its markets could impair its ability to remain competitive and adversely affect its results of operations. |
• | The market for the products and services that KORE offers is rapidly evolving and highly competitive. KORE may be unable to compete effectively. |
• | If KORE is unable to protect its intellectual property and proprietary rights, its competitive position and its business could be harmed. |
• | Failure to maintain the security of KORE’s information and technology networks, including information relating to its customers and employees, could adversely affect KORE. |
• | KORE’s internal and customer-facing systems, and systems of third parties they rely upon, may be subject to cybersecurity breaches, disruptions, or delays. |
• | KORE is subject to evolving privacy laws that are subject to potentially differing interpretations in the United States as well as other jurisdictions that can adversely impact its business and require that it incur substantial costs. |
• | KORE’s technology contains third-party open-source software components and failure to comply with the terms of the underlying open-source software licenses could restrict KORE’s ability to provide its platform. |
• | KORE faces risks inherent in conducting business internationally, including compliance with international as well as U.S. laws and regulations that apply to its international operations. |
• | KORE may be subject to legal proceedings and litigation, including intellectual property and privacy disputes, which are costly to defend and could materially harm its business, financial condition and results of operations. |
• | KORE may be affected by fluctuations in currency exchange rates. |
• | KORE’s management has identified internal control deficiencies that have resulted in material weaknesses in its internal control over financial reporting. |
• | KORE’s future capital needs are uncertain, and KORE may need to raise additional funds in the future, but may not be able to raise such additional funds on acceptable terms or at all. |
• | KORE has a history of losses and may not be able to achieve or sustain profitability in the future. |
• | retaining key customers, key employees and key business relationships after the acquisition; |
• | managing a larger combined company and consolidating corporate and administrative infrastructures successfully; |
• | the inability to realize expected synergies and cost-savings; |
• | difficulties in managing geographically dispersed operations, including risks associated with entering markets in which we have no or limited prior experience; |
• | underperformance of any acquired business relative to our expectations and the price we paid; |
• | negative near-term impacts on financial results after an acquisition, including acquisition-related earnings charges; |
• | the assumption or incurrence of additional debt obligations or expenses, or use of substantial portions of our cash; |
• | the issuance of equity securities to finance or as consideration for any acquisitions that dilute the ownership of our stockholders; |
• | claims by terminated employees and shareholders of acquired companies or other third parties related to the transaction; |
• | problems maintaining uniform procedures, controls and policies with respect to our financial accounting systems; |
• | unanticipated issues in integrating information technology, communications, billing platforms, operational support systems and other systems; and |
• | risks associated with acquiring intellectual property, including potential disputes regarding acquired companies’ intellectual property. |
• | unexpected increases in manufacturing costs; |
• | interruptions in shipments if a third-party manufacturer is unable to complete production in a timely manner; |
• | inability to control quality of finished products; |
• | inability to control delivery schedules; |
• | inability to control production levels and to meet minimum volume commitments to our customers; |
• | inability to control manufacturing yield; |
• | inability to maintain adequate manufacturing capacity; and |
• | inability to secure adequate volumes of acceptable components at suitable prices or in a timely manner. |
• | Entity-Level Controls |
• | Financial Close Process |
• | Non-routine and Complex Transactions |
• | Procure to pay |
• | Information Technology General Controls “ITGCs”) |
• | We hired additional qualified accounting resources and outside resources to segregate key functions within our financial and information technology processes supporting our internal controls over financial reporting and to provide appropriate oversight and accountability over the performance of our internal controls. |
• | We are in the process of reassessing and formalizing the design of certain accounting and information technology policies relating to security and change management controls. |
• | We engaged an outside firm to assist management with (i) reviewing our current processes, procedures, and systems and assessing the design of controls to identify opportunities to enhance the design of controls that would address relevant risks identified by management, and (ii) enhancing and implementing protocols to retain sufficient documentary evidence to support the operating effectiveness of such controls. |
• | We plan to implement an application solution to enhance controls over inventory management and reporting. |
• | Continuing to enhance, and formalize our accounting, business operations, and information technology policies, procedures, and controls to achieve complete, accurate, and timely financial accounting, reporting and disclosures. |
• | Continuing to hire additional qualified accounting resources and utilize outside resources, where necessary. |
• | Completing the implementation of new financial processing systems to replace legacy systems and establish effective general controls over these systems to ensure that our automated process level controls and information produced and maintained in our IT systems is relevant and reliable. |
• | Designing and implementing controls that address the completeness and accuracy of underlying data used in the performance of controls over accounting transactions and disclosures. |
• | Developing monitoring controls and protocols that will allow us to timely assess the design and the operating effectiveness of controls over financial reporting and make necessary changes to the design of controls, if any. |
• | Reviewing the existing procure to pay cycle and implementing design enhancements to make the process more efficient and effective. |
• | the success of competitive services or technologies; |
• | developments related to our existing or any future collaborations; |
• | regulatory or legal developments in the United States and other countries; |
• | developments or disputes concerning our intellectual property or other proprietary rights; |
• | the recruitment or departure of key personnel; |
• | actual or anticipated changes in estimates as to financial results, development timelines or recommendations by securities analysts; |
• | variations in our financial results or those of companies that are perceived to be similar to us; |
• | general economic, industry and market conditions; and |
• | the other factors described in this “Risk Factors” section. |
• | a limited availability of market quotations for our securities; |
• | a determination that our common stock is a “penny stock” which will require brokers trading in our common stock to adhere to more stringent rules, possibly resulting in a reduced level of trading activity in the secondary trading market for our common stock; |
• | a limited amount of analyst coverage; and |
• | a decreased ability to issue additional securities or obtain additional financing in the future. |
• | Transaction accounting adjustments, which represent adjustments that are done in connection with the closing of the business combination, including the following: (i) the reverse recapitalization between CTAC and KORE; (ii) the net proceeds from the issuance of KORE Common Stock in the PIPE Investment; and (iii) the partial utilization of the Backstop Note. |
• | The equity holders of KORE held the majority (54%) of voting rights in the combined company; |
• | The senior management team of KORE became the senior management of the combined company; |
• | In comparison with CTAC, KORE had significantly more revenue and total assets and a larger net loss; and |
• | The operations of KORE comprise the ongoing operations of the combined company and the combined company assumed KORE’s headquarters. |
Total shares transferred |
38,967,924 | |||
|
|
|||
Value per share(1) |
10.00 | |||
|
|
|||
Total share consideration |
$ |
389,679,240 |
||
|
|
|||
A-1 Preferred Stock |
86,861,830 | |||
A Preferred Stock |
85,217,671 | |||
B Preferred Stock |
97,835,184 | |||
Option Cash Consideration |
4,075,000 | |||
First LTIP Payment |
1,050,000 | |||
Less: Preferred stock settled in common stock |
(40,000,000 | ) | ||
|
|
|||
Total cash consideration |
$ |
235,039,685 |
||
|
|
|||
Total purchase consideration |
$ |
624,718,925 |
||
|
|
(1) | Closing Share Consideration is calculated using $10.00 reference price. As the business combination is accounted for as a reverse recapitalization, the value per share is disclosed for informational purposes only in order to indicate the fair value of shares transferred. |
Shares Outstanding |
% | |||||||
KORE Stockholders |
38,968 | 54.1 | % | |||||
|
|
|
|
|||||
Total KORE Stockholders |
38,968 | 54.1 | % | |||||
|
|
|
|
|||||
CTAC Public Shares |
3,676 | 5.1 | % | |||||
|
|
|
|
|||||
CTAC Founder Shares |
6,698 | 9.3 | % | |||||
|
|
|
|
|||||
Total CTAC Shares |
10,374 | 14.4 | % | |||||
|
|
|
|
|||||
PIPE investors |
22,686 | 31.5 | % | |||||
|
|
|
|
|||||
Pro Forma KORE Common Stock at December 31, 2021 |
72,028 | 100.0 | % | |||||
|
|
|
|
* | Amounts and percentages include the impact of option share consideration withheld to cover the employee portion of payroll taxes as the shares were not outstanding common stock at the time of Closing. |
For the Year Ended December 31, 2021 |
January 1, 2021 - September 29, 2021 |
For the Year Ended December 31, 2021 |
||||||||||||||||||
KORE (Historical) |
CTAC (Historical) |
Transaction Accounting Adjustments |
Pro Forma Combined |
|||||||||||||||||
Revenue: |
||||||||||||||||||||
Revenue |
$ | 248,217 | — | — | $ | 248,217 | ||||||||||||||
Cost of revenue: |
||||||||||||||||||||
Cost of revenue |
122,224 | — | — | 122,224 | ||||||||||||||||
Operating expenses: |
||||||||||||||||||||
Selling, general and administrative |
91,733 | 6,083 | 788 | A |
92,566 | |||||||||||||||
— | (6,038 | ) | B |
— | ||||||||||||||||
Selling, general and administrative - related party |
— | 753 | (753 | ) | B |
— | ||||||||||||||
Depreciation and amortization |
50,414 | — | — | 50,414 | ||||||||||||||||
|
|
|
|
|
|
|
|
|||||||||||||
Total operating expenses |
142,147 |
6,836 |
(6,003 |
) |
142,980 |
|||||||||||||||
|
|
|
|
|
|
|
|
|||||||||||||
Operating profit (loss) |
(16,154 |
) |
(6,836 |
) |
6,003 |
(16,987 |
) | |||||||||||||
Other income (expense): |
||||||||||||||||||||
Interest expense, including amortization of debt financing costs, net |
(23,260 | ) | — | 1,056 | C |
(27,290 | ) | |||||||||||||
30 | D |
|||||||||||||||||||
(5,116 | ) | E |
||||||||||||||||||
Change in fair value of warrant liability |
5,267 | 3,119 | (5,281 | ) | F |
81 | ||||||||||||||
(3,024 | ) | G |
||||||||||||||||||
Investment income from trust account |
— | 19 | (19 | ) | H |
— | ||||||||||||||
|
|
|
|
|
|
|
|
|||||||||||||
Loss before income taxes |
(34,147 |
) |
(3,698 |
) |
(6,351 |
) |
(44,196 |
) | ||||||||||||
Income tax provision (benefit) |
||||||||||||||||||||
Current |
177 | — | 489 | I |
666 | |||||||||||||||
Deferred |
(9,871 | ) | — | — | (9,871 | ) | ||||||||||||||
|
|
|
|
|
|
|
|
|||||||||||||
Total income tax provision (benefit) |
(9,694 |
) |
— |
489 |
(9,205 |
) | ||||||||||||||
|
|
|
|
|
|
|
|
|||||||||||||
Net loss |
$ |
(24,453 |
) |
(3,698 |
) |
(6,840 |
) |
$ |
(34,991 |
) | ||||||||||
|
|
|
|
|
|
|
|
|||||||||||||
KORE (Historical) |
CTAC (Historical) |
Pro Forma Combined |
||||||||||||||||||
Basic and diluted weighted average shares outstanding of Class A ordinary shares |
41,933,050 | 26,735,238 | 72,027,743 | |||||||||||||||||
Basic and diluted net loss per share, Class A ordinary Shares |
$ | (1.03 | ) | $ | — | $ | (0.43 | ) | ||||||||||||
Basic and diluted weighted average shares outstanding of Class B ordinary shares |
— | 6,479,225 | — | |||||||||||||||||
Basic and diluted net loss per share, Class B ordinary Shares |
$ | — | $ | (0.57 | ) | $ | — |
1. |
Basis of Presentation |
• | KORE’s audited consolidated statement of operations for the year ended December 31, 2021 and the related notes, included elsewhere in this prospectus |
2. |
Accounting Policies |
3. |
Adjustments to Summary Pro Forma Information |
(A) | Reflects expense of $788,000 related to the recognition of the portion of the Second LTIP (and exclude everything after $1,050,000) which was not previously recognized in the KORE 2021 income statement. |
(B) | Reflects the reversal of capitalizable transaction costs and related party expenses which would not have been expensed and the recognition of non-capitalizable transaction cost which would have been expensed immediately had the transaction taken place January 1, 2021. |
(C) | Reflects the elimination of historical interest expense during the nine months ended September 30, 2021 on the revolving credit facility repaid through the transaction proceeds. |
(D) | Reflects the elimination of historical interest expense on the related party notes repaid through the transaction proceeds. |
(E) | Reflects interest expense and amortization of debt issuance costs related to the Backstop Notes. |
(F) | Reflects the elimination of the historical change in fair value of the KORE warrant liability of $(5.3) million due to the settlement of the KORE Warrants through KORE Common Stock for the year ended December 31, 2021. |
(G) | Reflects the elimination of the historical change in fair value of the CTAC public warrant liability of $3.0 million due to the reclassification of the public warrants from liability classified instruments to equity classified instruments at the close of the business combination for the year ended December 31, 2021. |
(H) | Reflects the elimination of investment income on the trust account. |
(I) | Reflects tax effects of income statement pro forma adjustments above. |
4. |
Loss per Share |
For the year ended December 31, 2021 |
||||
Pro forma net loss |
$ | (34,991 | ) | |
Premium on preferred conversion to common shares |
4,074 | |||
|
|
|||
(30,917 | ) | |||
Weighted average shares outstanding of common stock |
72,027,743 | |||
Net loss per share (Basic and Diluted) attributable to common stockholders |
$ | (0.43 | ) |
December 31 |
||||||||||||
2021 |
2020 |
2019 |
||||||||||
Revenue |
$ | 248,217 | $ | 213,760 | $ | 169,152 | ||||||
Net loss |
(24,453 | ) | (35,201 | ) | (23,443 | ) | ||||||
Adjusted EBITDA |
59,754 | 57,819 | 50,885 |
• | Connected Health |
• | Fleet Management |
• | Asset Monitoring |
• | Communication Services |
• | Industrial IoT |
Product line |
Products |
Product description |
Primary pricing method | |||
IoT Connectivity 68% and 74% of full year 2021 and 2020 revenue, respectively |
IoT Connectivity as a Service (CaaS) |
• IoT Connectivity services offered through our IoT platform ‘KORE One’ ™ |
||||
• Our connectivity solutions allow devices to seamlessly and securely connect anywhere in the world across any connected network, which we call our multiple devices, multiple locations, multiple carriers CaaS multi-value proposition |
Per subscriber per month for lifetime of device (7-10 years and growing)Multi-year contracts with automatic renewals | |||||
IoT Connectivity Enablement as a Service (CEaaS) |
• IoT Connectivity Management Platform as a Service (or individual KORE One engine) • Cellular Core Network as a Service (Cloud Native Evolved Packet Core “EPC”) |
|||||
IoT Solutions 32% and 26% of full year 2021 and 2020 revenue, respectively |
IoT Device Management Services |
• Outsourced platform-enabled services (e.g., logistics, configuration, device management) • Sourcing of third-party devices globally, device design and selection services |
Upfront fee per device or per device per month | |||
IoT Security Location Based Services (LBS) |
• KORE’s SecurityPro ® SaaS platform• KORE’s PositionLogic ® SaaS platform and LBS APIs |
Per subscriber per month |
• | IoT Device Management Services: |
• | Location Based Services ® ) platform for location and asset tracking; and |
• | IoT Security (SecurityPro ® ): |
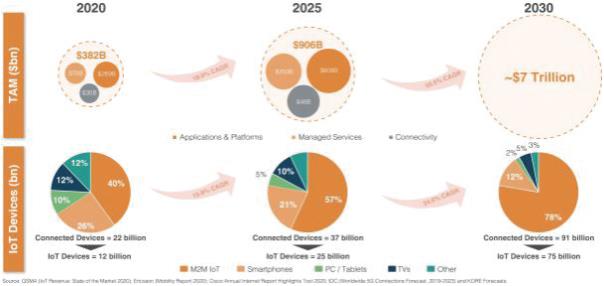
• | Massive TAM and Disruptive End-Market Use Cases |
• | KORE Touchpoints |
• | Provides 5G connectivity and simplified management with 5G-ready eSIM and eUICC technology and multi-value proposition enabled by the proprietary KORE One platform. |
• | Enables seamless transition to 5G with its strength in carrier relationships and experience in managing network transitions. |
• | Accelerates 5G use cases with pre-configured solutions and an industry-specific IoT Managed Services portfolio. |
• | Enables edge deployments with a roadmap for a fully virtualized multi-carrier gateway on the Edge (KORE Anywhere). |
• | Enables private network deployments with a fully virtualized core network (Cloud Native EPC). |
• | Leveraging eSIMs coupled with eUICC Technology. IoT-connected devices expected to come online, with approximately 25 billion devices by 2025. One of the bigger challenges to achieving this growth is current SIM card technology. Today, the vast majority of cellular connected devices are using SIM cards which are locked into a specific cellular carrier. eSIMs and eUICC technology offers several benefits over traditional SIM card technology, including: |
• | Enables devices to store multiple operator profiles on a device simultaneously and switch between them remotely. |
• | Allows remote updates. |
• | Permits remote SIM provisioning of any mobile device. |
• | Delivers an effective way to significantly increase data security. |
• | Offers protection from evolving network technologies, such as the retirement of legacy services like 2G and 3G. In some cases, eSIM technology plays a critical role providing secure out-of-the |
• | For IoT Connectivity services: T-Mobile and Vodafone; Mobile Virtual Network Operators such as Aeris, Wireless Logic; and Twilio, Inc. |
• | For IoT Solutions and Analytics: |
• | Significant organic volume growth from existing customer base |
• | Cross-sell and upsell KORE’s growing portfolio of IoT Solutions to our large base of IoT Connectivity services only customers |
• | Deepening our presence in focused industry sectors pre-configured industry solutions. |
• | Enhance “AIoT” (Artificial Intelligence + IoT) and Edge Analytics capabilities in target industries. |
• | Drive growth through strategic, accretive acquisitions, which add key capabilities. |
• | KORE’s IoT Connectivity Services: |
• | CaaS ® , KORE eSIM, and Cloud Native EPC |
• | CEaaS ® |
• | KORE’s IoT Solutions and Analytics |
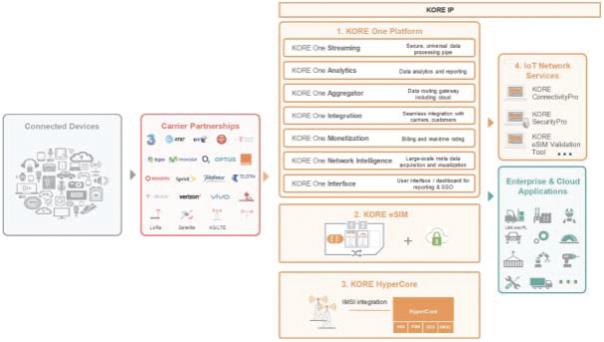
1. |
KORE One ™ Platform |
2. |
KORE eSIM |
3. |
Cloud Native EPC (Cellular Network as a Service) |
4. |
IoT Network and Application Services |
a. | ConnectivityPro ® : |
b. | SecurityPro ® : |
c. | PositionLogicTM: in-vehicle video, cargo monitoring, safety & security etc. |
• | Connected Health |
• | Fleet Management |
• | Asset Monitoring |
• | Communication Services |
• | Industrial IoT |
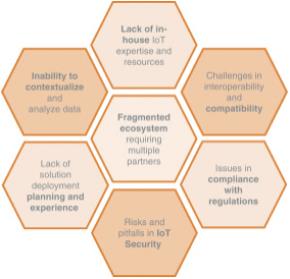
• | Lack of readily available in-house IoT resources and expertise |
• | Significant time required to get to market |
• | High failure rate of IoT initiatives |
• | A highly fragmented vendor landscape |
• | An ecosystem that is quickly evolving and changing rapidly |
• | Substantial and increasing regulatory/compliance issues |
• | Interoperability and compatibility with assorted technologies |
• | We believe KORE One is now an industry leading platform for IoT subscription and network management, and which provides us with a competitive edge in the market. |
• | Amongst industry analysts, KORE has continued to establish and improve its position as the only pure play IoT enabler. Recognized in 2019 by Gartner as the only independent service provider to be named a “Leader” in the Magic Quadrant for Managed IoT Connectivity Services, KORE continued its upward momentum in 2020 as it improved upon its position to be ranked among the top global services providers within the same category. |
• | KORE’s product portfolio has expanded significantly. A few years ago KORE was primarily IoT Connectivity Services focused while today its product portfolio includes IoT Solutions such as IoT Deployment Services and Security Software and Services. KORE’s IoT Connectivity Services have also become richer through the addition of the eSIMs and “Connectivity Enablement as a Service” to the IoT Connectivity Services product portfolio. |
• | IoT Solutions has increased as a proportion of KORE’s total revenue each year since 2018. For the years ended December 31, 2021, and 2020, respectively, IoT Solutions represented 32% and 26% of KORE’s total revenue. |
• | For IoT Connectivity T-Mobile and Vodafone; Mobile Virtual Network Operators such as Aeris and Wireless Logic; |
• | For IoT Solutions and Analytics |
• | Organic volume growth - leveraging the strong IoT industry growth expressed in terms of our customers’ revenue, device and data usage growth, while continuing to maintain high customer retention |
• | Cross-sell and upsell - selling KORE’s growing portfolio of IoT Solutions developed during the prior two years and going-forward, to our large base of IoT connectivity services only customers |
• | Deepening our presence in focused industry sectors - developing more of a vertical orientation in our business and deepening industry domain knowledge that will in turn allow the development and deployment of pre-configured industry solutions |
• | Enhancing AIoT (Artificial Intelligence + IoT) and Edge Analytics capabilities |
• | Strategic acquisitions that will allow KORE to expand our IoT Solutions and advanced IoT connectivity capabilities while ensuring a highly disciplined use of capital for such acquisitions |
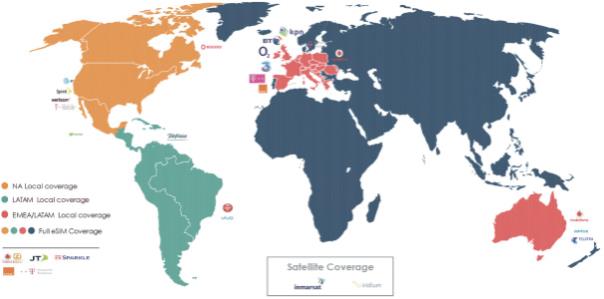
• | The number of carrier integrations (44) |
• | KORE One platform (7 engines) |
• | ConnectivityPro service and related APIs |
• | eSIM technology stack/ proprietary IP |
• | Hypercore technology |
• | Deep industry vertical knowledge and experience ( e.g. |
• | Breadth of solutions and analytics services |
• | 3,300+ connectivity-only customers provides us a unique opportunity to cross-sell and upsell our existing connectivity-only customers |
• | Services: IoT Connectivity services and IoT Solutions services. |
• | Products: SIMs (IoT Connectivity) and IoT devices (IoT Solutions). |
Years Ended December 31 |
Change 2021 |
|||||||||||||||
2021 |
2020 |
$ |
% |
|||||||||||||
Services |
$ | 187,962 | $ | 172,845 | $ | 15,117 | 9 | % | ||||||||
Products |
60,255 | 40,915 | 19,340 | 47 | % | |||||||||||
Total Revenue |
$ |
248,217 |
$ |
213,760 |
$ |
34,457 |
16 |
% |
Years Ended December 31 |
Change 2021 |
|||||||||||||||
2021 |
2020 |
$ |
% |
|||||||||||||
IoT Connectivity |
$ | 168,804 | $ | 158,748 | $ | 10,056 | 6 | % | ||||||||
IoT Solutions |
79,413 | 55,012 | 24,401 | 44 | % | |||||||||||
|
|
|
|
|
|
|||||||||||
Total Revenue |
$ | 248,217 | $ | 213,760 | $ | 34,457 | 16 | % | ||||||||
|
|
|
|
|
|
December 31 |
||||||||
2021 |
2020 |
|||||||
Period End Connections |
14.6 million | 11.8 million | ||||||
Average Connections Count for the Period |
13.4 million | 10.7 million |
(in thousands USD) |
Years Ended December 31 |
Change 2021 |
||||||||||||||
2021 |
2020 |
$ |
% |
|||||||||||||
Cost of services |
$ | 69,867 | $ | 64,520 | $ | 5,347 | 8 | % | ||||||||
Cost of product |
52,357 | 33,410 | 18,947 | 57 | % | |||||||||||
|
|
|
|
|
|
|||||||||||
Total cost of revenue |
$ |
122,224 |
$ |
97,930 |
$ | 24,294 | 25 | % | ||||||||
|
|
|
|
|
|
Years Ended December 31 |
||||||||
Gross margin rate | 2021 |
2020 |
||||||
Cost of services |
62.8 | % | 62.7 | % | ||||
Cost of products |
13.1 | % | 18.3 | % | ||||
Total gross margins |
50.8 | % | 54.2 | % |
Years Ended December 31, |
Change 2021 |
|||||||||||||||
Cost of revenue | 2021 |
2020 |
$ |
% |
||||||||||||
Cost of IoT Connectivity |
$ | 66,567 | $ | 63,706 | $ | 2,861 | 4 | % | ||||||||
Cost of IoT Solutions |
55,657 | 34,224 | 21,433 | 63 | % | |||||||||||
|
|
|
|
|
|
|||||||||||
Total cost of revenue |
$ | 122,224 | $ | 97,930 | $ | 24,294 | 25 | % | ||||||||
|
|
|
|
|
|
Years Ended |
||||||||
Gross margin rate | 2021 |
2020 |
||||||
IoT Connectivity |
60.6 | % | 59.9 | % | ||||
IoT Solutions |
29.9 | % | 37.8 | % | ||||
Total gross margins |
50.8 | % | 54.2 | % |
Years Ended December 31 |
Change 2021 |
|||||||||||||||
2021 |
2020 |
$ |
% |
|||||||||||||
Selling, general and administrative |
$ | 91,733 | $ | 72,883 | $ | 18,850 | 26 | % |
Years Ended December 31 |
Change 2021 |
|||||||||||||||
2021 |
2020 |
$ |
% |
|||||||||||||
Depreciation and amortization |
$ | 50,414 | $ | 52,488 | $ | (2,074 | ) | (4 | )% |
Years Ended December 31 |
Change 2021 |
|||||||||||||||
2021 |
2020 |
$ |
% |
|||||||||||||
Interest expense, including amortization of deferred financing costs, net |
$ | 23,260 | $ | 23,493 | $ | (233 | ) | (1 | )% | |||||||
Change in fair value of warrant liability |
(5,267 | ) | 7,485 | (12,752 | ) | (170 | )% | |||||||||
|
|
|
|
|
|
|||||||||||
Total Other (Income) Expense |
$ | 17,993 | $ | 30,978 | $ | (12,985 | ) | (42 | )% | |||||||
|
|
|
|
|
|
Years Ended December 31 |
Change 2021 |
|||||||||||||||
2021 |
2020 |
$ |
% |
|||||||||||||
Income tax benefit |
$ | (9,694 | ) | $ | (5,318 | ) | $ | (4,376 | ) | 82 | % |
• | The Company closed the Business Combination on September 30, 2021, resulting in a net increase in cash of $63.2 million and a recapitalization of the Company’s equity structure. |
• | The Company used $14.9 million for the year ended December 31, 2021 and provided $26.5 million of cash flows from operating activities for the year ended December 31, 2020. |
• | The Company’s investment activity used $13.1 million and $11.6 million for the years ended December 31, 2021 and 2020, respectively, resulting primarily from capital expenditures during the period related to technology equipment, software licenses, and internally developed software. |
• | During the year ended December 31, 2021, the Company drew and repaid $25.0 million on its revolving credit facility. During the year ended |
(in thousands USD) |
For the Years Ended December 31 |
|||||||
2021 |
2020 |
|||||||
Net loss |
$ | (24,453 | ) | $ | (35,201 | ) | ||
Income tax expense (benefit) |
(9,694 | ) | (5,318 | ) | ||||
Interest expense |
23,260 | 23,493 | ||||||
Depreciation and amortization |
50,414 | 52,488 | ||||||
EBITDA |
39,527 |
35,462 |
||||||
|
|
|
|
|||||
Change in fair value of warrant liabilities (non-cash) |
(5,267 | ) | 7,485 | |||||
Transformation expenses |
8,937 | 7,354 | ||||||
Acquisition and integration-related restructuring costs |
11,287 | 5,709 | ||||||
Stock-based compensation (non-cash) |
4,564 | 1,161 | ||||||
Other income tax liability reversal (non-cash) |
— | 80 | ||||||
Foreign currency loss (gain) (non-cash) |
344 | 233 |
(in thousands USD) |
For the Years Ended December 31 |
|||||||
2021 |
2020 |
|||||||
Other |
478 | 335 | ||||||
Adjusted EBITDA |
$ |
59,870 |
$ |
57,819 |
||||
|
|
|
|
Customer Relationships |
10-13 years | |
Technology |
5-9 years | |
Carrier Contracts |
10 years | |
Trademarks |
9-10 years | |
Non-compete agreements |
3 years | |
Internally developed and computer acquired software |
3-5 years |
Name |
Age |
Title | ||
Romil Bahl | 53 | President, Chief Executive Officer and Director | ||
Paul Holtz | 45 | Executive Vice President and Chief Financial Officer and Treasurer | ||
Tushar Sachdev | 49 | Executive Vice President and Chief Technology Officer | ||
Louise Winstone | 43 | Executive Vice President and Chief Human Resources Officer | ||
Bryan Lubel | 57 | Executive Vice President, Connected Health | ||
Jack W. Kennedy Jr. | 46 | Executive Vice President, Chief Legal Officer and Secretary | ||
R. Michael Thurston | 57 | Senior Vice President and Corporate Controller | ||
Cheemin Bo-Linn |
68 | Director | ||
Timothy M. Donahue | 73 | Director (Chair) | ||
H. Paulett Eberhart | 68 | Director | ||
James Geisler | 55 | Director | ||
Robert P. MacInnis | 55 | Director | ||
Michael K. Palmer | 36 | Director | ||
Mark Neporent | 64 | Director | ||
Tomer Yosef-Or |
42 | Director |
• | the Class I directors are Timothy Donahue, Cheemin Bo-Linn and James Geisler and their terms will expire at the annual meeting of stockholders to be held in 2022; |
• | the Class II directors are Michael Palmer, Mark Neporent and H. Paulett Eberhart and their terms will expire at the annual meeting of stockholders to be held in 2023; and |
• | the Class III directors are Robert MacInnis, Tomer Yosef-Or and Romil Bahl and their terms will expire at the annual meeting of stockholders to be held in 2024. |
• | to review, oversee, and discuss with the independent registered public accounting firm their annual audit plan, including the timing and scope of audit activities, and monitor such plan’s progress and results during the year; |
• | discuss with our independent registered public accounting firm their independence from management; |
• | to elect, retain, compensate, oversee, and, if necessary, terminate, any independent registered public accounting firm engaged for the purpose of preparing or issuing an audit report or performing other audit, review, or attest services for the Company; |
• | to review and discuss the annual audited financial statements and quarterly financial statements, the form of audit opinion to be issued by the auditors, and the Company’s disclosures; |
• | oversee the financial reporting process and discussing with management and our independent registered public accounting firm the interim and annual financial statements that we file with the SEC; |
• | review and monitor our accounting principles, accounting policies, financial and accounting controls and compliance with legal and regulatory requirements; and |
• | establish procedures for (i) the receipt, retention, and treatment of complaints received by the Corporation regarding accounting, internal accounting controls, or auditing matters and (ii) the confidential, anonymous submission by employees of concerns regarding questionable accounting or auditing matters. |
• | to review at least annually the goals and objectives of the Company’s executive compensation plans, and modify these goals and objectives if the Committee deems it appropriate; |
• | to evaluate annually the performance of the Chief Executive Officer in light of the goals and objectives of the Corporation’s executive compensation plans; |
• | to evaluate at least annually the performance of the other executive officers of the Company in light of the goals and objectives of the Company’s executive compensation plan; |
• | to review and recommend to the Board the adoption of or changes to the compensation of the Corporation’s independent directors; and |
• | to review and approve all perquisites, special cash payments and other special compensation and benefit arrangements or other personal benefits to the Company’s executive officers and directors and recommend any changes to the Board with respect to directors. |
• | identifying individuals qualified to become members of the Board and ensure that the Board has the requisite expertise and that its membership consists of persons with sufficiently diverse and independent backgrounds; |
• | developing and recommending to the Board for approval standards for determining whether a director is independent; |
• | developing the criteria to be used by the Committee in recommending directors to the Board; |
• | overseeing the periodic self-evaluations of the Board and its committees; |
• | overseeing engagement with stockholders and proxy advisory firms; and |
• | reviewing and discussing with management disclosure of the Company’s corporate governance practices, including information regarding the operations of the Board committees, director independence and the director nominations process, and to recommend that this disclosure be included in the Company’s proxy statement or annual report on Form 10-K. |
(1) | On November 29, 2021, the Company announced Mr. Pamnani stepped down from his role as the Company’s Chief Financial Officer, effective November 23, 2021, and departed from the Company’s employment on February 28, 2022. |
Name and Principal Position |
Year |
Salary ($) |
Bonus ($)(1) |
Stock Awards ($)(2) |
Non-Equity Incentive Plan Compensation ($)(3) |
All Other Compensation ($)(4) |
Total ($) |
|||||||||||||||||||||
Romil Bahl |
2021 | 750,000 | 2,000,000 | 978,750 | 2,015,538 | 4,766,516 | ||||||||||||||||||||||
President and Chief Executive Officer |
2020 | 750,000 | 100,000 | — | 982,969 | 36,201 | 1,869,170 | |||||||||||||||||||||
Bryan Lubel |
2021 | 330,000 | 375,000 | 430,650 | 389,808 | 1,525,458 | ||||||||||||||||||||||
Executive Vice President, Connected Health |
2020 | 330,000 | — | 417,966 | 8,137 | 756,103 | ||||||||||||||||||||||
Tushar Sachdev |
2021 | 300,000 | 375,000 | 391,500 | 388,588 | 1,455,088 | ||||||||||||||||||||||
Executive Vice President and Chief Technology Officer |
— | |||||||||||||||||||||||||||
Puneet Pamnani |
2021 | 330,000 | 625,000 | 488,070 | 388,213 | 1,831,283 | ||||||||||||||||||||||
Former Executive Vice President and Chief Financial Officer |
2020 | 330,000 | — | 490,174 | 23,213 | 84.3,387 |
(1) | Mr. Bahl entered into two retention bonus agreements with KORE Wireless on March 31, 2020 and October 31, 2020, pursuant to which he received a retention bonus in an amount equal to $100,000 in the aggregate (the “ Retention Bonus |
(2) | The amounts reported in this column represent stock payments, computed in accordance with FASB ASC Topic 718, made pursuant to the option cancellation agreements described below under “Narrative to Summary Compensation Table – Equity Compensation”. |
(3) | The amounts reported in this column represent annual cash bonuses earned by our named executive officers, as further described below under “Narrative to Summary Compensation Table — Non-Equity Incentive Plan Information.” |
(4) | The amounts reported in this column represent the following: (a) the aggregate matching contributions to the KORE 401(k) Retirement Savings Plan made by the Company that vested in 2021 for Mr. Bahl ($8,700), Mr. Lubel ($7,425), Mr. Sachdev ($6,750) and Mr. Pamnani ($8,700); (b) health insurance and other welfare benefit premiums paid by the Company in 2021 on behalf of Mr. Bahl ($6,838), Mr. Sachdev ($6,838) and Mr. Pamnani ($4,513); (c) the contribution made by the Company in 2021 to the health savings account for Mr. Lubel ($7,383); and (d) cash payments made in 2021 pursuant to the option cancellation agreements described below under “Narrative to Summary Compensation Table – Equity Compensation” to Mr. Bahl ($2,000,000), Mr. Lubel ($375,000), Mr. Sachdev ($375,000) and Mr. Pamnani ($375,000). |
• | medical, dental and vision benefits for which the Company pays the full amount of the premiums on behalf of our named executive officers; |
• | medical and dependent care flexible spending accounts; |
• | short-term and long-term disability insurance and accidental death and dismemberment insurance; |
• | life insurance; and |
• | vacation and paid holidays. |
• | An annual cash retainer of $40,000 for each non-employee director; |
• | An annual cash retainer of $20,000 for each non-employee director chairing the Audit Committee, the Compensation Committee or the Nominating and Corporate Governance Committee; |
• | A restricted stock unit award with a grant date fair value of $150,000 for each director serving on the Board as of the Closing, with each such award vesting ratably on each of the four anniversaries of the Closing; |
• | An initial restricted stock unit award with a grant date fair value of $150,000 for each director appointed to the Board following the Closing, with each such award vesting ratably on each of the four anniversaries of the date of such appointment; and |
• | An annual restricted stock unit award with a grant date fair value of $150,000 granted as of the date of the annual meeting of stockholders of the Company, with each such award vesting upon the earlier of one year following the grant date or the date of the immediately subsequent annual meeting of stockholders of the Company. |
Name |
Fees earned or paid in cash ($) |
Total ($) |
||||||
Cheemin Bo-Linn |
$ | 17,966 | (1) |
$ | 17,966 | |||
Timothy M. Donahue |
— | — | ||||||
Robert P. MacInnis |
— | — | ||||||
Michael K. Palmer |
— | — | ||||||
Tomer Yosef-Or |
— | — | ||||||
Chan Galbato (2) |
— | — |
(1) | Reflects the prorated portion of the annual cash retainers earned by Dr. Bo-Linn in 2021 in respect of her service rendered to the Board following the Closing, which also includes a prorated portion of the $10,000 annual retainer for her service on the Compensation Committee and the Nomination and Corporate Governance Committee that was approved in April 2022. Dr. Bo-Linn’s restricted stock unit award was granted in January 2022 and therefore is not reflected in this table. |
(2) | Chan Galbato resigned from the Board effective February 16, 2022. |
• | each person who is known to be the beneficial owner of more than 5% of our voting shares; |
• | each of our executive officers and directors; and |
• | all of our executive officers and directors as a group. |
Name and Address of Beneficial Owner |
Number of KORE Shares |
% |
||||||
Entities affiliated with ABRY Partners LLC(1)(2) |
24,252,912 | 31.8 | % | |||||
Fortress Investment Group LLC(3)(4) |
11,333,333 | 14.9 | % | |||||
Wood River Capital, LLC(5) |
10,000,000 | 13.1 | % | |||||
CTAC Sponsor(6) |
6,970,342 | 9.1 | % | |||||
Terrdian CCPC (7) |
4,983,527 | 6.5 | % | |||||
Mudrick Capital Management L.P. (8) |
4,000,000 | 5.2 | % | |||||
Dotmar Investments Limited(9) |
3,904,742 | 5.1 | % | |||||
Directors and Executive Officers |
||||||||
Romil Bahl |
158,804 | * | ||||||
Tushar Sachdev |
28,072 | * | ||||||
Bryan Lubel |
18,171 | * | ||||||
Puneet Pamnani(**) |
38,065 | * | ||||||
Cheemin Bo-Linn |
— | — | ||||||
Timothy M. Donahue |
— | — | ||||||
Robert P. MacInnis |
— | — | ||||||
Michael K. Palmer |
— | — | ||||||
Tomer Yosef-Or |
— | — | ||||||
Mark Neporent |
— | — | ||||||
H. Paulett Eberhart |
— | — | ||||||
James Geisler |
— | — | ||||||
All current KORE directors and executive officers as a group (15 individuals) |
213,568 | * |
* |
Less than one percent |
** |
Mr. Pamnani stepped down as the Company’s CFO on November 23, 2021 and departed from the Company on February 28, 2022. His shares are excluded in the total for all directors and current executive officers as a group. |
(1) | 21,500,782 of the shares reported herein are owned directly by ABRY Partners VII, L.P. 1,240,202 of the |
shares reported herein are owned directly by ABRY Partners VII Co-Investment Fund, L.P. 24,316 of the shares reported herein are owned directly by ABRY Investment Partnership, L.P. 1,288,506 of the shares reported herein are owned directly by ABRY Senior Equity IV, L.P. 199,106 of the shares reported herein are owned directly by ABRY Senior Equity Co-Investment Fund IV, L.P. |
(2) | ABRY Partners VII, L.P., ABRY Partners VII Co-Investment Fund, L.P., ABRY Investment Partnership, L.P., ABRY Senior Equity IV, L.P. and ABRY Senior Equity Co-Investment Fund IV, L.P. (collectively the “ABRY Funds”) are managed and/or controlled by ABRY Partners, LLC (“ABRY I”) and ABRY Partners II, LLC (“ABRY II”) and/or their respective affiliates. ABRY I and ABRY II are investment advisors registered with the SEC. Royce Yudkoff, as managing member of ABRY I and sole member of certain of its affiliates, has the right to exercise investment and voting power on behalf of ABRY Investment Partnership, L.P. Peggy Koenig and Jay Grossman, as equal members of ABRY II and of certain of its affiliates, have the right to exercise investment and voting power on behalf of the ABRY Funds. Each of the Messrs. Yudkoff, Messrs. Grossman and Mses. Koenig disclaims any beneficial ownership of the securities held by the ABRY Funds other than to the extent of any pecuniary interest he may have therein, directly or indirectly. The business address of ABRY is 888 Boylston Street, Suite 1600, Boston, Massachusetts. |
(3) | The shares reported herein consist of (A)(i) 676,443 shares of common stock, (ii) 213,415 shares of common stock underlying warrants and (iii) 3,475,040 shares of common stock underlying the Exchangeable Notes held by Drawbridge Special Opportunities Fund LP (“DBSO”); (B)(i) 352,474 shares of common stock; (ii) 115,333 shares of common stock underlying warrants; and (iii) 621,680 shares of common stock underlying the Exchangeable Notes held by Drawbridge Special Opportunities Fund Ltd. (“DBSO Ltd”); (C)(i) 88,512 shares of common stock; (ii) 28,940 shares of common stock underlying warrants; and (iii) 162,320 shares of common stock underlying the Exchangeable Notes held by DBSO TRG Fund (A) L.P. (“TRG”); (D)(i) 154,897 shares of common stock; (ii) 50,645 shares of common stock underlying warrants; and (iii) 284,160 shares of common stock underlying the Exchangeable Notes held by Fortress Vintage Securities Fund LP (“Vintage”); (E)(i) 47,665 shares of common stock; and (ii) 4,576,000 shares of common stock underlying the Exchangeable Notes held by Fortress Lending Fund II Holdings LP (“Lending Fund”); and (F) (i) 5,009 shares of common stock; and (ii) 480,800 shares of common stock underlying the Exchangeable Notes held by Fortress Lending Fund II MA-CRPTF LP (“CRPTF”). Drawbridge Special Opportunities Advisors LLC, a Delaware limited liability company (“DBSO Advisors”), is the investment manager of DBSO and DPSO Ltd. Drawbridge Special Opportunities GP LLC (“DBSO GP”) is the general partner of DBSO. Fortress Principal Investment Holdings IV LLC, a Delaware limited liability company (“FPI IV”), is the managing member of DBSO GP. DBSO TRG Fund (A) Advisors LLC (“TRG Advisors”), is the investment manager of TRG, and TRG’s general partner is DBSO TRG Fund (A) GP LLC (“TRG GP”). Fortress Vintage Securities Fund Advisors LLC (“Vintage Advisors”), is the investment manager of Vintage and Fortress Vintage Securities Fund GP LLC (“Vintage GP”) is the general partner of Vintage. Fortress Lending Advisors II LLC (“FLA Advisors II”) is the investment manager of Lending Fund. FLF II MACRPTF Advisors LLC, a Delaware limited liability company (“FLF II Advisors”) is the investment manager of CRPTF. Fortress Principal Investment Holdings IV LLC, a Delaware limited liability company (“FPI IV”), is the managing member of DBSO GP. FIG LLC, a Delaware limited liability company, is the holder of all of the issued and outstanding interests of TRG Advisors, Vintage Advisors, FLA Advisors II and FLF II Advisors. Hybrid GP Holdings LLC, a Delaware limited liability company (“Hybrid GP”), is the sole member of TRG GP and Vintage GP. |
Fortress Operating Entity I LP, a Delaware limited partnership (“FOE I”), is the managing member of Hybrid GP and the Class A member of FIG LLC and DBSO GP. FIG Corp., a Delaware Corporation (“FIG Corp”), is the general partner of FOE I. Fortress Investment Group LLC, a Delaware limited liability company (“Fortress”), is the holder of all of the issued and outstanding shares of FIG Corp. |
(4) | Under the terms of the Exchangeable Notes, the holder thereof may not exercise the option to exchange the Exchangeable Notes for common stock to the extent such exercise would cause such holder, together with its attribution parties, to beneficially own a number of shares of common stock which would exceed 9.99% of our then outstanding common stock following such exercise (the “Blocker”), excluding for purposes of such determination shares of common stock issuable upon exercise of such Exchangeable Notes which have not been exercised. The table shows the number of shares of common stock that would be issuable upon the exercise in full of the Exchangeable Notes and does not give effect to the Blocker. |
(5) | Wood River Capital, LLC is beneficially owned by SCC Holdings, LLC (“SCC”), SCC is beneficially owned by KIM, LLC (“KIM”), KIM is beneficially owned by Koch Investments Group, LLC (“KIG”), KIG is beneficially owned by Koch Investments Group Holdings, LLC, and KIGH is beneficially owned by Koch Industries, Inc. (“Koch Industries”), in each case by means of ownership of all voting equity instruments. Koch Industries, SCC, KIM, KIG, and KIGH may be deemed to beneficially own the shares held by Wood River Capital, LLC by virtue of (i) Koch Industries’ beneficial ownership of KIGH, (ii) KIGH’s beneficial ownership of KIG, (iii) KIG’s beneficial ownership of KIM, (iv) KIM’s beneficial ownership of SCC and (v) SCC’s beneficial ownership of Wood River Capital, LLC but each of them disclaims beneficial ownership thereof. The business address of each of the foregoing entities and persons is 4111 E. 37th Street North, Wichita, KS 67220. |
(6) | Sponsor is the recordholder of the shares reported herein. The Sponsor is controlled by a board of managers comprised of Stephen A. Feinberg and Frank W. Bruno. Messrs. Feinberg and Bruno, as members of the board of managers of the Sponsor, have the sole right to exercise voting power with respect to the common stock held of record by the Sponsor, and have the sole right to consent to the transfer of such shares of common stock. The business address of the Sponsor is 875 Third Avenue, New York, New York 10022. |
(7) | Ontario 2833075 is the recordholder of the shares reported herein. Ontario 2833075 is a wholly-owned subsidiary of Terrdian CCPC. Terence Jarman, as President of Terrdian CCPC and Administrator of TDJ Company LLC, has the right to exercise investment and voting power on behalf of each of Terrdian CCPC and TDJ LLC. Mr. Jarman disclaims any beneficial ownership of the securities held by the TDJ Company LLC, other than to the extent of any pecuniary interest he may have therein, directly or indirectly. The business address of the foregoing persons is 10 High Point Rd, Toronto, Ontario M3B 2A4, Canada. |
(8) | The number of shares reported herein consists of 460,765 shares of common stock held of record by Blackwell Partners LLC Series A, 664,423 shares of common stock held of record by Boston Patriot Batterymarch St. LLC, 90,108 shares of common stock held of record by Mudrick Distressed Opportunity Drawdown Fund II SC, L.P, 792,987 shares of common stock held of record by Mudrick Distressed Opportunity Drawdown Fund II, L.P., 152,659 shares of common stock held of record by Mudrick Distressed Opportunity SIF Master Fund, L.P., 308,566 shares of common stock held of record by Mudrick Distressed Opportunity 2020 Dislocation Fund, L.P. and 1,530,492 shares of common stock held of record by Mudrick Distressed Opportunity Fund Global, L.P. Jason Mudrick is the founder, general partner and Chief Investment Officer of Mudrick Capital Management, L.P. (“Mudrick Capital”). Mr. Mudrick through Mudrick Capital, is responsible for the voting and investment decisions relating to such shares of common stock. Each of the aforementioned entities and individuals disclaims beneficial ownership of the shares of the common stock held of record by any other entity or individual explicitly named in this footnote except to the extent of such entity or individual’s pecuniary interest therein, if any. The address of each of the entities and individuals explicitly named in this footnote is c/o Mudrick Capital Management, L.P., 527 Madison Avenue, 6th Floor, New York, NY 10022. |
(9) | Dotmar Investments Limited is the recordholder of the shares reported herein. Richard Burston, as Chairman of Dotmar Investments Limited, has the right to exercise investment and voting power on behalf of Dotmar Investments Limited. Richard Burston disclaims any beneficial ownership of the securities held by the Dotmar Investments Limited other than to the extent of any pecuniary interest he may have therein, directly or indirectly. The business address of Dotmar Investments Limited is First Floor, 7 Esplanade, St Helier, Jersey JE2 3QA Channel Islands. |
Before the Offering |
After the Offering |
|||||||||||||||
Name of Selling Security holders |
Number of Shares of Common Stock |
Number of Shares of Common Stock Being Offered |
Number of Shares of Common Stock 2) |
Percentage of Outstanding Shares of Common Stock |
||||||||||||
Wood River Capital, LLC (1) |
10,000,000 | 10,000,000 | — | — | ||||||||||||
|
|
|
|
|||||||||||||
Mudrick Capital Management, L.P. (2) |
4,000,000 | 4,000,000 | — | — | ||||||||||||
Marathon Asset Management LP (3) |
2,000,000 | 2,000,000 | — | — | ||||||||||||
Liberty Mutual Investment Holdings LLC (4) |
1,300,000 | 1,300,000 | — | — | ||||||||||||
BlackRock, Inc. (5) |
1,000,000 | 1,000,000 | — | — | ||||||||||||
CVI Investments, Inc. (6) |
488,458 | 250,000 | 238,458 | * | ||||||||||||
Monashee Investment Management, LLC (7) |
600,000 | 600,000 | — | — | ||||||||||||
Jane Street Global Trading, LLC (8) |
451,165 | 150,000 | 301,165 | * | ||||||||||||
Owl Creek Investments III, LLC (9) |
450,000 | 450,000 | — | — | ||||||||||||
Ellington Warlander Partners LP (10) |
400,000 | 400,000 | — | — | ||||||||||||
Venor Capital Master Fund Ltd. (11) |
400,000 | 400,000 | — | — | ||||||||||||
Linden Capital L.P. (12) |
350,000 | 350,000 | — | — | ||||||||||||
Walleye Opportunities Master Fund, Ltd. (13) |
350,315 | 350,000 | 315 | * | ||||||||||||
Destinations Global Fixed Income Opportunities Fund (14) |
220,946 | 60,732 | 160,214 | * | ||||||||||||
Marshall Wace, LLP (15) |
200,000 | 200,000 | — | — | ||||||||||||
Tech Opportunities LLC (16) |
200,000 | 200,000 | — | — | ||||||||||||
RiverPark Strategic Income Fund (17) |
83,931 | 31,668 | 52,263 | * | ||||||||||||
Beryl Capital Partners II LP (18) |
41,917 | 41,917 | — | — | ||||||||||||
Cohanzick Absolute Return Master Fund, Ltd (19) |
7,600 | 7,600 | — | — | ||||||||||||
Beryl Capital Partners LP (20) |
3,407 | 3,407 | — | — | ||||||||||||
Corbin Hedged Equity Fund, L.P. (21) |
3,290 | 3,290 | — | — | ||||||||||||
Pinehurst Partners, L.P. (22) |
1,386 | 1,386 | — | — | ||||||||||||
Arena Investors, LP (23) |
500,000 | 500,000 | — | — | ||||||||||||
PlusTick Partners (QP) LP (24) |
250,000 | 200,000 | 50,000 | * | ||||||||||||
Total |
23,302,415 | 22,500,000 | 802,415 | 1.1 | % |
* | Less than 1% |
(1) | Wood River Capital, LLC is 100% owned by SCC Holdings, LLC (“SCC”), SCC is 100% owned by KIM, LLC (“KIM”), KIM is 100% owned by Koch Investments Group, LLC (“KIG”), KIG is 100% owned by Koch Investments Group Holdings, LLC, and KIGH is 100% owned by Koch Industries, Inc. (“Koch Industries”). Koch Industries, SCC, KIM, KIG, and KIGH may be deemed to beneficially own the shares held by Wood River Capital, LLC by virtue of (i) Koch Industries’ ownership of KIGH, (ii) KIGH’s ownership of KIG, (iii) KIG’s ownership of KIM, (iv) KIM’s ownership of SCC and (v) SCC’s ownership of Wood River Capital, LLC, but each of them disclaims beneficial ownership thereof. The business address of each of the foregoing entities and persons is 4111 E. 37th Street North, Wichita, Kansas 67220. |
(2) | The number of shares reported herein consists of 460,736 shares of common stock held of record by Blackwell Partners LLC Series A, 664,423 shares of common stock held of record by Boston Patriot Batterymarch St. LLC, 90,108 shares of common stock held of record by Mudrick Distressed Opportunity Drawdown Fund II SC, L.P, 792,987 shares of common stock held of record by Mudrick Distressed Opportunity Drawdown Fund II, L.P., 152,659 shares of common stock held of record by Mudrick Distressed Opportunity SIF Master Fund, L.P., 308,566 shares of common stock held of record by Mudrick Distressed Opportunity 2020 Dislocation Fund, L.P. and 1,530,492 shares of common stock held of record by Mudrick Distressed Opportunity Fund Global, L.P. Jason Mudrick is the founder, general partner and Chief Investment Officer of Mudrick Capital Management, L.P. (“Mudrick Capital”). Mr. Mudrick through Mudrick Capital, is responsible for the voting and investment decisions relating to such shares of common stock. Each of the aforementioned entities and individuals disclaims beneficial ownership of the shares of the common stock held of record by any other entity or individual explicitly named in this footnote except to the extent of such entity or individual’s pecuniary interest therein, if any. The address of each of the entities and individuals explicitly named in this footnote is c/o Mudrick Capital Management, L.P., 527 Madison Avenue, 6th Floor, New York, NY 10022. |
(3) | The number of shares reported herein consists of (i) 1,076,561 shares held by TRS Credit Fund LP; and (ii) 923,439 shares held by Marathon Bluegrass Credit Fund LP. Marathon Asset Management, L.P. is the manager of TRS Credit Fund LP and Marathon Blue Grass Credit Fund LP. The general partner of Marathon Asset Management, L.P. is Marathon Asset Management GP, L.L.C. (the “General Partner”). Bruce Richards and Louis Hanover are the managing members of the General Partner; however, this shall not be deemed to be an admission that any of the foregoing entities nor Messrs. Richards or Hanover are the beneficial owner of the shares reported herein for purposes of Section 13 of the Securities Exchange Act of 1934, or for any other purpose. The business address of the foregoing persons is One Bryant Park, 38th Floor, New York, NY 10036. |
(4) | The shares are held by Liberty Mutual Investment Holdings LLC (“LMIH”), whose six insurance company managing members are each ultimately controlled by Liberty Mutual Holding Company Inc., a mutual holding company. The Chief Investment Officer of each of the managing members of LMIH exercises dispositive power over the shares of Class A common stock being registered for resale in this prospectus. The business address of LMIH is 175 Berkeley Street, Boston MA 02116. |
(5) | The registered holders of the referenced shares to be registered are the funds and accounts under management by subsidiaries of BlackRock, Inc.: BlackRock Credit Alpha Master Fund, LP; HC NCBR Fund; and The Obsidian Master Fund. BlackRock, Inc. is the ultimate parent holding company of such subsidiaries. On behalf of such subsidiaries, the applicable portfolio managers, as managing directors (or in other capacities) of such entities, and/or the applicable investment committee members of such funds and accounts, have voting and investment power over the shares held by the funds and accounts which are the registered holders of the referenced shares. Such portfolio managers and/or investment committee members expressly disclaim beneficial ownership of all shares held by such funds and accounts. The address of such funds and accounts, such subsidiaries and such portfolio managers and/or investment committee members is 55 East 52nd Street, New York, NY 10055. Shares shown include only the securities being registered for resale and may not incorporate all shares deemed to be beneficially held by the registered holders or BlackRock, Inc. |
(6) | Heights Capital Management, Inc., the authorized agent of CVI Investments, Inc. (“CVI”), has discretionary authority to vote and dispose of the shares held by CVI and may be deemed to be the beneficial owner of these shares. Martin Kobinger, in his capacity as Investment Manager of Heights Capital Management, Inc., may also be deemed to have investment discretion and voting power over the shares held by CVI. Mr. Kobinger disclaims any such beneficial ownership of the shares. The principal business address of CVI is c/o Heights Capital Management, Inc., 101 California Street, Suite 3250, San Francisco, California 94111. |
(7) | The number of shares reported herein consists of 183,127 shares of common stock held of record by DS Liquid Div RVA MON LLC (“DS”), 153,340 shares of common stock held of record by BEMAP Master Fund Ltd. (“BEMAP”), 119,179 shares of common stock held of record by Monashee Solitario Fund LP |
(“Solatrio”), 95,372 shares of common stock held of record by Monashee Pure Alpha SVP I LLP (“Pure Alpha”), 26,586 shares of common stock held of record by SFL SPV I LLC (“SFL”) and 22,396 shares of common stock held of record by Bespoke Alpha MAC MIM LP (“Bespoke”). Each of DS, BEMAP, Solitario, Pure Alpha, SFL and Bespoke is managed by Monashee Investment Management, LLC (“Monashee Management”). Jeff Muller is CCO of Monashee Management and has voting and investment control over Monashee Management and, accordingly, may be deemed to have beneficial ownership of such shares held by DS, BEMAP, Solitario, Pure Alpha, SFL, and Bespoke. Jeff Muller, however, disclaims any beneficial ownership of the shares held by these entities. The business address of DS, BEMAP, Solitario, Pure Alpha, SFL, Bespoke, Monashee Management and Mr. Muller is c/o Monashee Investment Management, LLC, 75 Park Plaza, 2nd Floor, Boston, MA 02116. |
(8) | Jane Street Global Trading, LLC is a wholly owned subsidiary of Jane Street Group, LLC. Michael A. Jenkins and Robert. A. Granieri are the members of the Operating Committee of Jane Street Group, LLC. By virtue of the relationship between Jane Street Global Trading, LLC, Jane Street Group, LLC, Mr. Jenkins and Mr. Granieri, each of Jane Street Group, LLC, Mr. Jenkins and Mr. Granieri may be deemed to beneficially own the shares held by Jane Street Global Trading, LLC. Each of Jane Street Group, LLC, Mr. Jenkins and Mr. Granieri disclaim beneficial ownership of the shares, except to the extent of their pecuniary interest. The principal business address of the entity is 250 Vesey Street, 3rd Floor, New York, NY 10281. |
(9) | Owl Creek Asset Management, L.P., as manager of Owl Creek Investments III, LLC (“OC III”), may be deemed to control OC III. Owl Creek GP, L.L.C., as general partner of Owl Creek Asset Management, L.P., may be deemed to control Owl Creek Asset Management, L.P. Jeffrey A. Altman, as managing member of Owl Creek GP, LLC may be deemed to control such entity. Each of Owl Creek Asset Management, L.P. and Jeffrey A. Altman disclaim beneficial ownership of the shares, except to the extent of their pecuniary interest. The principal business address of the entities and individuals explicitly named in this footnote is 250 640 Fifth Ave 20th Floor New York, NY 10019. |
(10) | Ellington Management Group, LLC is the investment manager of Ellington Warlander Partners LP. Eric Cole, as managing director of Ellington Management Group, LLC may be deemed to control such entity. Each of Ellington Warlander Partners LP and Eric Cole disclaim beneficial ownership of the shares, except to the extent of their pecuniary interest. The principal business address of the entities and individuals explicitly named in this footnote is 53 Forest Avenue, Old Greenwich. CT 06870. |
(11) | Venor Capital Management LP is the investment adviser to Venor Capital Master Fund Ltd. Each of Jeffrey Bersh and Michael Wartell, as Co-Chief Investment Officers of Venor Capital Management LP may be deemed to control such entity. The principal business address of the entities and individuals explicitly named in this footnote is 142 West 57th Street, 11th Floor, New York, NY 10019. |
(12) | The securities held by Linden Capital L.P. are indirectly held by Linden Advisors LP (the investment manager of Linden Capital L.P.), Linden GP LLC (the general partner of Linden Capital L.P.), and Mr. Siu Min (Joe) Wong (the principal owner and the controlling person of Linden Advisors LP and Linden GP LLC). Linden Capital L.P., Linden Advisors LP, Linden GP LLC and Mr. Wong share voting and dispositive power with respect to the securities held by Linden Capital L.P. The principal business address of the entity is 590 Madison Ave, 15th Floor, New York, NY 10022. |
(13) | Walleye Capital LLC (“Walleye Capital”) is the investment manager of Walleye Opportunities Master Fund Ltd. (“Walleye Master”) and Mike Martin is a portfolio manager employed by Walleye Capital managing the securities. By virtue of these relationships, Walleye Capital and Mr. Martin may be deemed to beneficially own the securities held by Walleye Master. Walleye Capital and Mr. Martin disclaim beneficial ownership of any of the shares of our Common Stock they may be deemed to beneficially own except to the extent of their respective pecuniary interest therein. The address for Walleye Capital, Walleye Master and Mr. Martin is 2800 Niagara Lane N, Plymouth MN 55447. |
(14) | Mr. David K. Shannon has voting and/or investment control over the shares held by Destinations Global Fixed Income Opportunities Fund. Mr. Shannon disclaims beneficial ownership of the shares held by Destinations Global Fixed Income Opportunities Fund except to the extent of his pecuniary interest. The principal business address of the entity is 427 Bedford Road Suite 230, Pleasantville, NY 10570. |
(15) | Number of shares registered for sale includes (i) 94,875 held by Marshall Wace Investment Strategies - Eureka Fund, (ii) 52,936 held by Marshall Wace Investment Strategies - Market Neutral TOPS Fund, (iii) 20,695 held by Marshall Wace Investment Strategies - Systematic Alpha Plus Fund and (iv) 31,494 held by Marshall Wace Investment Strategies - TOPS Fund (collectively, the “Marshall Wace Funds”). Marshall Wace, LLP, a limited liability partnership formed in England (the “Investment Manager”), is the investment manager of each of the Marshall Wace Funds. Each of the Marshall Wace Funds are sub-trusts of Marshall Wace Investment Strategies, an umbrella unit trust established in Ireland with limited liability between sub-trusts. The Investment Manager has delegated certain authority for US operations and trading to Marshall Wace North America L.P. Each of the foregoing other than the Investment Manager disclaims beneficial ownership of the securities listed above. The address of the Marshall Wace Funds is 32 Molesworth Street, Dublin 2, Ireland. |
(16) | Hudson Bay Capital Management LP, the investment manager of Tech Opportunities LLC, has voting and investment power over these securities. Sander Gerber is the managing member of Hudson Bay Capital GP LLC, which is the general partner of Hudson Bay Capital Management LP. Each of Tech Opportunities LLC and Sander Gerber disclaims beneficial ownership over these securities. The principal business address of the entities and individuals explicitly named in this footnote is 28 Havemeyer Place, 2nd Floor Greenwich, CT 06830. |
(17) | Mr. David K. Shannon has voting and/or investment control over the shares held by RiverPark Strategic Income Fund. Mr. Shannon disclaims beneficial ownership of the shares held by RiverPark Strategic Income Fund except to the extent of his pecuniary interest. The principal business address of the entity is 427 Bedford Road Suite 230, Pleasantville, NY 10570. |
(18) | Mr. David Witkin has voting and/or investment control over the shares held by Beryl Capital Partners II LP as sole member of the managing member of the general partner. Mr. Witkin disclaims beneficial ownership of the shares held by Beryl Capital Partners II LP except to the extent of his pecuniary interest. The principal business address of the entity is 1611 S Catalina Ave, STE 309, Redondo Beach, CA 90277. |
(19) | Mr. David K. Shannon has voting and/or investment control over the shares held by Cohanzick Absolute Return Master Fund, Ltd. Mr. Shannon disclaims beneficial ownership of the shares held by Cohanzick Absolute Return Master Fund, Ltd except to the extent of his pecuniary interest. The principal business address of the entity is 427 Bedford Road Suite 230, Pleasantville, NY 10570. |
(20) | Mr. David Witkin has voting and/or investment control over the shares held by Beryl Capital Partners LP as sole member of the managing member of the general partner. Mr. Witkin disclaims beneficial ownership of the shares held by Beryl Capital Partners LP except to the extent of his pecuniary interest. The principal business address of the entity is 1611 S Catalina Ave, STE 309, Redondo Beach, CA 90277. |
(21) | Corbin Capital Partners, L.P. (“CCP”) is the investment manager of Corbin Hedged Equity Fund, L.P., CCP and its general partner, Corbin Capital Partners Group, LLC, may be deemed beneficial owners of the Company securities being registered in the Registration Statement on behalf of Corbin Hedged Equity Fund, L.P. The principal business address of the entity is 590 Madison Avenue, 31st Floor, New York, NY 10022. |
(22) | CCP is the investment manager of Pinehurst Partners, L.P., CCP and its general partner, Corbin Capital Partners Group, LLC, may be deemed beneficial owners of the Company securities being registered in the Registration Statement on behalf of Pinehurst Partners, L.P. The principal business address of the entity is 590 Madison Avenue, 31st Floor, New York, NY 10022. |
(23) | The number of shares reported herein consists of (i) 60,185 shares held by Arena Finance Markets, LP, (ii) 92,543 shares held by Arena Special Opportunities Fund, LP, (iii) 26,945 shares held by Arena Special Opportunities (Offshore) Master, LP, (iv) 170,152 shares held by Arena Special Opportunities Partners I, LP, (v) 36,992 shares held by Arena Special Opportunities Partners (Cayman Master) I, LP, (vi) 113,183 shares held by Arena Special Opportunities Partners II, LP (collectively, the “Arena Funds”). Arena Investors, LP is the investment adviser of, and may be deemed to beneficially own securities owned by the Arena Funds (the “Investment Advisor”). Arena Investors GP, LLC is the general partner of, and may be deemed to beneficially own securities owned by the Investment Advisor. Each of the Investment Advisor and either the managing member share voting and disposal power over the shares held by the entity described above. Each of the persons set forth above other than applicable entity holding such shares disclaims beneficial ownership of the shares beneficially owned by such entity and this disclosure shall not be construed as an admission that any such person or entity is the beneficial owner of any such securities. The address for the entities set forth above is 405 Lexington Avenue, 59th Floor, New York, New York 10174. |
(24) | PlusTick Management, LLC, as managing member of PlusTick Partners (QP) LP may be deemed to control PlusTick Partners (QP) LLP. PlusTick Management, LLC is controlled by its managing member, Thomas J. Hill, who has voting and investment power over the shares. The business address of the foregoing entities is 200 6th Street NE, Charlottesville, VA 22902. |
( in thousands USD ) |
December 31, 2021 |
December 31, 2020 |
||||||
Interfusion B.V. |
— | $ | 985 | |||||
T-Fone B.V. |
— | $ | 630 |
• | any person who is, or at any time during the applicable period was, one of our executive officers or directors; |
• | any person who is known by us to be the beneficial owner of more than 5% of our voting stock; |
• | any immediate family member of any of the foregoing persons, which means any child, stepchild, parent, stepparent, spouse, sibling, mother-in-law, father-in-law, son-in-law, daughter-in-law, in-law or sister-in-law |
• | any firm, corporation or other entity in which any of the foregoing persons is a partner or principal, or in a similar position, or in which such person has a 10% or greater beneficial ownership interest. |
• | in whole and not in part; |
• | at $0.10 per warrant upon a minimum of 30 days’ prior written notice of redemption provided that holders will be able to exercise their warrants on a cashless basis prior to redemption and receive that number of shares determined by reference to the table below, based on the redemption date and the “fair market value” of shares of our common stock except as otherwise described below; and |
• | if, and only if, the closing price of our common stock equals or exceeds $10.00 per public share (as adjusted for stock splits, stock recapitalizations, reorganizations, recapitalizations and the like) for any twenty (20) trading days within the thirty (30)-trading day period ending three trading days before we send the notice of redemption to the warrant holders. |
Redemption Date |
Fair Market Value of Our Common Stock |
|||||||||||||||||||||||||||||||||||
(period to expiration of warrants) |
$10.00 |
$11.00 |
$12.00 |
$13.00 |
$14.00 |
$15.00 |
$16.00 |
$17.00 |
$18.00 |
|||||||||||||||||||||||||||
60 months |
0.261 | 0.281 | 0.297 | 0.311 | 0.324 | 0.337 | 0.348 | 0.358 | 0.361 | |||||||||||||||||||||||||||
57 months |
0.257 | 0.277 | 0.294 | 0.310 | 0.324 | 0.337 | 0.348 | 0.358 | 0.361 | |||||||||||||||||||||||||||
54 months |
0.252 | 0.272 | 0.291 | 0.307 | 0.322 | 0.335 | 0.347 | 0.357 | 0.361 | |||||||||||||||||||||||||||
51 months |
0.246 | 0.268 | 0.287 | 0.304 | 0.320 | 0.333 | 0.346 | 0.357 | 0.361 | |||||||||||||||||||||||||||
48 months |
0.241 | 0.263 | 0.283 | 0.301 | 0.317 | 0.332 | 0.344 | 0.356 | 0.361 | |||||||||||||||||||||||||||
45 months |
0.235 | 0.258 | 0.279 | 0.298 | 0.315 | 0.330 | 0.343 | 0.356 | 0.361 | |||||||||||||||||||||||||||
42 months |
0.228 | 0.252 | 0.274 | 0.294 | 0.312 | 0.328 | 0.342 | 0.355 | 0.361 | |||||||||||||||||||||||||||
39 months |
0.221 | 0.246 | 0.269 | 0.290 | 0.309 | 0.325 | 0.340 | 0.354 | 0.361 | |||||||||||||||||||||||||||
36 months |
0.213 | 0.239 | 0.263 | 0.285 | 0.305 | 0.323 | 0.339 | 0.353 | 0.361 | |||||||||||||||||||||||||||
33 months |
0.205 | 0.232 | 0.257 | 0.280 | 0.301 | 0.320 | 0.337 | 0.352 | 0.361 | |||||||||||||||||||||||||||
30 months |
0.196 | 0.224 | 0.250 | 0.274 | 0.297 | 0.316 | 0.335 | 0.351 | 0.361 | |||||||||||||||||||||||||||
27 months |
0.185 | 0.214 | 0.242 | 0.268 | 0.291 | 0.313 | 0.332 | 0.350 | 0.361 | |||||||||||||||||||||||||||
24 months |
0.173 | 0.204 | 0.233 | 0.260 | 0.285 | 0.308 | 0.329 | 0.348 | 0.361 | |||||||||||||||||||||||||||
21 months |
0.161 | 0.193 | 0.223 | 0.252 | 0.279 | 0.304 | 0.326 | 0.347 | 0.361 | |||||||||||||||||||||||||||
18 months |
0.146 | 0.179 | 0.211 | 0.242 | 0.271 | 0.298 | 0.322 | 0.345 | 0.361 | |||||||||||||||||||||||||||
15 months |
0.130 | 0.164 | 0.197 | 0.230 | 0.262 | 0.291 | 0.317 | 0.342 | 0.361 | |||||||||||||||||||||||||||
12 months |
0.111 | 0.146 | 0.181 | 0.216 | 0.250 | 0.282 | 0.312 | 0.339 | 0.361 | |||||||||||||||||||||||||||
9 months |
0.090 | 0.125 | 0.162 | 0.199 | 0.237 | 0.272 | 0.305 | 0.336 | 0.361 | |||||||||||||||||||||||||||
6 months |
0.065 | 0.099 | 0.137 | 0.178 | 0.219 | 0.259 | 0.296 | 0.331 | 0.361 | |||||||||||||||||||||||||||
3 months |
0.034 | 0.065 | 0.104 | 0.150 | 0.197 | 0.243 | 0.286 | 0.326 | 0.361 | |||||||||||||||||||||||||||
0 months |
— | — | 0.042 | 0.115 | 0.179 | 0.233 | 0.281 | 0.323 | 0.361 |
• | We have elected not to be governed by Section 203 of the DGCL, which prohibits a corporation that has voting stock traded on a national security exchange from engaging in certain business combinations with an interested stockholder (defined as the owner of 15% or more of the corporation’s voting stock), or an interested stockholder’s affiliates or associates, for a three-year period unless, among other exceptions, certain board approvals are received. |
• | Our amended and restated certificate of incorporation generally prohibits us from engaging in any business combination with any interested stockholder for a period of three years following the time that such stockholder became an interested stockholder, unless: |
• | Prior to such time, the board approved the transaction that resulted in the stockholder becoming an interested stockholder; |
• | Upon consummation of the transaction that resulted in the stockholder becoming an interested stockholder, the interested stockholder owned at least 85% of the outstanding voting stock at the time the transaction commenced (excluding for purposes of determining the voting stock outstanding (but not the outstanding voting stock owned by the interested stockholder) those shares owned by (i) persons who are directors and also officers and (ii) employee stock plans in which employee participants do not have the right to determine confidentially whether shares held subject to the plan will be tendered in a tender or exchange offer); |
• | At or subsequent to such time, the business combination is approved by the board and authorized at an annual or special meeting of stockholders, and not by written consent, by the affirmative vote of at least 66 2/3% of the outstanding voting stock that is not owned by the interested stockholder; or |
• | The stockholder became an interested stockholder inadvertently and (i) as soon as practicable divested itself of ownership of sufficient shares so that the stockholder ceased to be an interested stockholder and (ii) was not, at any time within the 3-year period immediately prior to a business combination between us and such stockholder, an interested stockholder but for the inadvertent acquisition of ownership. |
• | Our bylaws establish an advance notice procedure for stockholders who wish to present a proposal before an annual meeting of stockholders. Our bylaws provide that the only business that may be conducted at an annual meeting of stockholders is business that is (i) specified in the notice of such meeting (or any supplement thereto) given by or at the direction of our board of directors, (ii) otherwise properly brought before such meeting by the our board of directors or the chairperson of the board, or (iii) otherwise properly brought before such meeting by a stockholder present in person who (A) (1) was a record owner of shares both at the time of giving the notice and at the time of such meeting, (2) is entitled to vote at such meeting, and (3) has complied with notice procedures specified in our bylaws in all applicable respects or (B) properly made such proposal in accordance with Rule 14a-8 under the Exchange Act. To be timely for our annual meeting of stockholders, a stockholders’ notice must be delivered to, or mailed and received at, the principal executive offices of the corporation not less than 90 days nor more than 120 days prior to the one-year anniversary of the preceding year’s annual meeting; provided, however, that if the date of the annual meeting is more than 30 days before or more than 60 days after such anniversary date, notice by the stockholder to be timely must be so delivered, or mailed and received, not later than the 90th day prior to such annual meeting or, if later, the 10th day following the day on which public disclosure of the date of such annual meeting was first made by the corporation. In no event shall any adjournment or postponement of an annual meeting or the announcement thereof commence a new time period (or extend any time period) for the giving of timely notice as described above. |
• | Our 2022 annual meeting of stockholders will be held on June 15, 2022. Nominations and proposals also must satisfy other requirements set forth in our bylaws. |
• | Under Rule 14a-8 of the Exchange Act, a stockholder proposal to be included in the proxy statement and proxy card for the 2022 annual general meeting pursuant to Rule 14a-8 must be received at our principal office a reasonable time before we begin to print and send its proxy materials and must comply with Rule 14a-8. |
• | incur additional indebtedness; |
• | incur liens; |
• | pay dividends and distributions on, or redeem, repurchase or retire its capital stock; |
• | create negative pledge or restrictions on the payment of dividends or payment of other amounts owed from subsidiaries; |
• | make investments, acquisitions, loans, or advances; |
• | engage in mergers, consolidations, liquidations or dissolutions; |
• | sell, transfer or otherwise dispose of assets, including capital stock of subsidiaries; |
• | engage in certain transactions with affiliates; |
• | change its lines of business; |
• | make payments of certain debt that is subordinated with respect to right of payment, junior lien debt and unsecured debt; |
• | modify certain documents governing certain debt that is subordinated with respect to right of payment, junior lien debt, or unsecured debt; and |
• | change its fiscal year. |
• | 1% of the total number of shares of our common stock then outstanding; or |
• | the average weekly reported trading volume of our common stock during the four calendar weeks preceding the filing of a notice on Form 144 with respect to the sale. |
• | the issuer of the securities that was formerly a shell company has ceased to be a shell company; |
• | the issuer of the securities is subject to the reporting requirements of Section 13 or 15(d) of the Exchange Act; |
• | the issuer of the securities has filed all Exchange Act reports and material required to be filed, as applicable, during the preceding 12 months (or such shorter period that the issuer was required to file such reports and materials), other than Form 8-K reports; and |
• | at least one year has elapsed from the time that the issuer filed current Form 10 type information with the SEC reflecting its status as an entity that is not a shell company. |
• | ordinary brokerage transactions and transactions in which the broker-dealer solicits purchasers; |
• | one or more underwritten offerings on a firm commitment or best efforts basis; |
• | block trades in which the broker-dealer will attempt to sell the shares of common stock as agent, but may position and resell a portion of the block as principal to facilitate the transaction; |
• | purchases by a broker-dealer as principal and resale by the broker-dealer for its accounts; |
• | an exchange distribution in accordance with the rules of the applicable exchange; |
• | privately negotiated transactions; |
• | distributions or transfers to their members, partners or shareholders; |
• | short sales effected after the date of the registration statement of which this prospectus is a part is declared effective by the SEC; |
• | through the writing or settlement of options or other hedging transactions, whether through an options exchange or otherwise; |
• | in market transactions, including transactions on a national securities exchange or quotations service or over-the-counter |
• | through trading plans entered into by a Selling Securityholder pursuant to Rule 10b5-1 under the Exchange Act that are in place at the time of an offering pursuant to this prospectus and any applicable prospectus supplement hereto that provide for periodic sales of their securities on the basis of parameters described in such trading plans; |
• | directly to one or more purchasers, including through a specific bidding, auction or other process or in privately negotiated transactions; |
• | in “at the market” offerings, as defined in Rule 415 under the Securities Act, at negotiated prices, at prices prevailing at the time of sale or at prices related to such prevailing market prices, including sales made directly on a national securities exchange or sales made through a market maker other than on an exchange or other similar offerings through sales agents; |
• | through agents; |
• | through broker-dealers who may agree with the Selling Securityholders to sell a specified number of such shares of common stock at a stipulated price per share; |
• | by entering into transactions with third parties who may (or may cause others to) issue securities convertible or exchangeable into, or the return of which is derived in whole or in part from the value of, our shares of common stock; and |
• | a combination of any such methods of sale or any other method permitted pursuant to applicable law. |
F-2 | ||||
F-3 | ||||
F-5 | ||||
F-6 | ||||
F-7 | ||||
F-8 | ||||
F-10 | ||||
F-41 | ||||
F-41 |
December 31, |
December 31, |
|||||||
2021 |
2020 |
|||||||
Assets |
||||||||
Current assets |
||||||||
Cash and cash equivalents |
$ |
$ |
||||||
Accounts receivable, net of allowances for credits and doubtful accounts of $ |
||||||||
Inventories, net |
||||||||
Income taxes receivable |
||||||||
Prepaid expenses and other receivables |
||||||||
Total current assets |
||||||||
Non-current assets |
||||||||
Restricted cash |
||||||||
Property and equipment, net |
||||||||
Intangibles assets, net |
||||||||
Goodwill |
||||||||
Deferred tax assets |
||||||||
Other long-term assets |
||||||||
Total assets |
$ |
$ |
||||||
Liabilities, temporary equity and stockholders’ equity |
||||||||
Current liabilities |
||||||||
Accounts payable |
$ |
$ |
||||||
Accrued liabilities |
||||||||
Income taxes payable |
||||||||
Current portion of capital lease obligations |
||||||||
Deferred revenue |
||||||||
Current portion of long-term debt and other borrowings, net |
||||||||
Total current liabilities |
||||||||
Non-current liabilities |
||||||||
Deferred tax liabilities |
||||||||
Due to related parties |
||||||||
Warrant liability |
||||||||
Capital lease obligations |
||||||||
Long-term debt and other borrowings, net |
||||||||
Other long-term liabilities |
||||||||
Total liabilities |
$ |
$ |
||||||
Commitments and contingencies (note 1 1 ) |
December 31, |
December 31, |
|||||||
2021 |
2020 |
|||||||
Temporary equity |
||||||||
Series A Preferred Stock; par value $ 2020 |
$ |
— |
$ |
|||||
Series A-1 Preferred Stock; par value $ |
— |
|||||||
Series B Preferred Stock; par value $ |
— |
|||||||
Series C Convertible Preferred Stock; par value $ 31, |
— |
|||||||
|
|
|
|
|||||
Total temporary equity |
$ |
— |
$ |
|||||
|
|
|
|
|||||
Stockholders’ equity |
||||||||
Common stock, voting; par value $ |
$ |
$ |
||||||
Additional paid-in capital |
||||||||
Accumulated other comprehensive loss |
( |
) |
( |
) | ||||
Accumulated deficit |
( |
) |
( |
) | ||||
|
|
|
|
|||||
Total stockholders’ equity |
||||||||
|
|
|
|
|||||
Total liabilities, temporary equity and stockholders’ equity |
$ |
$ |
||||||
|
|
|
|
For the years ended |
December 31, |
December 31, |
December 31, |
|||||||||
2021 |
2020 |
2019 |
||||||||||
Revenue |
||||||||||||
Services |
$ |
$ |
$ |
|||||||||
Products |
||||||||||||
|
|
|
|
|
|
|||||||
Total revenue |
||||||||||||
Cost of revenue |
||||||||||||
Cost of services |
||||||||||||
Cost of products |
||||||||||||
|
|
|
|
|
|
|||||||
Total cost of revenue (exclusive of depreciation and amortization shown separately below) |
||||||||||||
|
|
|
|
|
|
|||||||
Operating expenses |
||||||||||||
Selling, general and administrative |
||||||||||||
Depreciation and amortization |
||||||||||||
Intangible asset impairment loss |
||||||||||||
|
|
|
|
|
|
|||||||
Total operating expenses |
||||||||||||
|
|
|
|
|
|
|||||||
Operating loss |
( |
) |
( |
) |
( |
) | ||||||
Interest expense, including amortization of deferred financing costs, net |
||||||||||||
Change in fair value of warrant liability |
( |
) |
( |
) | ||||||||
|
|
|
|
|
|
|||||||
Loss before income taxes |
( |
) |
( |
) |
( |
) | ||||||
Income tax expense (benefit) |
||||||||||||
Current |
( |
) | ||||||||||
Deferred |
( |
) |
( |
) |
( |
) | ||||||
|
|
|
|
|
|
|||||||
Total income tax benefit |
( |
) |
( |
) |
( |
) | ||||||
|
|
|
|
|
|
|||||||
Net loss attributable to the Company |
$ |
( |
) |
$ |
( |
) |
$ |
( |
) | |||
|
|
|
|
|
|
|||||||
Loss per share: |
||||||||||||
Basic |
$ |
( |
) |
$ |
( |
) |
$ |
( |
) | |||
Diluted |
$ |
( |
) |
$ |
( |
) |
$ |
( |
) | |||
Weighted average shares outstanding (in Number): |
||||||||||||
Basic |
||||||||||||
Diluted |
For the years ended |
December 31, 2021 |
December 31, 2020 |
December 31, 2019 |
|||||||||
Net loss |
|
$ |
( |
) |
|
$ |
( |
) |
|
$ |
( |
) |
Other comprehensive income (loss): |
||||||||||||
Foreign currency translation adjustment |
( |
) |
||||||||||
|
|
|
|
|
|
|||||||
Comprehensive loss |
$ |
( |
) |
$ |
( |
) |
$ |
( |
) | |||
|
|
|
|
|
|
Series A Preferred Stock |
Series A-1 Preferred Stock |
Series B Preferred Stock |
Series C Convertible Preferred Stock |
Total Temporary Equity |
Common Stock |
Additional paid-in capital |
Accumulated Other Comprehensive Income (Loss) |
Accumulated Deficit |
Total Stockholders’ Equity |
|||||||||||||||||||||||||||||||||||||||||||||||||||
Temporary Equity |
||||||||||||||||||||||||||||||||||||||||||||||||||||||||||||
Shares |
Amount |
Shares |
Amount |
Shares |
Amount |
Shares |
Amount |
Amount |
Shares |
Amount |
Amount |
Amount |
Amount |
Amount |
||||||||||||||||||||||||||||||||||||||||||||||
Balance at December 31, 2018 (as previously reported) |
$ |
$ |
$ |
$ |
$ |
$ |
$ |
$ |
( |
) |
$ |
( |
) |
$ |
||||||||||||||||||||||||||||||||||||||||||||||
|
|
|
|
|
|
|
|
|
|
|
|
|
|
|
|
|
|
|
|
|
|
|
|
|
|
|
|
|
|
|||||||||||||||||||||||||||||||
Conversion of Stock |
— |
— |
— |
— |
— |
( |
) |
— |
— |
— |
||||||||||||||||||||||||||||||||||||||||||||||||||
|
|
|
|
|
|
|
|
|
|
|
|
|
|
|
|
|
|
|
|
|
|
|
|
|
|
|
|
|
|
|||||||||||||||||||||||||||||||
Balance at December 31, 2018, effect of reverse recapitalization |
$ |
$ |
$ |
$ |
$ |
$ |
$ |
$ |
( |
) |
$ |
( |
) |
$ |
||||||||||||||||||||||||||||||||||||||||||||||
|
|
|
|
|
|
|
|
|
|
|
|
|
|
|
|
|
|
|
|
|
|
|
|
|
|
|
|
|
|
|||||||||||||||||||||||||||||||
Issuance of stock |
— |
— |
— |
— |
— |
— |
— |
— |
— |
— |
— |
— |
||||||||||||||||||||||||||||||||||||||||||||||||
Repurchase and cancellation of stock |
— |
— |
— |
— |
— |
— |
— |
— |
— |
( |
) |
— |
( |
) |
— |
— |
( |
) | ||||||||||||||||||||||||||||||||||||||||||
Accrued dividends payable |
— |
— |
— |
— |
( |
) |
— |
— |
( |
) | ||||||||||||||||||||||||||||||||||||||||||||||||||
Foreign currency translation adjustment |
— |
— |
— |
— |
— |
— |
— |
— |
— |
— |
— |
— |
— |
|||||||||||||||||||||||||||||||||||||||||||||||
Share-based compensation |
— |
— |
— |
— |
— |
— |
— |
— |
— |
— |
— |
— |
— |
|||||||||||||||||||||||||||||||||||||||||||||||
Net loss |
— |
— |
— |
— |
— |
— |
— |
— |
— |
— |
— |
— |
— |
( |
) |
( |
) | |||||||||||||||||||||||||||||||||||||||||||
|
|
|
|
|
|
|
|
|
|
|
|
|
|
|
|
|
|
|
|
|
|
|
|
|
|
|
|
|
|
|||||||||||||||||||||||||||||||
Balance at December 31, 2019 |
$ |
$ |
$ |
$ |
$ |
$ |
$ |
$ |
( |
) |
$ |
( |
) |
$ |
||||||||||||||||||||||||||||||||||||||||||||||
|
|
|
|
|
|
|
|
|
|
|
|
|
|
|
|
|
|
|
|
|
|
|
|
|
|
|
|
|
|
|||||||||||||||||||||||||||||||
Repurchase and cancellation of stock |
— |
— |
— |
— |
— |
— |
— |
— |
— |
( |
) |
— |
( |
) |
— |
— |
( |
) | ||||||||||||||||||||||||||||||||||||||||||
Accrued dividends payable |
— |
— |
— |
— |
( |
) |
— |
— |
( |
) | ||||||||||||||||||||||||||||||||||||||||||||||||||
Foreign currency translation adjustment |
— |
— |
— |
— |
— |
— |
— |
— |
— |
— |
— |
— |
— |
|||||||||||||||||||||||||||||||||||||||||||||||
Share-based compensation |
— |
— |
— |
— |
— |
— |
— |
— |
— |
— |
— |
— |
— |
|||||||||||||||||||||||||||||||||||||||||||||||
Net loss |
— |
— |
— |
— |
— |
— |
— |
— |
— |
— |
— |
— |
— |
( |
) |
( |
) | |||||||||||||||||||||||||||||||||||||||||||
|
|
|
|
|
|
|
|
|
|
|
|
|
|
|
|
|
|
|
|
|
|
|
|
|
|
|
|
|
|
|||||||||||||||||||||||||||||||
Balance at December 31, 2020 |
$ |
$ |
$ |
$ |
$ |
$ |
$ |
$ |
( |
) |
$ |
( |
) |
$ |
||||||||||||||||||||||||||||||||||||||||||||||
|
|
|
|
|
|
|
|
|
|
|
|
|
|
|
|
|
|
|
|
|
|
|
|
|
|
|
|
|
|
|||||||||||||||||||||||||||||||
Derecognition of shares |
— |
— |
— |
— |
— |
— |
( |
) |
( |
) |
( |
) |
— |
— |
— |
— |
— |
— |
||||||||||||||||||||||||||||||||||||||||||
Accrued dividends payable |
— |
— |
— |
— |
( |
) |
— |
— |
( |
) | ||||||||||||||||||||||||||||||||||||||||||||||||||
Foreign currency translation adjustment |
— |
— |
— |
— |
— |
— |
— |
— |
— |
— |
— |
— |
( |
) |
— |
( |
) | |||||||||||||||||||||||||||||||||||||||||||
Share-based compensation |
— |
— |
— |
— |
— |
— |
— |
— |
— |
— |
( |
) |
— |
— |
( |
) | ||||||||||||||||||||||||||||||||||||||||||||
Distributions to and conversions of preferred stock |
( |
) |
( |
) |
( |
) |
( |
) |
( |
) |
( |
) |
( |
) |
( |
) |
( |
) |
— |
— |
||||||||||||||||||||||||||||||||||||||||
CTAC shares recapitalized, net of equity issuance costs of $ |
— |
— |
— |
— |
— |
— |
— |
— |
— |
— |
— |
|||||||||||||||||||||||||||||||||||||||||||||||||
Conversion of KORE warrants |
— |
— |
— |
— |
— |
— |
— |
— |
— |
— |
— |
— |
||||||||||||||||||||||||||||||||||||||||||||||||
Private offering and merger financing, net of equity issuance costs of $ |
— |
— |
— |
— |
— |
— |
— |
— |
— |
— |
— |
|||||||||||||||||||||||||||||||||||||||||||||||||
Equity portion of convertible debt, net of deferred financing costs of $ , net of deferred tax liability of $ |
— |
— |
— |
— |
— |
— |
— |
— |
— |
— |
— |
— |
— |
|||||||||||||||||||||||||||||||||||||||||||||||
Net loss |
— |
— |
— |
— |
— |
— |
— |
— |
— |
— |
— |
— |
— |
( |
) |
( |
) | |||||||||||||||||||||||||||||||||||||||||||
|
|
|
|
|
|
|
|
|
|
|
|
|
|
|
|
|
|
|
|
|
|
|
|
|
|
|
|
|
|
|||||||||||||||||||||||||||||||
Balance at December 31, 2021 |
$ |
$ |
$ |
$ |
$ |
$ |
$ |
$ |
( |
) |
$ |
( |
) |
$ |
||||||||||||||||||||||||||||||||||||||||||||||
|
|
|
|
|
|
|
|
|
|
|
|
|
|
|
|
|
|
|
|
|
|
|
|
|
|
|
|
|
|
For the years ended |
December 31, 2021 |
December 31, 2020 |
December 31, 2019 |
|||||||||
Cash flows from operating activities |
||||||||||||
Net loss |
$ |
( |
) |
$ |
( |
) |
$ |
( |
) | |||
Adjustments to reconcile net loss to net cash (used in) provided by operating activities |
||||||||||||
Depreciation and amortization |
||||||||||||
Intangible asset impairment loss |
— |
— |
||||||||||
Amortization of deferred financing costs |
||||||||||||
Amortization of discount on Backstop Notes |
— |
— |
||||||||||
Deferred income taxes |
( |
) |
( |
) |
( |
) | ||||||
Non-cash foreign currency loss |
||||||||||||
Share-based compensation |
||||||||||||
Provision for doubtful accounts |
||||||||||||
Change in fair value of warrant liability |
( |
) |
( |
) | ||||||||
Settlement gain on carrier commitment liability |
— |
— |
( |
) | ||||||||
Change in operating assets and liabilities, net of operating assets and liabilities acquired: |
|
|||||||||||
Accounts receivable |
( |
) |
( |
) |
||||||||
|
|
|
|
|
|
|
|
|
|
|
|
|
Inventories |
( |
) |
( |
) |
( |
) | ||||||
|
|
|
|
|
|
|
|
|
|
|
|
|
Prepaid expenses and other receivables |
( |
) |
( |
) |
||||||||
|
|
|
|
|
|
|
|
|
|
|
|
|
Accounts payable and accrued liabilities |
( |
) |
( |
) | ||||||||
|
|
|
|
|
|
|
|
|
|
|
|
|
Deferred revenue |
( |
) |
( |
) | ||||||||
|
|
|
|
|
|
|
|
|
|
|
|
|
Income taxes payable |
( |
) |
( |
) |
( |
) | ||||||
|
|
|
|
|
|
|
|
|
|
|
|
|
Change in minimum carrier commitment liability |
— |
— |
( |
) | ||||||||
|
|
|
|
|
|
|||||||
Cash (used in) provided by operating activities |
$ |
( |
) |
$ |
$ |
|||||||
|
|
|
|
|
|
|||||||
Cash flows used in investing activities |
||||||||||||
Additions to intangible assets |
( |
) |
( |
) |
( |
) | ||||||
|
|
|
|
|
|
|
|
|
|
|
|
|
Additions to property and equipment |
( |
) |
( |
) |
( |
) | ||||||
Acquisition of Integron LLC, net of cash acquired |
— |
( |
) | |||||||||
|
|
|
|
|
|
|||||||
Net cash used in investing activities |
$ |
( |
) |
$ |
( |
) |
$ |
( |
) | |||
|
|
|
|
|
|
|||||||
Cash flows from financing activities |
||||||||||||
Proceeds from revolving credit facility |
— |
|||||||||||
|
|
|
|
|
|
|
|
|
|
|
|
|
Repayment on revolving credit facility |
( |
) |
( |
) |
— |
|||||||
|
|
|
|
|
|
|
|
|
|
|
|
|
Repayment of term loan |
( |
) |
( |
) |
( |
) | ||||||
|
|
|
|
|
|
|
|
|
|
|
|
|
Repayment of other borrowings - notes payable |
( |
) |
— |
— |
||||||||
Proceeds from term loan |
— |
— |
||||||||||
|
|
|
|
|
|
|
|
|
|
|
|
|
Proceeds from convertible debt |
||||||||||||
|
|
|
|
|
|
|
|
|
|
|
|
|
Proceeds from equity portion of convertible debt, net of issuance costs |
— |
— |
||||||||||
|
|
|
|
|
|
|
|
|
|
|
|
|
Payment of deferred financing costs |
( |
) |
— |
( |
) | |||||||
|
|
|
|
|
|
|
|
|
|
|
|
|
Repayment of related party note |
( |
) |
— |
— |
||||||||
|
|
|
|
|
|
|
|
|
|
|
|
|
Repurchase of common stock |
— |
( |
) |
( |
) | |||||||
|
|
|
|
|
|
|
|
|
|
|
|
|
Proceeds from CTAC and PIPE financing, net of issuance costs |
— |
— |
||||||||||
|
|
|
|
|
|
|
|
|
|
|
|
|
Settlements of preferred shares |
( |
) |
— |
— |
||||||||
|
|
|
|
|
|
|
|
|
|
|
|
|
Payment of capital lease obligations |
( |
) |
( |
) |
( |
) | ||||||
|
|
|
|
|
|
|
|
|
|
|
|
|
Payment of stock option share employee withholding taxes |
( |
) |
— |
— |
||||||||
|
|
|
|
|
|
|||||||
Cash provided by/(used in) financing activities |
$ |
$ |
( |
) |
$ |
|||||||
|
|
|
|
|
|
|||||||
Effect of Exchange Rate Change on Cash and Cash Equivalents |
( |
) |
( |
) |
( |
) | ||||||
Change in Cash and Cash Equivalents and Restricted Cash |
||||||||||||
Cash and Cash Equivalents and Restricted Cash, beginning of period |
||||||||||||
|
|
|
|
|
|
|||||||
Cash and Cash Equivalents and Restricted Cash, end of period |
$ |
$ |
$ |
For the years ended |
2021 |
2020 |
2019 |
|||||||||
Non-cash investing and financing activities: |
||||||||||||
Equity issued for acquisition of Integron LLC |
$ |
— |
$ |
— |
$ |
|||||||
Equity financing fees accrued |
— |
— |
||||||||||
Capital leases |
||||||||||||
Common shares issued to preferred shareholders |
— |
— |
||||||||||
Equity financing fees settled in common shares |
— |
— |
||||||||||
Common shares issued to warrant holders |
— |
— |
||||||||||
Common shares issued to option holders pursuant to the Cancellation Agreements |
|
|
|
|
|
|
— |
|
|
|
— |
|
Sponsor shares distributed to lender under Backstop Agreement |
— |
— |
||||||||||
Supplemental cash flow information: |
||||||||||||
Interest paid |
$ |
$ |
$ |
|||||||||
Taxes paid (net of refunds) |
• |
the equity holders of pre-combination KORE hold the majority (54%) of voting rights in the Company; |
• |
the senior management of pre-combination KORE became the senior management of the Company; |
• |
in comparison with CTAC, pre-combination KORE has significantly more revenues and total assets and a larger net loss; and |
• |
the operations of pre-combination KORE comprise the ongoing operations of the Company, and the Company assumed pre-Combination KORE’s headquarters. |
• |
Exemption to not disclose the unfulfilled performance obligation balance for contracts with an original length of one year or less. |
• |
Practical expedient to recognize the incremental costs of obtaining a contract as an expense when incurred if the amortization period of the asset that the entity otherwise would have recognized is one year or less. |
• |
Election to present revenue net of sales taxes and other similar taxes. |
• |
Election from recognizing shipping and handling activities as a separate performance obligation. |
• |
Practical expedient not requiring the entity to adjust the promised amount of consideration for the effects of a significant financing component if the entity expects, at contract inception, that the period between when the entity transfers a promised good or service to a customer and when the customer pays for that good or service will be one year or less. |
Computer hardware and software |
% | |||
Networking equipment |
% | |||
Furniture and fixtures |
% |
Customer relationships |
||
Technology |
||
Carrier contracts |
10 years | |
Trademarks |
9 - | |
Non-compete agreements |
3 years | |
Internally developed computer software |
3 - |
Previous Filings |
After Correction |
|||||||||||||||
2021 |
2020 |
2021 |
2020 |
|||||||||||||
(unaudited) |
(unaudited) |
(unaudited) |
(unaudited) |
|||||||||||||
Three months Ended September 30, |
||||||||||||||||
Net loss attributable to common shareholders |
$ |
( |
) |
$ |
( |
) |
$ |
( |
) |
$ |
( |
) | ||||
Loss per share: |
||||||||||||||||
Basic |
$ |
( |
) |
$ |
( |
) |
$ |
( |
) |
$ |
( |
) | ||||
Diluted |
$ |
( |
) |
$ |
( |
) |
$ |
( |
) |
$ |
( |
) | ||||
Weighted-average shares outstanding: |
||||||||||||||||
Basic |
||||||||||||||||
Diluted |
Previous Filings |
After Correction |
|||||||||||||||
2021 |
2020 |
2021 |
2020 |
|||||||||||||
(unaudited) |
(unaudited) |
(unaudited) |
(unaudited) |
|||||||||||||
Nine months Ended September 30, |
||||||||||||||||
Net loss attributable to common shareholders |
$ |
( |
) |
$ |
( |
) |
$ |
( |
) |
$ |
( |
) | ||||
Net loss per share |
||||||||||||||||
Basic |
$ |
( |
) |
$ |
( |
) |
$ |
( |
) |
$ |
( |
) | ||||
Diluted |
$ |
( |
) |
$ |
( |
) |
$ |
( |
) |
$ |
( |
) | ||||
Weighted-average shares outstanding: |
||||||||||||||||
Basic |
||||||||||||||||
Diluted |
• |
Risk -free interest rate. The risk-free interest rate is based on the U.S. Treasury yield curve in effect at the time of grant for zero coupon U.S. Treasury notes with maturities approximately equal to the expected term of the stock-based awards; |
• |
Expected term. The expected term represents the period that the stock-based awards are expected to be outstanding. The Company uses the simplified calculation of expected term, which reflects the weighted-average of time-to-vesting; |
• |
Expected dividend. The expected dividend is assumed to be zero as the Company has never paid dividends and has no current plans to pay any dividends on its common stock; and |
• |
Expected volatility. The expected volatility is derived from an average of the historical volatilities of the common stock of the Company and several other entities with characteristics similar to those of the Company, such as the size and operational and economic similarities to the Company’s principal business operations. |
• |
Clarifies that all entities are required to provide the fair value option disclosures in ASC 825, Financial Instruments |
• |
Clarifies that the portfolio exception in ASC 820, Fair Value Measurement Derivatives and Hedging |
• |
Clarifies that for purposes of measuring expected credit losses on a net investment in a lease in accordance with ASC 326, Financial Instruments - Credit Losses Leases |
• |
Clarifies that when an entity regains control of financial assets sold, it should recognize an allowance for credit losses in accordance with ASC 326. |
• |
Aligns the disclosure requirements for debt securities in ASC 320, Investments - Debt Securities Financial Services - Depository and Lending |
Year ended December 31, |
||||||||||||
(in ‘000) |
2021 |
2020 |
2019 |
|||||||||
Connectivity* |
$ |
$ |
$ |
|||||||||
Hardware Sales |
||||||||||||
Hardware Sales - bill-and-hold |
||||||||||||
Deployment services, professional services, and other |
||||||||||||
Total |
$ |
$ |
$ |
* |
Includes connectivity-related revenues from IoT Connectivity and IoT Solutions |
Shares |
Percentage |
|||||||
Pre-combination KORE shareholders |
% | |||||||
Public stockholders |
% | |||||||
Private offering and merger financing |
% | |||||||
Total |
% | |||||||
(in ‘000) |
Amount |
|||
Cash paid to sellers |
$ |
|||
Common stock issued to sellers |
||||
|
|
|||
Total consideration |
$ |
|||
Cash |
||||
Accounts receivable |
||||
Inventories |
||||
Prepaid expenses and other receivables |
||||
Property and equipment |
||||
Identifiable intangible assets |
||||
Deferred tax liabilities |
( |
) | ||
Accounts payable and accrued liabilities |
( |
) | ||
|
|
|||
Net identifiable assets acquired |
||||
|
|
|||
Goodwill (excess of consideration transferred over net identifiable assets acquired) |
$ |
|||
|
|
(in ‘000) |
December 31, 2021 |
December 31, 2020 |
||||||
Computer hardware |
$ |
$ |
||||||
Computer software |
||||||||
Furniture and fixtures |
||||||||
Networking equipment |
||||||||
Leasehold improvements |
||||||||
|
|
|
|
|||||
Total property and equipment |
||||||||
Less: accumulated depreciation |
( |
) |
( |
) | ||||
|
|
|
|
|||||
Property and equipment (net) |
$ |
$ |
||||||
|
|
|
|
(in ‘000) |
Amount |
|||
December 31, 2019 |
$ |
|||
Measurement period adjustment — Integron |
( |
) | ||
Currency translation |
||||
|
|
|||
December 31, 2020 |
$ |
|||
|
|
|||
Currency translation |
( |
) | ||
|
|
|||
December 31, 2021 |
$ |
|||
|
|
(in ‘000) |
Carrying Gross Amount |
Accumulated Amortization |
Net Carrying Value |
|||||||||
Customer relationships |
$ |
$ |
( |
) |
$ |
|||||||
Technology |
( |
) |
||||||||||
Carrier contracts |
( |
) |
||||||||||
Trademarks |
( |
) |
||||||||||
Internally developed computer software |
( |
) |
||||||||||
|
|
|
|
|
|
|||||||
Total as of December 31, 2021 |
$ |
$ |
( |
) |
$ |
|||||||
|
|
|
|
|
|
(in ‘000) |
Carrying Gross Amount |
Accumulated Amortization |
Net Carrying Value |
|||||||||
Customer relationships |
$ |
$ |
( |
) |
$ |
|||||||
Technology |
( |
) |
||||||||||
Carrier contracts |
( |
) |
||||||||||
Trademarks |
( |
) |
||||||||||
Internally developed computer software |
( |
) |
||||||||||
|
|
|
|
|
|
|||||||
Total as of December 31, 2020 |
$ |
$ |
( |
) |
$ |
|||||||
|
|
|
|
|
|
Years |
||||
Customer relationships |
||||
Technology |
||||
Carrier contracts |
||||
Trademarks |
||||
Internally developed computer software |
Amount |
||||
2022 |
$ |
|||
2023 |
||||
2024 |
||||
2025 |
||||
2026 |
||||
Thereafter |
||||
|
|
|||
Total |
$ |
|||
|
|
(in ‘000) |
December 31, 2021 |
December 31, 2020 |
||||||
Accrued payroll and related |
$ |
$ |
||||||
Accrued cost of revenue |
||||||||
Accrued other expenses |
||||||||
Sales and other taxes payable |
||||||||
|
|
|
|
|||||
Total accrued liabilities |
$ |
$ |
||||||
|
|
|
|
(in ‘000) |
December 31, 2021 |
December 31, 2020 |
||||||
Term Loan – UBS |
$ |
$ |
||||||
Term Loan – BNP Paribas |
||||||||
Notes under the Backstop Agreement |
— |
|||||||
Other Borrowings |
|
|
|
|
|
|
— |
|
|
|
|
|
|||||
Total |
||||||||
Less — current portion |
||||||||
Less — equity component, net of accumulated amortization |
||||||||
Less—debt issuance cost, net of accumulated amortization of $ |
||||||||
|
|
|
|
|||||
Total notes and debentures |
||||||||
Other Borrowings—Notes payable |
||||||||
|
|
|
|
|||||
Total Long-term debt and other borrowings |
$ |
$ |
||||||
|
|
|
|
(in ‘000) |
Amount |
|||
2022 |
$ |
|||
2023 |
||||
2024 |
||||
2025 |
||||
2026 |
||||
Thereafter |
||||
|
|
|||
Total |
$ |
|||
|
|
For the Years Ended December 31, |
||||||||||||
2021 |
2020 |
2019 |
||||||||||
(in thousands) |
||||||||||||
United State s |
$ |
( |
) |
$ |
( |
) |
$ |
( |
) | |||
Foreign |
( |
) |
( |
) |
( |
) | ||||||
|
|
|
|
|
|
|||||||
Total loss before income taxes |
$ |
( |
) |
$ |
( |
) |
$ |
( |
) | |||
|
|
|
|
|
|
For the Years Ended December 31, |
||||||||||||
2021 |
2020 |
2019 |
||||||||||
Current: |
(in thousands) |
|||||||||||
Federal |
$ |
— |
$ |
$ |
( |
) | ||||||
State |
( |
) | ||||||||||
Foreign |
( |
) |
( |
) | ||||||||
|
|
|
|
|
|
|||||||
Total current provision (benefit) |
( |
) | ||||||||||
|
|
|
|
|
|
|||||||
Deferred: |
||||||||||||
Federa l |
( |
) |
( |
) |
( |
) | ||||||
State |
( |
) |
( |
) | ||||||||
Foreign |
( |
) |
( |
) |
( |
) | ||||||
|
|
|
|
|
|
|||||||
Total deferred benefit |
( |
) |
( |
) |
( |
) | ||||||
|
|
|
|
|
|
|||||||
Total benefit |
$ |
( |
) |
$ |
( |
) |
$ |
( |
) | |||
|
|
|
|
|
|
For the Years Ended December 31, |
||||||||||||||||||||||||
2021 |
2020 |
2019 |
||||||||||||||||||||||
(in thousands) |
||||||||||||||||||||||||
Benefit for income taxes at |
$ |
( |
) |
% |
$ |
( |
) |
% |
$ |
( |
) |
% | ||||||||||||
State taxes, net of federal benefit |
( |
) |
% |
( |
) |
% |
( |
) |
% | |||||||||||||||
Change in valuation allowance |
- |
% |
- |
% |
% | |||||||||||||||||||
Rate change |
- |
% |
- |
% |
% | |||||||||||||||||||
Credits |
( |
) |
% |
( |
) |
% |
( |
) |
% | |||||||||||||||
Permanent differences and other |
- |
% |
- |
% |
( |
) |
% | |||||||||||||||||
Revaluation of warrants |
( |
) |
% |
- |
% |
( |
) |
% | ||||||||||||||||
Uncertain tax positions |
% |
- |
% |
( |
) |
% | ||||||||||||||||||
Foreign withholding tax |
- |
% |
- |
% |
% | |||||||||||||||||||
Foreign rate differential |
( |
) |
% |
( |
) |
% |
( |
) |
% | |||||||||||||||
Executive compensation expens e |
- |
% |
% |
% | ||||||||||||||||||||
Transaction related expense |
( |
) |
% |
% |
% | |||||||||||||||||||
|
|
|
|
|
|
|
|
|
|
|
|
|||||||||||||
Benefit for income taxes |
$ |
( |
) |
% |
$ |
( |
) |
% |
$ |
( |
) |
% | ||||||||||||
|
|
|
|
|
|
|
|
|
|
|
|
As of December 31, |
||||||||
2021 |
2020 |
|||||||
(in thousands) |
||||||||
Deferred tax assets: |
||||||||
Net operating loss carry-forward |
$ |
$ |
||||||
Credit carry-forward |
||||||||
Interest expense limitation carry-forward |
||||||||
Non-deductible reserves |
||||||||
Accruals and other temporary differences |
||||||||
Stock compensation |
||||||||
Property and equipment |
||||||||
|
|
|
|
|||||
Gross deferred tax assets |
||||||||
Less Valuation allowance |
( |
) |
( |
) | ||||
|
|
|
|
|||||
Total deferred tax assets (after valuation allowance) |
||||||||
Deferred tax liabilities: |
||||||||
Property and equipment |
( |
) |
( |
) | ||||
Intangible assets |
( |
) |
( |
) | ||||
Goodwill |
( |
) |
( |
) | ||||
Debt discount |
( |
) |
— |
|||||
|
|
|
|
|||||
Total deferred tax liabilities |
( |
) |
( |
) | ||||
|
|
|
|
|||||
Net deferred tax liabilities |
$ |
( |
) |
$ |
( |
) | ||
|
|
|
|
For the Years Ended December 31, |
||||||||
2021 |
2020 |
|||||||
(in thousands) |
||||||||
Unrecognized tax benefits at the beginning of the year |
$ |
$ |
||||||
Additions for tax positions of current year |
— |
— |
||||||
Additions for tax positions of prior years |
||||||||
Reductions for tax positions of prior years |
— |
— |
||||||
Expirations statutes of limitation |
— |
— |
||||||
|
|
|
|
|||||
Unrecognized tax benefits at the end of the year |
$ |
$ |
(in ‘000) |
Amount |
|||
2022 |
$ |
|||
2023 |
||||
2024 |
||||
2025 |
||||
2026 |
||||
Thereafter |
||||
|
|
|||
Total |
$ |
|||
|
|
(in ‘000) |
Amount |
|||
2022 |
$ |
|||
2023 |
||||
2024 |
||||
2025 |
||||
2026 |
||||
|
|
|||
Total minimum lease payments |
$ |
|||
Interest expense |
( |
) | ||
|
|
|||
Total |
$ |
|||
|
|
(in ‘000) |
Amount |
|||
2022 |
$ |
|||
2023 |
||||
2024 |
||||
2025 |
||||
2026 |
||||
Thereafter |
||||
|
|
|||
Total |
$ |
|||
|
|
(in ‘000) |
December 31, 2021 |
December 31, 2020 |
||||||
Prepaid deposits |
$ |
$ |
||||||
Prepaid expenses |
||||||||
Other receivables |
||||||||
Total Prepaid expenses and other receivables |
$ |
$ |
||||||
Amount (in ‘000) |
Series A |
Series A-1 |
Series B |
|||||||||
Accumulated and unpaid, December 31, 2019 |
$ |
$ |
$ |
|||||||||
Accumulated |
||||||||||||
Distributed |
||||||||||||
Accumulated and unpaid, December 31, 2020 |
$ |
$ |
$ |
|||||||||
Accumulated |
||||||||||||
Distributed |
( |
) |
( |
) |
( |
) | ||||||
Accumulated and unpaid, December 31, 2021 |
$ |
$ |
$ |
|||||||||
Number of Options |
Weighted Average Grant Date Fair Value per Option (Amount) |
Weighted Average Exercise Price (Amount) |
Weighted Average Remaining Contractual Term (Years) |
|||||||||||||
Balance, December 31, 2018 |
$ |
$ |
||||||||||||||
Granted |
||||||||||||||||
Exercised |
— |
— |
— |
|||||||||||||
Forfeited |
( |
) |
||||||||||||||
Expired |
— |
— |
— |
|||||||||||||
Balance, December 31, 2019 |
$ |
|||||||||||||||
Granted |
||||||||||||||||
Exercised |
— |
— |
— |
|||||||||||||
Forfeited |
( |
) |
||||||||||||||
Expired |
— |
— |
— |
|||||||||||||
Balance, December 31, 2020 |
$ |
$ |
||||||||||||||
Granted |
— |
— |
— |
|||||||||||||
Exercised |
— |
— |
— |
|||||||||||||
Forfeited |
— |
— |
— |
|||||||||||||
Expired |
— |
— |
— |
|||||||||||||
Cancelled |
( |
) |
( |
) |
( |
) |
( |
) | ||||||||
Balance, December 31, 2021 |
$ |
$ |
— |
|||||||||||||
(in ‘000) |
December 31, 2021 |
December 31, 2020 |
||||||
Total Stock Compensation Expense |
$ |
$ |
||||||
Unrecognized Compensation Cost |
||||||||
Remaining recognition period (in years) |
— |
December 31, 2021 |
December 31, 2020 |
|||||||
Range of Exercise Prices |
$ |
|||||||
Number |
||||||||
Weighted Average Remaining Contractual Term (in years) |
— |
|||||||
Weighted Average Exercise Price |
$ |
$ |
(in ‘000) |
December 31, 2021 |
December 31, 2020 |
December 31, 2019 |
|||||||||
Numerator: |
||||||||||||
Net loss attributable to the Company |
$ |
( |
) $ |
( |
) $ |
( |
) | |||||
Less cumulative earnings to preferred |
( |
) |
( |
) |
( |
) | ||||||
Add premium on preferred conversion to common shares |
— |
— |
||||||||||
|
|
|
|
|
|
|||||||
Net income (loss) attributable to common stockholders |
( |
) |
( |
) |
( |
) | ||||||
Denominator: |
||||||||||||
Weighted average common shares and warrants outstanding |
|
|
|
|
|
|
|
|
|
|
|
|
Basic (in number) |
||||||||||||
Diluted (in number) |
||||||||||||
Net loss per unit attributable to common stockholder |
||||||||||||
Basic |
$ |
( |
) |
$ |
( |
) |
$ |
( |
) | |||
Diluted |
$ |
( |
) |
$ |
( |
) |
$ |
( |
) |
For the years ended (number of shares) |
December 31, 2021 |
December 31, 2020 |
December 31, 2019 |
|||||||||
Series C Convertible Preferred Stock |
||||||||||||
Stock Options |
||||||||||||
Common stock issued under the Backstop Agreement |
— |
— |
(in ‘000) |
December 31, 2021 |
December 31, 2020 |
||||||
Interfusion B.V. |
||||||||
T-Fone B.V. |
(in thousands) |
||||
Cash, including closing cash and working capital adjustments |
$ |
|||
Fair value of KORE common stock issued to sellers ( |
||||
|
|
|||
Total consideration |
$ |
|||
Assets acquired: |
|
|
|
|
Cash |
||||
Accounts receivable |
||||
Inventories |
||||
Prepaid expenses and other receivables |
||||
Property and equipment |
||||
Intangible assets |
||||
Total Assets acquired |
|
|
|
|
Liabilities assumed: |
|
|
|
|
Deferred tax liabilities |
||||
Accounts payable and accrued liabilities |
||||
Liabilities assumed |
|
|
|
|
|
|
|||
Net identifiable assets acquired |
||||
|
|
|||
Goodwill (excess of consideration transferred over net identifiable assets acquired) |
$ |
|||
|
|
December 31, 2021 |
December 31, 2020 |
|||||||
Assets |
||||||||
Non-current assets |
||||||||
Investment in subsidiaries |
$ |
$ |
||||||
|
|
|
|
|||||
Total non-current assets |
||||||||
|
|
|
|
|||||
Total assets |
$ |
$ |
||||||
|
|
|
|
|||||
Liabilities, temporary equity and stockholders’ equity |
||||||||
Long-term liabilities |
||||||||
Warrant liability |
$ |
$ |
||||||
|
|
|
|
|||||
Total liabilities |
||||||||
|
|
|
|
|||||
Temporary equity |
||||||||
Series A Preferred Stock; par value $ |
||||||||
|
|
|
|
|||||
Series A-1 Preferred Stock; par value $ |
||||||||
|
|
|
|
|||||
Series B Preferred Stock; par value $ |
||||||||
|
|
|
|
|||||
Series C Convertible Preferred Stock; par value $ |
||||||||
|
|
|
|
|||||
Total temporary equity |
||||||||
|
|
|
|
|||||
Stockholders’ equity |
||||||||
Common stock, voting; par value $ |
||||||||
Additional paid-in capital |
||||||||
Accumulated other comprehensive loss |
( |
) |
( |
) | ||||
Accumulated deficit |
( |
) |
( |
) | ||||
|
|
|
|
|||||
Total stockholders’ equity |
||||||||
|
|
|
|
|||||
Total liabilities, temporary equity and stockholders’ equity |
$ |
$ |
||||||
|
|
|
|
For the years ended |
December 31, 2021 |
December 31, 2020 |
December 31, 2019 |
|||||||||
Equity in net loss of unconsolidated subsidiaries |
$ |
( |
) |
$ |
( |
) |
$ |
( |
) | |||
Change in fair value of warrant liability |
( |
) |
( |
) | ||||||||
|
|
|
|
|
|
|||||||
Loss before income taxes |
( |
) |
( |
) |
( |
) | ||||||
|
|
|
|
|
|
|||||||
Net loss |
$ |
( |
) |
$ |
( |
) |
$ |
( |
) | |||
|
|
|
|
|
|
|||||||
Other comprehensive loss: |
||||||||||||
Foreign currency translation adjustment |
( |
) |
||||||||||
|
|
|
|
|
|
|||||||
Comprehensive loss |
$ |
( |
) |
$ |
( |
) |
$ |
( |
) | |||
|
|
|
|
|
|
For the years ended |
December 31, 2021 |
December 31, 2020 |
December 31, 2019 |
|||||||||
Cash flows from operating activities |
||||||||||||
Net loss |
$ |
( |
) |
$ |
( |
) |
$ |
( |
) | |||
Adjustments to reconcile net loss to net cash provided by operating activities |
— |
— |
||||||||||
Equity in net loss of unconsolidated subsidiaries |
||||||||||||
Change in fair value of warrant liability |
( |
) |
( |
) | ||||||||
|
|
|
|
|
|
|||||||
Cash provided by operating activities |
$ |
$ |
$ |
|||||||||
|
|
|
|
|
|
|||||||
Cash flows from investing activities |
||||||||||||
Distribution from subsidiary |
||||||||||||
|
|
|
|
|
|
|||||||
Cash provided by investing activities |
$ |
$ |
$ |
|||||||||
Cash flows from financing activities |
||||||||||||
Repurchase of common stock |
( |
) |
( |
) | ||||||||
Issuance of common stock, net of transaction costs |
— |
— |
||||||||||
Settlement of preferred stock |
( |
) |
— |
— |
||||||||
|
|
|
|
|
|
|||||||
Cash used in financing activities |
$ |
( |
) |
$ |
( |
) |
$ |
( |
) | |||
Effect of exchange rate change on cash and cash equivalents |
||||||||||||
|
|
|
|
|
|
|||||||
Change in cash and cash equivalents and restricted cash |
||||||||||||
Cash and cash equivalents and restricted cash, beginning of |
||||||||||||
|
|
|
|
|
|
|||||||
Cash and cash equivalents and restricted cash, end of year |
$ |
$ |
$ |
|||||||||
|
|
|
|
|
|
|||||||
Non-cash investing and financing activities: |
||||||||||||
Equity issued for acquisition of Integron, LLC |
$ |
$ |
$ |
|||||||||
|
|
|
|
|
|
|||||||
Share-based payment awards issued to employees of subsidiaries |
$ |
$ |
$ |
|||||||||
|
|
|
|
|
|
(i) |
Basis of presentation and business combination |
• |
the equity holders of pre-combination KORE hold the majority ( |
• |
the senior management of pre-combination KORE became the senior management of the Company; |
• |
in comparison with CTAC, pre-combination KORE has significantly more revenues and total assets and a larger net loss; and |
• |
the operations of pre-combination KORE comprise the ongoing operations of the Company, and the Company assumed pre-Combination KORE’s headquarters. |
(ii) |
Restricted Net Assets |
Item 13. |
Other Expenses of Issuance and Distribution. |
• | These fees are calculated based on the securities offered and the number of issuances and accordingly cannot be determined at this time. |
Securities and Exchange Commission registration fee |
13.181.94 | |||
Accounting fees and expenses |
* | |||
Legal fees and expenses |
* | |||
Financial printing and miscellaneous expenses |
* | |||
Total |
* |
Item 14. |
Indemnification of Directors and Officers. |
• | On September 30, 2021, we issued 22,500,000 shares of common stock at par value $0.0001 per share at $10.00 per share for an aggregate purchase price equal to $225,000,000, concurrently with the execution of the Merger Agreement, in relation to subscription agreements entered into by CTAC with certain investors. |
• | On September 30, 2021 we issued 4,000,000 shares of common stock to certain of KORE shareholders at $10.00 per share and an additional 600,000 shares of our common stock pursuant to terms and upon conditions set forth in the Merger Agreement. |
• | On September 30, 2021 we issued 200,000 additional shares of common stock at $10.00 per share to certain advisers as a portion of their fees in connection with the Merger Agreement. |
• | On September 30, 2021 KORE Wireless issued senior unsecured exchangeable notes due 2028 at par bearing interest at a rate of 5.50% per annum due in exchange for borrowing $95.1 million. |
• | On October 28, KORE Wireless issued an aggregate principal amount of $24.9 million of 5.50% Exchangeable Senior Notes due 2028 of which Fortress Credit Corp. agreed to purchase at our option. |
• | On February 16, 2022, we issued 4,212,246 shares of common stock having a value of $23.2 million in connection with an agreement with our wholly owned subsidiaries BMP Simon Holdings, LLC, BMP Merger Sub I, Inc. and BMP Merger Sub II, Inc. to acquire Business Mobility Partners, Inc. and SIMON IoT LLC. |
Item 16. |
Exhibits and Financial Statement Schedules. |
* |
Previously filed. |
Item 17. |
Undertakings. |
(a) | any preliminary prospectus or prospectus of the undersigned registrant relating to the offering required to be filed pursuant to Rule 424; |
(b) | any free writing prospectus relating to the offering prepared by or on behalf of the undersigned registrant or used or referred to by the undersigned registrant; |
(c) | the portion of any other free writing prospectus relating to the offering containing material information about the undersigned registrant or its securities provided by or on behalf of an undersigned registrant; and |
(d) | any other communication that is an offer in the offering made by the undersigned registrant to the purchaser. |
KORE GROUP HOLDINGS, INC. |
/s/ Romil Bahl |
Name: Romil Bahl |
Title: President, Chief Executive Officer and Director |
Signature |
Title |
Date | ||
/s/ Romil Bahl Romil Bahl |
President, Chief Executive Officer and Director | May 9, 2022 | ||
/s/ Paul Holtz Paul Holtz |
Executive Vice President and Chief Financial Officer and Treasurer | May 9, 2022 | ||
/s/ Cheemin Bo-Linn Cheemin Bo-Linn |
Director | May 9, 2022 | ||
/s/ Timothy Donahue Timothy Donahue |
Director | May 9, 2022 | ||
/s/ H. Paulett Eberhart H. Paulett Eberhart |
Director | May 9, 2022 | ||
/s/ James Geisler James Geisler |
Director | May 9, 2022 | ||
/s/ Robert P. MacInnis Robert P. MacInnis |
Director | May 9, 2022 | ||
/s/ Michael K. Palmer Michael K. Palmer |
Director | May 9, 2022 | ||
/s/ Mark Neporent Mark Neporent |
Director | May 9, 2022 | ||
/s/ Tomer Yosef-Or Tomer Yosef-Or |
Director | May 9, 2022 |