falseFY--12-310001855457GAGA7623998907611000 0001855457 2021-01-01 2021-12-31 0001855457 2020-12-31 0001855457 2021-12-31 0001855457 2019-01-01 2019-12-31 0001855457 2020-01-01 2020-12-31 0001855457 2022-03-28 0001855457 2021-06-30 0001855457 2021-09-30 0001855457 2021-09-30 2021-09-30 0001855457 2021-12-31 2021-12-31 0001855457 2018-01-01 2018-12-31 0001855457 2021-01-01 2021-09-30 0001855457 2019-12-31 0001855457 2022-02-16 0001855457 2021-07-01 2021-09-30 0001855457 2020-07-01 2020-09-30 0001855457 2020-01-01 2020-09-30 0001855457 2018-12-31 0001855457 us-gaap:SeriesCPreferredStockMember 2021-12-31 0001855457 us-gaap:SeriesBPreferredStockMember 2021-12-31 0001855457 kore:SeriesA1PreferredStockMember 2021-12-31 0001855457 us-gaap:SeriesAPreferredStockMember 2021-12-31 0001855457 kore:InterfusionBVMember kore:RelatedPartyLoansMember 2021-12-31 0001855457 kore:TFoneBVMember kore:RelatedPartyLoansMember 2021-12-31 0001855457 kore:RelatedPartyLoansMember 2021-12-31 0001855457 kore:UBSTermLoanMember us-gaap:RevolvingCreditFacilityMember 2021-12-31 0001855457 kore:BelgiumSubsidiaryMember kore:BankOverdraftFacilityMember 2021-12-31 0001855457 kore:UBSTermLoanMember 2021-12-31 0001855457 kore:BankOverdraftFacilityMember 2021-12-31 0001855457 kore:BackstopNotesMember 2021-12-31 0001855457 us-gaap:CommonStockMember 2021-12-31 0001855457 kore:SeriesAOnePreferredStockMember 2021-12-31 0001855457 kore:SeriesCConvertiblePreferredStockMember 2021-12-31 0001855457 kore:KoreWarrantsMember 2021-12-31 0001855457 kore:PublicWarrantsMember 2021-12-31 0001855457 kore:PrivatePlacementWarrantsMember 2021-12-31 0001855457 kore:PrivatePlacementWarrantsMember kore:SharePriceEqualOrExceedsTenPointZeroRupeesPerDollarMember 2021-12-31 0001855457 kore:BackstopAgreementMember 2021-12-31 0001855457 us-gaap:LeaseholdImprovementsMember 2021-12-31 0001855457 kore:NetworkingEquipmentMember 2021-12-31 0001855457 us-gaap:FurnitureAndFixturesMember 2021-12-31 0001855457 kore:ComputerSoftwareMember 2021-12-31 0001855457 kore:ComputerHardwareMember 2021-12-31 0001855457 us-gaap:ComputerSoftwareIntangibleAssetMember 2021-12-31 0001855457 us-gaap:TrademarksMember 2021-12-31 0001855457 us-gaap:CustomerContractsMember 2021-12-31 0001855457 us-gaap:TechnologyBasedIntangibleAssetsMember 2021-12-31 0001855457 us-gaap:CustomerRelationshipsMember 2021-12-31 0001855457 kore:NotesUnderTheBackstopAgreementMember 2021-12-31 0001855457 kore:TermLoanBnpParibasMember 2021-12-31 0001855457 kore:TermLoanUbsMember 2021-12-31 0001855457 kore:OtherBorrowingsMember 2021-12-31 0001855457 srt:ParentCompanyMember 2021-12-31 0001855457 us-gaap:StandbyLettersOfCreditMember 2021-12-31 0001855457 kore:FederalTaxAuthorityMember 2021-12-31 0001855457 us-gaap:StateAndLocalJurisdictionMember 2021-12-31 0001855457 kore:FederalTaxAuthorityMember kore:IndefinitelyPeriodMember 2021-12-31 0001855457 us-gaap:StateAndLocalJurisdictionMember kore:IndefinitelyPeriodMember 2021-12-31 0001855457 us-gaap:ForeignCountryMember 2021-12-31 0001855457 kore:U.s.FederalResearchAndDevelopmentTaxCreditMember 2021-12-31 0001855457 kore:ForeignResearchAndDevelopmentTaxCreditMember 2021-12-31 0001855457 srt:ParentCompanyMember us-gaap:SeriesAPreferredStockMember 2021-12-31 0001855457 srt:ParentCompanyMember kore:SeriesA1PreferredStockMember 2021-12-31 0001855457 srt:ParentCompanyMember us-gaap:SeriesBPreferredStockMember 2021-12-31 0001855457 srt:ParentCompanyMember us-gaap:SeriesCPreferredStockMember 2021-12-31 0001855457 kore:SeriesCConvertiblePreferredStockMember srt:ParentCompanyMember 2021-12-31 0001855457 us-gaap:SellingGeneralAndAdministrativeExpensesMember 2021-12-31 0001855457 us-gaap:SeriesCPreferredStockMember 2020-12-31 0001855457 us-gaap:SeriesBPreferredStockMember 2020-12-31 0001855457 kore:SeriesA1PreferredStockMember 2020-12-31 0001855457 us-gaap:SeriesAPreferredStockMember 2020-12-31 0001855457 kore:InterfusionBVMember kore:RelatedPartyLoansMember 2020-12-31 0001855457 kore:RelatedPartyLoansMember kore:TFoneBVMember 2020-12-31 0001855457 kore:RelatedPartyLoansMember 2020-12-31 0001855457 kore:UBSTermLoanMember us-gaap:RevolvingCreditFacilityMember 2020-12-31 0001855457 kore:BelgiumSubsidiaryMember kore:BankOverdraftFacilityMember 2020-12-31 0001855457 kore:UBSTermLoanMember 2020-12-31 0001855457 kore:SeriesAOnePreferredStockMember 2020-12-31 0001855457 kore:SeriesCConvertiblePreferredStockMember 2020-12-31 0001855457 kore:KoreWarrantsMember 2020-12-31 0001855457 kore:BackstopAgreementMember 2020-12-31 0001855457 us-gaap:LeaseholdImprovementsMember 2020-12-31 0001855457 kore:NetworkingEquipmentMember 2020-12-31 0001855457 us-gaap:FurnitureAndFixturesMember 2020-12-31 0001855457 kore:ComputerSoftwareMember 2020-12-31 0001855457 kore:ComputerHardwareMember 2020-12-31 0001855457 us-gaap:CustomerContractsMember 2020-12-31 0001855457 us-gaap:TechnologyBasedIntangibleAssetsMember 2020-12-31 0001855457 us-gaap:CustomerRelationshipsMember 2020-12-31 0001855457 us-gaap:TrademarksMember 2020-12-31 0001855457 us-gaap:ComputerSoftwareIntangibleAssetMember 2020-12-31 0001855457 kore:TermLoanBnpParibasMember 2020-12-31 0001855457 kore:TermLoanUbsMember 2020-12-31 0001855457 kore:StandbyLettersOfCreditAndBankGuaranteeMember 2020-12-31 0001855457 srt:ParentCompanyMember 2020-12-31 0001855457 srt:ParentCompanyMember us-gaap:SeriesAPreferredStockMember 2020-12-31 0001855457 kore:SeriesA1PreferredStockMember srt:ParentCompanyMember 2020-12-31 0001855457 us-gaap:SeriesBPreferredStockMember srt:ParentCompanyMember 2020-12-31 0001855457 us-gaap:SeriesCPreferredStockMember srt:ParentCompanyMember 2020-12-31 0001855457 kore:SeriesCConvertiblePreferredStockMember srt:ParentCompanyMember 2020-12-31 0001855457 us-gaap:SellingGeneralAndAdministrativeExpensesMember 2020-12-31 0001855457 kore:InterfusionBVAndtFonebVMember kore:RelatedPartyLoansMember 2021-01-01 2021-12-31 0001855457 kore:InterfusionBVAndtFonebVMember 2021-01-01 2021-12-31 0001855457 us-gaap:CommonStockMember 2021-01-01 2021-12-31 0001855457 us-gaap:WarrantMember 2021-01-01 2021-12-31 0001855457 us-gaap:ProductMember 2021-01-01 2021-12-31 0001855457 us-gaap:ServiceMember 2021-01-01 2021-12-31 0001855457 us-gaap:AdditionalPaidInCapitalMember 2021-01-01 2021-12-31 0001855457 us-gaap:SeriesAPreferredStockMember 2021-01-01 2021-12-31 0001855457 kore:SeriesA1PreferredStockMember 2021-01-01 2021-12-31 0001855457 us-gaap:SeriesBPreferredStockMember 2021-01-01 2021-12-31 0001855457 us-gaap:AccumulatedOtherComprehensiveIncomeMember 2021-01-01 2021-12-31 0001855457 us-gaap:CommonStockMember 2021-01-01 2021-12-31 0001855457 us-gaap:SeriesCPreferredStockMember 2021-01-01 2021-12-31 0001855457 kore:SeriesCConvertiblePreferredStockMember 2021-01-01 2021-12-31 0001855457 us-gaap:EmployeeStockOptionMember 2021-01-01 2021-12-31 0001855457 kore:ConnectivityMember 2021-01-01 2021-12-31 0001855457 kore:HardwareSalesMember 2021-01-01 2021-12-31 0001855457 kore:HardwareSalesBillAndHoldMember 2021-01-01 2021-12-31 0001855457 kore:DeploymentServicesProfessionalServicesAndOtherMember 2021-01-01 2021-12-31 0001855457 kore:MajorCustomerOneMember us-gaap:AccountsReceivableMember 2021-01-01 2021-12-31 0001855457 us-gaap:LondonInterbankOfferedRateLIBORMember kore:UBSTermLoanMember us-gaap:RevolvingCreditFacilityMember 2021-01-01 2021-12-31 0001855457 us-gaap:BaseRateMember kore:UBSTermLoanMember us-gaap:RevolvingCreditFacilityMember 2021-01-01 2021-12-31 0001855457 us-gaap:LondonInterbankOfferedRateLIBORMember kore:UBSTermLoanMember us-gaap:RevolvingCreditFacilityMember srt:MinimumMember 2021-01-01 2021-12-31 0001855457 us-gaap:BaseRateMember kore:UBSTermLoanMember us-gaap:RevolvingCreditFacilityMember srt:MinimumMember 2021-01-01 2021-12-31 0001855457 kore:UBSTermLoanMember us-gaap:RevolvingCreditFacilityMember 2021-01-01 2021-12-31 0001855457 kore:BankOverdraftFacilityMember 2021-01-01 2021-12-31 0001855457 kore:SeriesAOnePreferredStockMember 2021-01-01 2021-12-31 0001855457 kore:KoreWarrantsMember us-gaap:CommonStockMember 2021-01-01 2021-12-31 0001855457 kore:PublicWarrantsMember 2021-01-01 2021-12-31 0001855457 kore:PrivatePlacementWarrantsMember 2021-01-01 2021-12-31 0001855457 us-gaap:CommonStockMember kore:CancellationAgreementsMember 2021-01-01 2021-12-31 0001855457 us-gaap:SellingGeneralAndAdministrativeExpensesMember 2021-01-01 2021-12-31 0001855457 us-gaap:RetainedEarningsMember 2021-01-01 2021-12-31 0001855457 kore:BackstopAgreementMember 2021-01-01 2021-12-31 0001855457 kore:RacoMember 2021-01-01 2021-12-31 0001855457 srt:MaximumMember 2021-01-01 2021-12-31 0001855457 us-gaap:CustomerRelationshipsMember srt:MinimumMember 2021-01-01 2021-12-31 0001855457 us-gaap:CustomerRelationshipsMember srt:MaximumMember 2021-01-01 2021-12-31 0001855457 us-gaap:TechnologyBasedIntangibleAssetsMember srt:MinimumMember 2021-01-01 2021-12-31 0001855457 us-gaap:TechnologyBasedIntangibleAssetsMember srt:MaximumMember 2021-01-01 2021-12-31 0001855457 us-gaap:CustomerContractsMember 2021-01-01 2021-12-31 0001855457 srt:MinimumMember us-gaap:TrademarksMember 2021-01-01 2021-12-31 0001855457 us-gaap:TrademarksMember srt:MaximumMember 2021-01-01 2021-12-31 0001855457 us-gaap:NoncompeteAgreementsMember 2021-01-01 2021-12-31 0001855457 us-gaap:ComputerSoftwareIntangibleAssetMember srt:MinimumMember 2021-01-01 2021-12-31 0001855457 us-gaap:ComputerSoftwareIntangibleAssetMember srt:MaximumMember 2021-01-01 2021-12-31 0001855457 us-gaap:ComputerSoftwareIntangibleAssetMember 2021-01-01 2021-12-31 0001855457 us-gaap:TrademarksMember 2021-01-01 2021-12-31 0001855457 us-gaap:TechnologyBasedIntangibleAssetsMember 2021-01-01 2021-12-31 0001855457 us-gaap:CustomerRelationshipsMember 2021-01-01 2021-12-31 0001855457 srt:MinimumMember 2021-01-01 2021-12-31 0001855457 kore:GlobalIntangibleLowtaxedIncomeMember 2021-01-01 2021-12-31 0001855457 srt:ParentCompanyMember 2021-01-01 2021-12-31 0001855457 kore:HardwareAndSoftwareMember 2021-01-01 2021-12-31 0001855457 kore:ComputerSoftwareMember 2021-01-01 2021-12-31 0001855457 us-gaap:FurnitureAndFixturesMember 2021-01-01 2021-12-31 0001855457 srt:RestatementAdjustmentMember kore:KoreWarrantsMember 2021-01-01 2021-12-31 0001855457 us-gaap:ProductMember 2020-01-01 2020-12-31 0001855457 us-gaap:ServiceMember 2020-01-01 2020-12-31 0001855457 us-gaap:AdditionalPaidInCapitalMember 2020-01-01 2020-12-31 0001855457 us-gaap:CommonStockMember 2020-01-01 2020-12-31 0001855457 us-gaap:SeriesBPreferredStockMember 2020-01-01 2020-12-31 0001855457 kore:SeriesA1PreferredStockMember 2020-01-01 2020-12-31 0001855457 us-gaap:SeriesAPreferredStockMember 2020-01-01 2020-12-31 0001855457 us-gaap:AccumulatedOtherComprehensiveIncomeMember 2020-01-01 2020-12-31 0001855457 kore:SeriesCConvertiblePreferredStockMember 2020-01-01 2020-12-31 0001855457 us-gaap:EmployeeStockOptionMember 2020-01-01 2020-12-31 0001855457 kore:ConnectivityMember 2020-01-01 2020-12-31 0001855457 kore:HardwareSalesMember 2020-01-01 2020-12-31 0001855457 kore:HardwareSalesBillAndHoldMember 2020-01-01 2020-12-31 0001855457 kore:DeploymentServicesProfessionalServicesAndOtherMember 2020-01-01 2020-12-31 0001855457 kore:MajorCustomerOneMember us-gaap:AccountsReceivableMember 2020-01-01 2020-12-31 0001855457 kore:SeriesAOnePreferredStockMember 2020-01-01 2020-12-31 0001855457 us-gaap:RetainedEarningsMember 2020-01-01 2020-12-31 0001855457 kore:RacoMember 2020-01-01 2020-12-31 0001855457 kore:GlobalIntangibleLowtaxedIncomeMember 2020-01-01 2020-12-31 0001855457 srt:ParentCompanyMember 2020-01-01 2020-12-31 0001855457 us-gaap:SellingGeneralAndAdministrativeExpensesMember 2020-01-01 2020-12-31 0001855457 us-gaap:CommonStockMember 2019-01-01 2019-12-31 0001855457 us-gaap:AdditionalPaidInCapitalMember 2019-01-01 2019-12-31 0001855457 kore:SeriesA1PreferredStockMember 2019-01-01 2019-12-31 0001855457 us-gaap:SeriesAPreferredStockMember 2019-01-01 2019-12-31 0001855457 us-gaap:SeriesCPreferredStockMember 2019-01-01 2019-12-31 0001855457 us-gaap:SeriesBPreferredStockMember 2019-01-01 2019-12-31 0001855457 us-gaap:ProductMember 2019-01-01 2019-12-31 0001855457 us-gaap:ServiceMember 2019-01-01 2019-12-31 0001855457 us-gaap:AccumulatedOtherComprehensiveIncomeMember 2019-01-01 2019-12-31 0001855457 kore:SeriesCConvertiblePreferredStockMember 2019-01-01 2019-12-31 0001855457 us-gaap:EmployeeStockOptionMember 2019-01-01 2019-12-31 0001855457 kore:ConnectivityMember 2019-01-01 2019-12-31 0001855457 kore:HardwareSalesMember 2019-01-01 2019-12-31 0001855457 kore:HardwareSalesBillAndHoldMember 2019-01-01 2019-12-31 0001855457 kore:DeploymentServicesProfessionalServicesAndOtherMember 2019-01-01 2019-12-31 0001855457 us-gaap:RetainedEarningsMember 2019-01-01 2019-12-31 0001855457 kore:RacoMember 2019-01-01 2019-12-31 0001855457 kore:RacoWirelessLlcMember us-gaap:ComputerSoftwareIntangibleAssetMember 2019-01-01 2019-12-31 0001855457 kore:IntegronLlcMember 2019-01-01 2019-12-31 0001855457 srt:ParentCompanyMember 2019-01-01 2019-12-31 0001855457 us-gaap:SellingGeneralAndAdministrativeExpensesMember 2019-01-01 2019-12-31 0001855457 kore:MergerAgreementMember kore:SponsorMember kore:CerberusTelecomAcquisitionCorpMember 2021-09-30 0001855457 kore:PIPEInvestorsMember kore:CerberusTelecomAcquisitionCorpMember 2021-09-30 0001855457 kore:CerberusTelecomAcquisitionCorpMember 2021-09-30 0001855457 kore:BackstopAgreementMember kore:SeniorUnsecuredExchangeableNotesDue2028Member 2021-09-30 0001855457 kore:BackstopAgreementMember 2021-09-30 0001855457 kore:BackstopNotesMember 2021-09-30 0001855457 us-gaap:BaseRateMember kore:BackstopAgreementMember 2021-09-30 0001855457 us-gaap:CommonClassAMember kore:KoreGroupHoldingsInc.Member 2021-09-30 0001855457 us-gaap:CommonClassAMember kore:PublicStockholdersMember 2021-09-30 0001855457 us-gaap:CommonClassAMember kore:PrivateOfferingAndMergerFinancingMember 2021-09-30 0001855457 us-gaap:CommonClassAMember 2021-09-30 0001855457 srt:ScenarioPreviouslyReportedMember 2021-01-01 2021-09-30 0001855457 kore:BackstopAgreementMember 2021-01-01 2021-09-30 0001855457 kore:IntegronLlcMember 2019-11-22 0001855457 kore:UbsBankMember 2019-11-22 0001855457 srt:MinimumMember 2019-11-22 0001855457 kore:IntegronLlcMember 2019-11-22 2019-11-22 0001855457 kore:IntegronLlcMember srt:MaximumMember 2019-11-22 2019-11-22 0001855457 srt:MinimumMember kore:IntegronLlcMember 2019-11-22 2019-11-22 0001855457 kore:UBSTermLoanMember 2018-12-21 0001855457 kore:UBSTermLoanMember us-gaap:RevolvingCreditFacilityMember 2018-12-21 0001855457 kore:UBSTermLoanMember 2019-11-12 2019-11-12 0001855457 kore:UBSTermLoanMember 2019-11-12 0001855457 us-gaap:SellingGeneralAndAdministrativeExpensesMember 2019-12-31 0001855457 us-gaap:LondonInterbankOfferedRateLIBORMember kore:UBSTermLoanMember 2018-12-21 2018-12-21 0001855457 kore:UBSTermLoanMember 2018-12-21 2018-12-21 0001855457 kore:TermLoanBnpParibasMember 2021-01-31 0001855457 kore:TermLoanBnpParibasMember 2021-01-01 2021-01-31 0001855457 kore:BelgiumSubsidiaryMember kore:BankOverdraftFacilityMember 2018-10-08 0001855457 us-gaap:SubsequentEventMember kore:ServiceConditionMember us-gaap:RestrictedStockUnitsRSUMember 2022-01-04 2022-01-04 0001855457 us-gaap:SubsequentEventMember kore:ServiceAndPerformanceConditionsMember us-gaap:RestrictedStockUnitsRSUMember 2022-01-04 2022-01-04 0001855457 kore:PerformanceConditionsMember us-gaap:SubsequentEventMember us-gaap:RestrictedStockUnitsRSUMember 2022-01-04 2022-01-04 0001855457 us-gaap:SubsequentEventMember 2022-02-16 2022-02-16 0001855457 us-gaap:SubsequentEventMember kore:IntegronLlcMember 2022-02-16 2022-02-16 0001855457 kore:AcquiredCompaniesMember us-gaap:SubsequentEventMember 2022-02-16 0001855457 us-gaap:SubsequentEventMember 2022-02-16 0001855457 srt:ScenarioPreviouslyReportedMember 2021-07-01 2021-09-30 0001855457 srt:ScenarioPreviouslyReportedMember 2020-07-01 2020-09-30 0001855457 srt:ScenarioPreviouslyReportedMember 2020-01-01 2020-09-30 0001855457 kore:SponsorMember 2021-10-28 2021-10-28 0001855457 kore:BackstopAgreementMember 2021-10-28 2021-10-28 0001855457 kore:BackstopAgreementMember kore:SeniorUnsecuredExchangeableNotesDue2028Member 2021-10-28 0001855457 us-gaap:BaseRateMember kore:BackstopAgreementMember 2021-10-28 0001855457 kore:BackstopAgreementMember 2021-10-28 0001855457 kore:BackstopAgreementMember kore:NotesUnderTheBackstopAgreementMember 2021-10-28 0001855457 kore:InterfusionBVAndtFonebVMember 2021-09-30 2021-09-30 0001855457 kore:CerberusTelecomAcquisitionCorpMember 2021-09-30 2021-09-30 0001855457 kore:PIPEInvestorsMember kore:CerberusTelecomAcquisitionCorpMember 2021-09-30 2021-09-30 0001855457 us-gaap:CommonStockMember 2021-12-31 2021-12-31 0001855457 kore:BackstopAgreementMember 2021-12-31 2021-12-31 0001855457 kore:UBSTermLoanMember 2021-12-31 2021-12-31 0001855457 us-gaap:SubsequentEventMember 2022-01-01 2022-01-01 0001855457 us-gaap:RetainedEarningsMember 2021-12-31 0001855457 us-gaap:AccumulatedOtherComprehensiveIncomeMember 2021-12-31 0001855457 us-gaap:AdditionalPaidInCapitalMember 2021-12-31 0001855457 us-gaap:SeriesAPreferredStockMember 2019-12-31 0001855457 kore:SeriesAOnePreferredStockMember 2019-12-31 0001855457 us-gaap:SeriesBPreferredStockMember 2019-12-31 0001855457 us-gaap:RetainedEarningsMember 2020-12-31 0001855457 us-gaap:AccumulatedOtherComprehensiveIncomeMember 2020-12-31 0001855457 us-gaap:AdditionalPaidInCapitalMember 2020-12-31 0001855457 us-gaap:CommonStockMember 2020-12-31 0001855457 srt:ParentCompanyMember 2019-12-31 0001855457 srt:ScenarioPreviouslyReportedMember 2018-12-31 0001855457 us-gaap:CommonStockMember kore:ReverseCapitalizationMember 2018-12-31 0001855457 us-gaap:AdditionalPaidInCapitalMember kore:ReverseCapitalizationMember 2018-12-31 0001855457 srt:ScenarioPreviouslyReportedMember us-gaap:CommonStockMember 2018-12-31 0001855457 srt:ScenarioPreviouslyReportedMember us-gaap:AdditionalPaidInCapitalMember 2018-12-31 0001855457 srt:ScenarioPreviouslyReportedMember us-gaap:AccumulatedOtherComprehensiveIncomeMember 2018-12-31 0001855457 srt:ScenarioPreviouslyReportedMember us-gaap:RetainedEarningsMember 2018-12-31 0001855457 us-gaap:AccumulatedOtherComprehensiveIncomeMember kore:ReverseCapitalizationMember 2018-12-31 0001855457 us-gaap:RetainedEarningsMember kore:ReverseCapitalizationMember 2018-12-31 0001855457 kore:ReverseCapitalizationMember 2018-12-31 0001855457 us-gaap:SeriesCPreferredStockMember srt:ScenarioPreviouslyReportedMember 2018-12-31 0001855457 us-gaap:SeriesBPreferredStockMember srt:ScenarioPreviouslyReportedMember 2018-12-31 0001855457 kore:SeriesA1PreferredStockMember srt:ScenarioPreviouslyReportedMember 2018-12-31 0001855457 srt:ScenarioPreviouslyReportedMember us-gaap:SeriesAPreferredStockMember 2018-12-31 0001855457 kore:ReverseCapitalizationMember us-gaap:SeriesCPreferredStockMember 2018-12-31 0001855457 us-gaap:SeriesBPreferredStockMember kore:ReverseCapitalizationMember 2018-12-31 0001855457 kore:ReverseCapitalizationMember kore:SeriesA1PreferredStockMember 2018-12-31 0001855457 kore:ReverseCapitalizationMember us-gaap:SeriesAPreferredStockMember 2018-12-31 0001855457 us-gaap:SeriesCPreferredStockMember 2019-12-31 0001855457 kore:SeriesA1PreferredStockMember 2019-12-31 0001855457 us-gaap:CommonStockMember 2019-12-31 0001855457 us-gaap:AdditionalPaidInCapitalMember 2019-12-31 0001855457 us-gaap:AccumulatedOtherComprehensiveIncomeMember 2019-12-31 0001855457 us-gaap:RetainedEarningsMember 2019-12-31 0001855457 srt:ParentCompanyMember 2018-12-31 iso4217:USD xbrli:shares xbrli:pure iso4217:EUR utr:Year utr:Month utr:Day iso4217:USD xbrli:shares
Table of Contents
 
 
UNITED STATES
SECURITIES AND EXCHANGE COMMISSION
Washington, D.C. 20549
 
 
FORM
10-K
 
 
(Mark One)
ANNUAL REPORT PURSUANT TO SECTION 13 OR 15(d) OF THE SECURITIES EXCHANGE ACT OF 1934
For the fiscal year ended December 31, 2021
OR
 
TRANSITION REPORT PURSUANT TO SECTION 13 OR 15(d) OF THE SECURITIES EXCHANGE ACT OF 1934
Commission file number
001-40856


KORE Group Holdings, Inc.
(Exact name of registrant as specified in its charter)


Delaware
 
86-3078783
(State incorporation)
 
(I.R.S. Employer Identification No.)
   
3700 Mansell Road, Suite 300
Alpharetta, GA
 
30022
(Adress of principal executive office)
 
(Zip code)
877-710-5673
Registrant’s telephone number, including area code
 
 
Securities registered pursuant to Section 12(b) of the Act:
 
Title of each class
 
Trading
Symbol(s)
 
Name of each exchange
on which registered
Common stock, $0.0001 par value per share
 
KORE
 
The New York Stock Exchange
Warrants to purchase common stock
 
KORE WS
 
The New York Stock Exchange
Securities registered pursuant to section 12(g) of the Act: None.
 
 
Indicate by check mark if the registrant is a well-known seasoned issuer, as defined in Rule 405 of the Securities Act.    Yes  ☐    No  ☒
Indicate by check mark if the registrant is not required to file reports pursuant to Section 13 or Section 15(d) of the Act.    Yes  ☐    No  ☒
Indicate by check mark whether the registrant: (1) has filed all reports required to be filed by Section 13 or 15(d) of the Securities Exchange Act of 1934 during the preceding 12 months (or for such shorter period that the registrant was required to file such reports); and (2) has been subject to such filing requirements for the past 90 days.    Yes  ☒    No  ☐
Indicate by check mark whether the registrant has submitted electronically every Interactive Data File required to be submitted pursuant to Rule 405 of Regulation S-T (§232.405 of this chapter) during the preceding 12 months (or for such shorter period that the registrant was required to submit such files).    Yes  ☒    No  ☐
Indicate by check mark whether the registrant is a large accelerated filer, an accelerated filer, a non-accelerated filer, a smaller reporting company or an emerging growth company. See the definitions of “large accelerated filer,” “accelerated filer,” “smaller reporting company” and “emerging growth company” in Rule 12b-2 of the Exchange Act.
 
Large accelerated filer
 
  
Accelerated filer


Non-accelerated filer
 
  
Smaller reporting company


Emerging growth company
 
If an emerging growth company, indicate by check mark if the registrant has elected not to use the extended transition period for complying with any new or revised financial accounting standards provided pursuant to Section 13(a) of the Exchange Act.  
Indicate by check mark whether the registrant has filed a report on and attestation to its management’s assessment of the effectiveness of its internal control over financial reporting under Section 404(b) of the Sarbanes-Oxley Act (15 U.S.C. 7262(b)) by the registered public accounting firm that prepared or issued its audit report.  
Indicate by check mark whether the registrant is a shell company (as defined in Rule 12b-2 of the Act).    Yes  ☐    No  
The registrant was not a public company as of the last business day of its most recently completed second fiscal quarter and, therefore, cannot calculate the aggregate market value of its voting and non-voting common equity held by non-affiliates as of such date. As of March 28, 2022, there were 76,239,989 shares of the registrant’s common stock, par value $0.0001 per share, outstanding.


Table of Contents
TABLE OF CONTENTS


Page


6


6


17


36


36


36


36


37


37


38


38


54


55


100


100


10
2


10
2


10
3


10
3


10
3


10
3


10
3


10
3


10
4


10
4


10
5


i

Table of Contents
BASIS OF PRESENTATION
As used in this Annual Report on Form
10-K,
unless as the context requires otherwise, as used herein, references to “KORE,” the “Company,” “we,” “us,” and “our,” and similar references refer collectively to KORE Group Holdings, Inc. and its consolidated subsidiaries.
Unless the context otherwise requires, references in this Annual Report on Form
10-K
to:


“Backstop Agreement” are to that certain backstop agreement dated July 27, 2021 between KORE Wireless Group, Inc., a wholly owned subsidiary of KORE, and Drawbridge Special Opportunities Fund LP, an affiliate of Fortress Credit Corp., in connection with the Backstop Financing, as amended November 15, 2021;


“Backstop Financing” are to the backstop financing to be provided by an affiliate of Fortress Credit Corp. pursuant to the Backstop Agreement and the Commitment Letter;


“Backstop Notes” are to the senior unsecured convertible notes in an aggregate principal amount of $120,000,000 issued by KORE Wireless Group, Inc. pursuant to the Backstop Financing and the Commitment Letter;


“Business Combination” are to the Pubco Merger, First Merger and Second Merger;


“CaaS” are to
Connectivity-as-a-Service;


“CEaaS” are to Connectivity
Enablement-as-a-Service;


“Closing” are to the consummation of the Transactions;


“Code” are to the Internal Revenue Code of 1986, as amended;


“Commitment Letter” are to that certain commitment letter dated as of September 21, 2021, and countersigned on October 1, 2021, by and among an affiliate of Fortress Credit Corp., KORE, Corp Merger Sub and LLC Merger Sub;


“Commitment Letter Financing” are to the financing under the Commitment Letter;


“Corp Merger Sub” are to King Corp Merger Sub, Inc.;


“COVID-19”
are to
SARS-CoV-2
or
COVID-19,
any evolution or variations existing as of or following the date of the Merger Agreement, or any epidemics, pandemics or disease outbreaks;


“DGCL” are to the Delaware General Corporation Law, as amended;


“eSIM” or embedded subscriber identity module, is a form of programmable SIM. It provides the capability to store multiple network profiles that can be provisioned and managed
over-the-air;


“eUICC” or embedded universal integrated circuit card is a form of programmable SIM card, often referred to as eSIM. It provides the capability to store multiple network profiles that can be provisioned and managed
over-the-air;


“Exchange Act” are to the Securities Exchange Act of 1934, as amended;


“GAAP” are to generally accepted accounting principles in the United States;


“GNSS Receiver” are to a global navigation satellite system receiver which is integral to an electronic device that receives and digitally processes the signals from a navigation satellite constellation in order to allow the functioning of GPS systems and other location based devices;


“Incentive Plan” are to the KORE 2021 Incentive Award Plan;


“IoT” are to Internet of Things;


“KORE Common Stock” are to the shares of common stock of KORE, par value $0.0001 per share;


“KORE Wireless” are to KORE Wireless Group Inc., a Delaware corporation and wholly owned and principal operating subsidiary of KORE;


“LLC Merger Sub” are to King LLC Merger Sub, LLC;


“LTE” Long-Term Evolution is a standard for wireless broadband communication for mobile devices and data terminals, based on the GSM/EDGE and UMTS/HSPA standards;
 
1

Table of Contents
 
 
“Merger Agreement” are to that certain Agreement and Plan of Merger, dated as of March 12, 2021, as amended on July 27, 2021 and September 21, 2021, by and among CTAC, KORE, Corp Merger Sub, LLC Merger Sub and Maple Holdings Inc.;


“Mergers” are to the First Merger and Second Merger, collectively;


“NYSE” is to the New York Stock Exchange;


“mPERS” are to mobile Personal Emergency Response System;


“PIPE” are to Private Investment in Public Equity;


“PIPE Investment” are to the private placement pursuant to which CTAC entered into subscription agreements (containing commitments to funding that are subject only to conditions that generally align with the conditions set forth in the Merger Agreement) with certain investors whereby such investors agreed to purchase an aggregate of 22,500,000 shares of KORE Common Stock at a purchase price of $10.00 per share for an aggregate commitment of $225,000,000;


“PIPE Investors” are to the investors participating in the PIPE Investment;


“SaaS” are to
software-as-a-service;


“SEC” are to the United States Securities and Exchange Commission;


“Shareholder Representative” are to ABRY Partners VII, L.P., or such other person or entity who is identified as the replacement Shareholder Representative by the then existing Shareholder Representative giving prior written notice to KORE;


“Sponsor” are to Cerberus Telecom Acquisition Holdings, LLC, a Delaware limited liability company;


“Subscription Agreements” are to the subscription agreements entered into by and between CTAC and the PIPE Investors, in each case, dated as of March 12, 2021 in connection with the PIPE Investment;


“Transactions” are to, collectively, the Business Combination and the other transactions contemplated by the Merger Agreement and the other related transaction agreements;


“Treasury Regulations” are to the regulations promulgated under the Code; and


“Warrant Agreement” are to a certain warrant agreement entered into by and between CTAC and Continental Stock Transfer & Trust Company, dated as of October 26, 2020.
 
2

Table of Contents
FORWARD-LOOKING STATEMENTS
This Annual Report on Form
10-K
contains forward-looking statements within the meaning of the Private Securities Litigation Reform Act of 1995. These statements express our opinions, expectations, beliefs, plans, objectives, assumptions, forecasts or projections regarding future events or future results and therefore are, or may be deemed to be, “forward-looking statements.” These forward-looking statements can generally be identified by the use of forward-looking terminology, including the terms “believes,” “estimates,” “anticipates,” “expects,” “seeks,” “projects,” “intends,” “plans,” “may,” “will” or “should” or, in each case, their negative or other variations or comparable terminology, but the absence of these words does not mean that a statement is not forward-looking. These forward-looking statements include all matters that are not historical facts.
The forward-looking statements in this Annual Report on Form
10-K
are only current expectations and predictions. We have based these forward-looking statements largely on our current expectations and projections about future events and financial trends that we believe may affect our business, financial condition and results of operations. Forward-looking statements involve known and unknown risks, uncertainties and other important factors that may cause our actual results, performance or achievements to be materially different from any future results, performance or achievements expressed or implied by the forward-looking statements, including, but not limited to, the important factors discussed in Part II, Item 1A, “Risk Factors” in this Annual Report on Form
10-K.
The forward-looking statements in this Annual Report on Form
10-K
are based upon information available to us as of the date of this Annual Report on Form
10-K,
and while we believe such information forms a reasonable basis for such statements, such information may be limited or incomplete, and our statements should not be read to indicate that we have conducted an exhaustive inquiry into, or review of, all potentially available relevant information. These statements are inherently uncertain and investors are cautioned not to unduly rely upon these statements.
You should read this Annual Report on Form
10-K
and the documents that we reference in this Annual Report on Form
10-K
and have filed as exhibits to this Annual Report on Form
10-K
with the understanding that our actual future results, levels of activity, performance and achievements may be materially different from what we expect. We qualify all of our forward-looking statements by these cautionary statements. These forward-looking statements speak only as of the date of this Annual Report on Form
10-K.
Except as required by applicable law, we do not plan to publicly update or revise any forward-looking statements contained in this Annual Report on Form
10-K.
Forward-looking statements may include, for example, statements about:


our ability to develop and introduce new products and services successfully;


our ability to compete in the market in which we operate;


our ability to meet the price and performance standards of the evolving 5G New Radio products and technologies;


our ability to expand our customer reach/reduce customer concentration;


our ability to grow the IoT and mobile portfolio outside of North America;


our ability to make scheduled payments on or to refinance our indebtedness;


our ability to introduce and sell new products that comply with current and evolving industry standards and government regulations;


our ability to develop and maintain strategic relationships to expand into new markets;


our ability to properly manage the growth of our business to avoid significant strains on our management and operations and disruptions to our business;


our reliance on third parties to manufacture components of our solutions;


our ability to accurately forecast customer demand and timely delivery of sufficient product quantities;


our reliance on sole source suppliers for some products, services and devices used in our solutions;


the continuing impact of uncertain global economic conditions on the demand for our products;


the impact of geopolitical instability on our business;


the emergence of global public health emergencies, such as the outbreak of the 2019 novel coronavirus, now known as
“COVID-19,”
which could extend lead times in our supply chain and lengthen sales cycles with our customers;
 
3

Table of Contents
 
 
direct and indirect effects of
COVID-19
on our employees, customers and supply chain and the economy and financial markets;


the impact that new or adjusted tariffs may have on the costs of components or our products, and our ability to sell products internationally;


our ability to be cost competitive while meeting
time-to-market
requirements for our customers;


our ability to meet the product performance needs of our customers in wireless broadband data access markets;


demand for
software-as-a-service
telematics solutions;


our dependence on wireless telecommunication operators delivering acceptable wireless services;


the outcome of any pending or future litigation, including intellectual property litigation;


infringement claims with respect to intellectual property contained in our solutions;


our continued ability to license necessary third-party technology for the development and sale of our solutions;


the introduction of new products that could contain errors or defects;


conducting business abroad, including foreign currency risks;


the pace of 5G wireless network rollouts globally and their adoption by customers;


our ability to make focused investments in research and development;


our ability to identify suitable acquisition candidates or to successfully integrate and realize the benefits of our past or future strategic acquisitions or investments, including our acquisitions of Business Mobility Partners Inc. and SIMON IoT LLC;


our ability to hire, retain and manage additional qualified personnel to maintain and expand our business;


the potential liquidity and trading of public securities; and


the ability to raise financing in the future.
 
4

Table of Contents
SUMMARY RISK FACTORS
Our business is subject to numerous risks and uncertainties, including those highlighted in the section entitled “Risk Factors” immediately following this summary, that represent challenges that we face in connection with the successful implementation of our strategy and the growth of our business. In particular, the following considerations, among others, may offset our competitive strengths or have a negative effect on our business strategy, which could cause a decline in the price of shares of our common stock or warrants and result in a loss of all or a portion of your investment:


The 5G market may take longer to materialize than KORE expects or, if it does materialize rapidly, KORE may not be able to meet the development schedule and other customer demands.


KORE’s development and investments in new technologies, may not generate operating income or contribute to future results of operations that meet its expectations.


If KORE is unable to support customers with low latency and/or high throughput IoT use cases, its revenue growth and profitability will be harmed.


If KORE is unable to effectively manage its increasingly diverse and complex businesses and operations, its ability to generate growth and revenue from new or existing customers may be adversely affected.


The loss of KORE’s largest customers, particularly its single largest customer, could significantly impact its revenue and profitability.


KORE’s products are highly technical and may contain undetected errors, product defects, security vulnerabilities, or software errors.


If there are interruptions or performance problems associated with the network infrastructure used to provide KORE’s services, customers may experience service outages, which may impact KORE’s reputation and future sales.


KORE’s inability to adapt to rapid technological change in its markets could impair its ability to remain competitive and adversely affect its results of operations.


The market for the products and services that KORE offers is rapidly evolving and highly competitive. KORE may be unable to compete effectively.


If KORE is unable to protect its intellectual property and proprietary rights, its competitive position and its business could be harmed.


Failure to maintain the security of KORE’s information and technology networks, including information relating to its customers and employees, could adversely affect KORE.


KORE’s internal and customer-facing systems, and systems of third parties they rely upon, may be subject to cybersecurity breaches, disruptions, or delays.


KORE is subject to evolving privacy laws that are subject to potentially differing interpretations in the United States as well as other jurisdictions that can adversely impact its business and require that it incur substantial costs.


KORE’s technology contains third-party open-source software components and failure to comply with the terms of the underlying open-source software licenses could restrict KORE’s ability to provide its platform.


KORE faces risks inherent in conducting business internationally, including compliance with international as well as U.S. laws and regulations that apply to its international operations.


KORE may be subject to legal proceedings and litigation, including intellectual property and privacy disputes, which are costly to defend and could materially harm its business, financial condition and results of operations.


KORE may be affected by fluctuations in currency exchange rates.


KORE’s management has identified internal control deficiencies that have resulted in material weaknesses in its internal control over financial reporting.


KORE’s future capital needs are uncertain, and KORE may need to raise additional funds in the future, but may not be able to raise such additional funds on acceptable terms or at all.


KORE has a history of losses and may not be able to achieve or sustain profitability in the future.
 
5

Table of Contents
PART I.
 
ITEM 1.
BUSINESS
Overview
KORE offers IoT services and solutions. KORE is one of the largest global independent IoT enablers, delivering critical services to customers globally to deploy, manage and scale their IoT application and use cases. KORE provides advanced connectivity services, location-based services, device solutions, managed and professional services used in the development and support of IoT solutions and applications. KORE’s IoT platform is delivered in partnership with the world’s largest mobile network operators and provides secure, reliable wireless connectivity to mobile and fixed devices. This technology enables KORE to expand its global technology platform by transferring capabilities across the new and existing vertical markets and to deliver complimentary products to channel partners and resellers worldwide. KORE began operations in 2003. A predecessor entity, KORE, Maple Holdings Inc., was incorporated under the laws of the State of Delaware on July 29, 2014. After the Closing, Maple Holdings Inc. ceased to exist as a separate legal entity.
KORE has operating subsidiaries located in Australia, Belgium, Brazil, Canada, the Dominican Republic, Ireland, Malta, Mexico, the Netherlands, New Zealand, Singapore, Switzerland, the United Kingdom and the United States.
KORE believes it is one of the largest global enablers of IoT, providing Connectivity and IoT Solutions to enterprise customers across five key industry verticals, comprised of (i) Connected Health, (ii) Fleet Management, (iii) Asset Monitoring, (iv) Communications Services and (v) Industrial IoT (or “
IIoT
”).
KORE has built a business at scale with revenue, net loss and adjusted EBITDA as shown in the table below:


December 31,


2021
 
  
2020
 
  
2019
 
Revenue
  
$
248,217
 
  
$
213,760
 
  
$
169,152
 
Net loss
  
 
(24,453
  
 
(35,201
  
 
(23,443
Adjusted EBITDA
  
 
59,754


57,819


50,885
 
Already a large market, KORE believes that IoT shows the promise and potential to be a significant technological revolution. IoT adoptions often result in significant productivity increases while creating entirely new business models in many cases, and the Company believes that IoT has the ability to have a significant impact worldwide. KORE enables this IoT adoption and is at the center of this revolution.
Diverse, Blue-chip Customer Base
KORE enables mission-critical IoT applications for enterprise and solution provider customers across approximately 14.6 million and 11.8 million devices as of December 31, 2021 and 2020, respectively. KORE provided connectivity to over 3,600 customers for each of the years ended December 31, 2021 and 2020. Examples of how our customers use KORE’s products and services across KORE’s five key verticals are illustrated below:


Connected Health: Remote patient monitoring and telemedicine enabled by connected medical devices, IoT device enabled clinical drug trials, mPERS connected emergency devices, connected medical equipment diagnostics, electronic visit verification.


Fleet Management: Stolen vehicle recovery location tracking, connected cameras for tracking vehicle driving conditions and driver behavior, connected route optimization, fuel consumption optimization, connected preventive maintenance, usage-based insurance, connected cars.


Asset Monitoring: Home/business security sensor and camera solutions, offender tracking through ankle bracelets, tank monitoring, supply chain inventory and asset tracking, fuel pipeline flow monitoring.


Communication Services: IoT and consumer service providers, carrier IoT business units, enterprise connectivity / failsafe, private networking—KORE may provide CEaaS for some of these customers.


Industrial IoT: Smart utilities / meters, smart cities / buildings, smart factories, field service automation, manufacturers of smart or connected products.
Across the above-mentioned use cases and others, IoT is already a large and fast-growing industry comprised of IoT hardware, software, connectivity and services.
 
6

Table of Contents
KORE enables mission-critical applications for over 3,600 customers comprising over 14 million devices. KORE is a leader in enabling
end-to-end
IoT solutions for enterprises across high growth end markets including Connected Health, Industrial IoT, Fleet Management and Remote Asset Monitoring. KORE serves an expansive group of some of the largest blue-chip enterprises with low customer concentration (approximately 300 customers comprising approximately 89% and 87% of our revenue for the years ended December 31, 2021 and 2020, respectively).
KORE’s customers operate in a wide variety of sectors, including healthcare, fleet and vehicle management, asset management, communication services and industrial/manufacturing. KORE’s largest customer, comprising approximately 21% and 16% of KORE’s revenue for the years ended December 31, 2021 and 2020, respectively, is a large multinational medical device and health care company.
KORE has a B2B (business to business) model where any given customer may have hundreds, or thousands of devices deployed in the field. The structure of KORE’s relationships with its connectivity customers is “sticky,” meaning that any exit by a connectivity customer from KORE’s platform generally will take place over an extended period of time. Additionally, it may not be clear to KORE that a customer is exiting.
The difficulty in determining if a customer is moving away from KORE is compounded by the fact that the number of Total Connections that KORE has with any particular customer can increase or decrease over time depending on a variety of factors, including pricing, customer satisfaction and fit with a particular customer product. In some cases, customers may choose to allocate a portion of their business to other service providers alongside KORE. This allocation can change from period to period. As a result, a decline in Total Connections by a customer is not necessarily an indicator that the customer has decided to move away from KORE. Customers often keep their volume allocation decisions confidential in order to prevent KORE from making commercial adjustments (such as price increases).
Key Partners
KORE’s strong customer and partner relationships provide it with the opportunity to expand its market reach and sales. KORE partners with leading cellular providers to enable its CaaS business. KORE’s IoT ecosystem partners include enterprise-level IoT software providers as application platform partners, top of the line commercial hardware manufacturers as hardware OEM partners, well-known electronics solutions providers as semi-conductor and module OEM partners, globally recognized cloud platforms as cloud providers as well as multinational system integrators as systems integration services partners. These partnerships allow KORE to provide IoT Solutions to its customers.
Market Opportunity
Key highlights of KORE’s market and business opportunity include:
Large and Growing IoT Market
. The IoT market is rapidly expanding and KORE aims to capitalize on this momentum. The addressable IoT market is anticipated by industry analysts to grow from $382 billion with 12 billion IoT devices in 2020 to $906 billion with 25 billion IoT devices by 2025. The addressable IoT market is projected by industry analysts to be $7 trillion by 2030 with 75 billion IoT devices and an accelerated growth of 50.5% CAGR. In addition to the proliferation of IoT endpoints, the adoption of 5G connectivity and enterprise digital transformation are major drivers for the growth of the IoT market.
 
7

Table of Contents
Full stack product suite
. The KORE mission is clear, to simplify the complexities of IoT and help clients deploy, manage, and scale their mission critical IoT Solutions. KORE has built a platform that allows it to be a trusted advisor to its clients in serving them in three areas CaaS, IoT Managed Services/Solutions, and Analytics, which KORE refers to as “CSA,” or connectivity, solutions, and analytics. KORE offers a
one-stop
shop for enterprise customers seeking to obtain multiple IoT services and solutions from a single provider. KORE’s product scope is as described below:
 
Product line
  
Products
  
Product description
  
Primary pricing method
IoT Connectivity
68% and 74% of full
year 2021 and 2020
revenue, respectively
  
 
IoT Connectivity as a Service (CaaS)
  
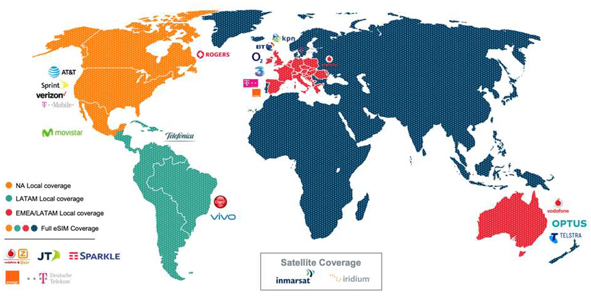
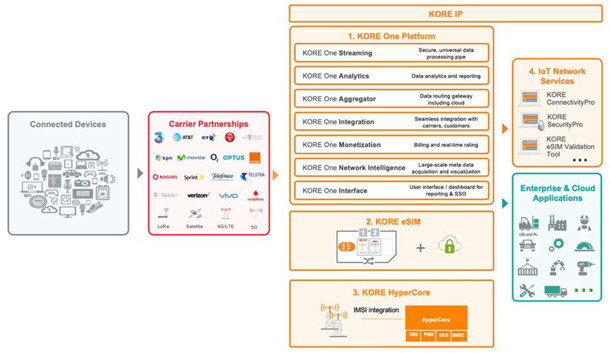
•  IoT Connectivity services offered through our market leading IoT platform ‘KORE One’
 
•  Our connectivity solutions allow devices to seamlessly and securely connect anywhere in the world across any connected network, which we call our multiple devices, multiple locations, multiple carriers CaaS multi-value proposition
 
•  IoT Connectivity Management Platform as a Service (or individual KORE One engine)
 
•  Cellular Core Network as a Service (Cloud Native Evolved Packet Core “EPC”)
  
Per subscriber per month for lifetime of device
(7-10
years and growing)
Multi-year contracts with automatic renewals
  
 
IoT Connectivity
Enablement
as a Service
(CEaaS)
IoT Solutions
32% and 26% of full
year 2021 and 2020 revenue, respectively
  
IoT Device
Management
Services
  
•  Outsourced platform-enabled services (e.g., logistics, configuration, device management)
 
Sourcing of third-party devices globally, device design and selection services
  
Upfront fee per device or per device per month
  
IoT Security
Location
Based
Services
(LBS)
  
•  KORE’s SecurityPro
®
SaaS platform
 
•  KORE’s PositionLogic
®
SaaS platform and LBS APIs
  
Per subscriber per month
IoT Connectivity
KORE’s heritage is in delivering IoT Connectivity services, particularly cellular connectivity, which is needed in a large number of IoT use cases. Managing cellular connectivity for IoT devices is complex. Companies deploying IoT devices often do so in multiple countries and sometimes across multiple continents. Even within an individual country, it is often the case that no single carrier offers 100% network coverage or coverage across all cellular technologies. Among other
 
8

Table of Contents
IoT deployment complexities, this lack of a single carrier across territories often necessitates negotiating, establishing and maintaining a large number of cellular carrier contracts. On a
day-to-day
level this requires potentially accessing a large number of cellular carrier portals in order to provision,
de-provision,
maintain, change rate plans for, change states for, and perform other transactions for SIMs deployed in IoT devices. A company deploying IoT would also expect to get multiple cellular carrier bills every month, and to work with multiple customer support organizations when something goes wrong. This complexity is very hard to manage at scale, especially since it is only a part of the complexity of the overall IoT deployment. KORE’s connectivity services simplify this complexity and provide a single connectivity relationship managed through a single source with our KORE One platform which is purpose built for IoT. On the
back-end,
KORE leverages 44 carrier integrations with its cellular carrier partners.
KORE IoT Connectivity Services Coverage
KORE also believes that eSIMs and eUICC technology have significant potential for IoT providers and for KORE in particular. eSIM and eUICC technology are new standards for remote SIM provisioning defined by the Global System for Mobile Communications Association (“GSMA”), the organization that supports and defines cellular standards. The transition from the current standard, where a SIM is “locked in” to a specific cellular carrier, to an “unlocked” eSIM model with eUICC technology that allows a company deploying IoT to switch cellular carriers at the push of a button, “over the air,” without the need to physically change SIM cards, will allow a provider in KORE’s position to offer a single eSIM that works across multiple cellular carriers. This evolution will provide KORE clients the ability to easily switch cellular carriers, without the need for expensive and labor-intensive physical SIM replacements.
Within IoT Connectivity services, KORE offers CaaS and CEaaS.
CaaS is cellular connectivity via KORE’s IoT platform ‘KORE One’
and it is offered to enterprise customers such as large medical device manufacturers, or to IoT software and solutions providers such as fleet tracking companies who may bundle connectivity with their own software and solutions. Fees for CaaS services generally consist of a monthly subscription fee for each connection, and additional data usage fees. Connectivity services also include charges for each SIM sold to a customer and other miscellaneous charges.
CEaaS is provided to communication service providers (such as MVNOs, and telecom carriers), device OEMs or other providers who wish to provide IoT cellular services to the market. The infrastructure software and services offered to such providers are cellular Core Network as a Service (including Cloud Native Evolved Packet Core “EPC”), or “CNaaS”), Connectivity Management Platform as a Service (“CMPaaS”) and Private Networking as a Service (“PNaaS”). Fees for CEaaS generally consist of a monthly subscription fee and other miscellaneous charges.
IoT Connectivity services represent 68% and 74% of KORE’s revenue for the years ended December 31, 2021 and 2020, respectively.
 
9

Table of Contents
IoT Solutions and Analytics
Successful deployment of IoT is extremely complex. Some of the significant challenges in IoT deployment include:
Top challenges in IoT deployments
To simplify IoT deployment complexity, KORE offers a comprehensive portfolio of IoT Solutions capabilities, including:


IoT Device Management Services: outsourced platform enabled services (logistics, configuration, device management). Among other logistics services, KORE offers access to a global supply chain and a global supply base at competitive prices which may include custom device design and manufacture;


Location Based Services: KORE’s SaaS cloud-based APIs (Position Logic
®
) platform for location and asset tracking; and


IoT Security (SecurityPro
®
): KORE’s SaaS platform for deep-network behavior-mining IoT device security.
KORE is experienced in providing industry-specific solutions and increasingly with
pre-configured
industry solutions with a focus in areas such as regulatory and medical device compliance. It offers a
one-stop
shop for its customers with the capability to deliver large-scale solutions for enterprise customers.
Fees charged for device management services include the cost of the underlying IoT device and the cost of deploying and managing such devices and are usually charged on a fee per deployed IoT device basis, with the ultimate amount of such fee depending on the scope of the underlying services and the IoT device being deployed. Location-based software services and IoT security software services are charged on a per subscriber basis.
IoT Solutions represented approximately 32% and 26% of KORE’s revenue for years ended December 31, 2021 and 2020, respectively.
Partner Ecosystem
KORE is a differentiated player providing comprehensive IoT Solutions—CaaS, Solutions & Analytics through its robust partner ecosystem. This partner ecosystem offers KORE the unique ability to act as a
“one-stop-shop”
specializing in solutions across the full IoT stack that are secure, cost-efficient and enable our customers a rapid time to market. The Company partners with mobile carriers around the world as well as application platforms, hardware OEMs, semiconductor and module OEMs, cloud infrastructure providers and systems integrators.
Participation in 5G Adoption


Massive TAM and Disruptive
End-Market
Use Cases. KORE believes that 5G adoption will result in an addressable market of $13.2 trillion globally by 2035. Market growth is expected to be driven by key segments including smart manufacturing, mobile, smart city, intelligent retail, construction and mining, connected healthcare, and precision agriculture.
 
10

Table of Contents
 
KORE Touchpoints. KORE expects to be the leading enabler of 5G adoption across 5G IoT, 5G broadband, and 5G ultra reliable segments because it:


Provides 5G connectivity and simplified management with
5G-ready
eSIM and eUICC technology and multi-value proposition enabled by the proprietary KORE One platform.


Enables seamless transition to 5G with its strength in carrier relationships and experience in managing network transitions.


Accelerates 5G use cases with
pre-configured
solutions and an industry-specific IoT Managed Services portfolios.


Enables edge deployments with a roadmap for a fully virtualized multi-carrier gateway on the Edge (KORE Anywhere).


Enables private network deployments with a fully virtualized core network (Cloud Native Evolved Packet Core “EPC”).


Leveraging eSIMs coupled with eUICC Technology. eSIMs coupled with eUICC technologies are next-generation technologies driving rapid adoption of Enterprise IoT Connectivity. According to Ericsson, there is a massive growth of new
IoT-connected
devices expected to come online, with approximately 25 billion devices by 2025. One of the bigger challenges to achieving this growth is current SIM card technology. Today, the vast majority of cellular connected devices are using SIM cards which are locked into a specific cellular carrier. eSIMs and eUICC technology offers several benefits over traditional SIM card technology, including:


Enables devices to store multiple operator profiles on a device simultaneously and switch between them remotely.


Allows remote updates.


Permits remote SIM provisioning of any mobile device.


Delivers an effective way to significantly increase data security.


Offers protection from evolving network technologies, such as the retirement of legacy services like 2G and 3G. In some cases, eSIM technology plays a critical role providing secure
out-of-the
box connectivity to support IoT. It enables KORE’s customers to maintain a flexible approach towards carrier and network management. Moreover, eSIM technology future-proofs devices in the field against changes in network technology. The Company offers advanced connectivity solutions through its proprietary eSIM offering and believes that it will be a key vector for eSIM volume growth. The Company shipped approximately one million eSIMs in 2021 and expects to continue successfully implementing the eSIM technology into customer IoT deployments.
KORE’s Competition and Differentiators
KORE believes that it is one of the few providers in the current market that can provide IoT enablement services, delivering CaaS, IoT Solutions and Analytics in a comprehensive manner. However, the individual markets for KORE’s products and solutions are rapidly evolving and are highly competitive. These markets are likely to continue to be affected by new product introductions and industry participants. Below are some of KORE’s key competitors across various segments of its business:


For IoT Connectivity services: telecom carriers such as
T-Mobile
and Vodafone; Mobile Virtual Network Operators such as Aeris, Wireless Logic; and Twilio, Inc.


For IoT Solutions and Analytics: device management services providers such as Velocitor Solutions and Futura Mobility, fleet management SaaS providers such as Fleetmatics and GPS Trackit, and analytics services providers such as Galooli and Intellisite.
KORE competes in the IoT Connectivity services market on the basis of the number of carrier integrations (44), its KORE One platform (7 engines), ConnectivityPro service and related APIs, the eSIM technology stack/proprietary IP, Cloud Native Evolved Packet Core “EPC”. KORE competes in the IoT Solutions market on the basis of its deep industry
 
11

Table of Contents
vertical knowledge and experience (
e.g.
, in Connected Health through the U.S. Food and Drug Administration (“FDA”) Facilities Registration, ISO 9001/13485 certification and HIPAA compliance), its breadth of solutions and analytics services and 3,300+ connectivity-only customers that provide cross-selling opportunities of additional IoT managed services.
Sales, Marketing and Growth Strategy
The five pillars of KORE’s growth strategy are as follows:


Significant organic volume growth from existing customer base: Leveraging strong IoT industry momentum with the average customer growing at double digit growth rates, maintaining high customer retention, and leveraging eSIMs to gain wallet share and market share.


Cross-sell and upsell KORE’s growing portfolio of IoT Solutions to our large base of IoT Connectivity services only customers: 23 of KORE’s top 30 customers are IoT Connectivity services-only customers and do not yet buy the IoT Solutions that KORE has developed over the past two years.


Deepening our presence in focused industry sectors: Leverage KORE’s presence in Connected Health and Fleet Management, deepening its presence in other verticals in the next 12 to 18 months, and deploying
pre-configured
industry solutions.


Enhance “AIoT” (Artificial Intelligence + IoT) and Edge Analytics capabilities in target industries.


Drive growth through strategic, accretive acquisitions, which add key capabilities.
Intellectual Property
Our service offerings are supported by KORE’s proprietary intellectual property that provides a meaningful differentiation in the marketplace:


KORE’s IoT Connectivity Services:


CaaS
is supported by KORE One
TM
, ConnectivityPro
®
, KORE eSIM, and Cloud Native Evolved Packet Core “EPC”


CEaaS
is supported by Cloud Native Evolved Packet Core “EPC” and ConnectivityPro
®
 
12

Table of Contents
 
 
KORE’s IoT Solutions and Analytics are supported by KORE’s proprietary intellectual property and technologies which work together as illustrated below:
 
Key areas of KORE’s intellectual property as illustrated above are:
 
 
1.
KORE One
Platform
The KORE One Platform was built using a microservices-based proprietary architecture and consists of seven (7) key engines.
 
 
2.
KORE eSIM
KORE has developed its eSIM which helps in providing global connectivity using a single eSIM which can be remotely updated with a preferred carrier profile over the air, or OTA. The key pieces of intellectual property in this portfolio include KORE’s eSIM profile, eSIM Validation Tool, and its APIs.
 
 
3.
Cloud Native Evolved Packet Core “EPC” (Cellular Network as a Service)
Any cellular network is comprised of a Radio Access Network (“RAN”), fiber optic backhaul and a “core network”, the functions of which constitute the “brains” of this network (including switching, authentication etc.). Cloud Native Evolved Packet Core “EPC” provides KORE as well as some of its customers a cellular “core network” (built on top of a RAN and backhaul from a cellular carrier). KORE’s intellectual property consists of both a traditional and a cloud-native core network component.
 
 
4.
IoT Network and Application Services
 
 
a.
ConnectivityPro
®
: IoT Connectivity Management Platform that provides an array of global IoT Connectivity services such as provisioning connectivity, provisioning users, rating and charging, distribution management, eSIM orchestration, diagnostics and support.
 
 
b.
SecurityPro
®
: IoT security service that enables deep network traffic monitoring for IoT connections. It helps mitigate the risk of data breaches and provides packet-level visibility into IoT communications. With SecurityPro, customers can setup rules on groups of devices and not only detect anomalies in traffic based on these rules but also take appropriate action upon detection.
 
13

Table of Contents
 
c.
PositionLogic
TM
:
Location based services (“LBS”) platform for position mapping, global fleet tracking, intelligent routing and integrated telematics services such as
in-vehicle
video, cargo monitoring, safety & security etc.
Apart from the intellectual property listed above, KORE maintains one active patent, several trademarks and ownership of domain and website names, all of which we consider our intellectual property.
KORE manages its research and development efforts through a structured life-cycle process covering identification of customer requirements, preparing a product roadmap, ongoing agile development, and commercial introduction to eventual
phase-out.
During product development, emphasis is placed on quality, reliability, performance,
time-to-market,
meeting industry standards and customer-product specifications, ease of integration, cost reduction, and maintainability.
Employees and Human Capital
Our success depends on our ability to attract, hire, retain and develop highly skilled professionals in a variety of specialties, including finance, technology, compliance, business development, cybersecurity and management.
Workforce
As of December 31, 2021, KORE had 614 full-time employees.
Talent Management and Culture
Due to the complexity of our business, we compete for talent with other companies, both inside and outside of our industry, and in multiple geographical areas in the United States, Canada, United Kingdom and the Netherlands. In 2021, our human capital efforts focused on further developing our high-performance culture to attract, develop and retain talent by enhancing our performance-management and succession planning efforts, additional talent management programs, recruitment focus to attract underrepresented workforce areas, encourage greater autonomy through thought leadership and innovation and improve quantity and quality of employee communications, so that we can better serve our customers and be recognized as a great place to work. To that end, we seek employees who share our commitment to our core values: Innovation, One Team, Trust and Integrity, Excellence, Results Focused, Supportive and Collaborative.
Compensation and Benefits
To maintain a high-caliber, values-driven workforce that is committed to our culture, we strive to offer total rewards, including compensation, benefits and recognition programs that position our company as an employer of choice. Our compensation is designed to be performance based and competitive in the markets in which we compete. We closely monitor industry trends and practices to ensure we are able to attract and retain the personnel who are critical to our success. We also monitor internal pay equity to help ensure that our compensation practices are fair and equitable across our organization. Our company’s senior leaders have an opportunity to receive a portion of their compensation in Company equity, and, subject to a cap, we match the contributions of all of our employees to our retirement savings plan to help support their long-term financial goals.
To help our employees feel supported, we offer an array of benefits intended to meet the diverse needs of our employees and their eligible dependents. From healthcare to holidays, our aim is to help our employees enjoy happy and healthy lifestyles, while maintaining good work-life balance. Our benefits, which are overseen by our Total Rewards team, are available to all full-time employees and part-time employees working at least 30 hours per week. Our health and welfare benefits include, among other things: medical coverage; dental and vision coverage; healthcare and dependent-care flexible spending accounts, Health Savings Accounts, an Employee Assistance Program, including counseling and work/life services for employees and their families; accident and critical illness coverage; life and accidental death and dismemberment insurance, as well as short-term and long-term disability insurance.
Training and Development
We believe in our employees’ potential and provide training and development opportunities intended to maximize their performance and professional growth. To ensure that new employees integrate into our culture and their daily work, we provide a robust
new-hire
experience, as well as extensive ongoing training for our employees to acquaint them with our business. We require all our employees to complete courses in key regulatory areas, and we offer opportunities for professional development through training sessions and cross-departmental workshops. In addition, we have a mentorship program that pairs newer employees with more experienced professionals, giving mentees access to experience, expertise and guidance as they chart their career paths.
 
14

Table of Contents
Employee Safety
We aim to provide a safe, inclusive environment for our employees where they feel engaged in our business, supported in who they are and empowered to succeed. We are committed to providing a workplace that is free from violence, harassment and other unsafe or disruptive conditions and require our personnel to attend regular training sessions and workshops on those topics.
To promote safety during the
COVID-19
pandemic, starting in March 2020, we expanded our work-from-home policy that enables our employees to work remotely. For our essential workers, we introduced additional hospital-grade disinfectants.
Diversity, Equity and Inclusion
We believe that well-being is more than just physical safety and that our employees should feel welcome and supported as who they are. We seek to foster diversity and a culture of inclusivity. In addition, our professional development and recruitment efforts have focused on improving the diversity of our employee population, including through targeted outreach to and collaborations with organizations that serve diverse populations. We also offer two scholarships per annum to students at Georgia Tech University for underrepresented workforce candidates, in particular women studying technology and engineering.
Continuous improvement is a pillar of our culture, and we regularly solicit employee feedback on the effectiveness and quality of our support programs and their level of engagement with our business. We use this feedback to improve our programs and processes and inform decisions about our business. In addition, we closely monitor employee turnover, both in the aggregate and in key subcategories such as diversity and levels in the Company, to evaluate our effectiveness in retaining critical personnel.
We are committed to an inclusive work environment to encourage and cultivate diversity of thought and ideas within the Company to leverage the individual talents, perspectives and experiences of our employees to position us for continued growth and success.
Deployment Operations, Training and Customer Support
IoT deployments are extremely complex. KORE’s mission is to simplify the complexities of IoT and help clients deploy, manage and scale their mission-critical IoT Solutions.
In the CaaS business, KORE deploys connectivity solutions using local SIMs, eSIMs and in certain cases core network platforms for customers to manage their connectivity base. We ship custom configured SIMs/eSIMs from our Rochester, New York and Woerden, the Netherlands facilities. We deliver our core network services with our staff based out of the Netherlands and the United Kingdom.
KORE’s IoT Solutions include IoT device management services, IoT location-based services software, and IoT device security services software for the
Machine-to-Machine
market. KORE’s IoT Solutions ensure that customer operations, whether built on asset trackers, telematics equipment, routers, gateways, tablets or smartphones have devices and equipment fully assembled and configured when they reach eventual users.
KORE offers IoT device management services for deployment and sustainment of devices, including sourcing, configuration, mobile data management, and device lifecycle management. Configuration services include software configuration, SIM card installation, firmware updates, mobile data management, accessory integration, and custom component packaging.
KORE has key IoT Solutions configuration centers located in Rochester, New York, and Ulestraten, the Netherlands which act as bases of operations before products and devices are sent to customers for final installation before use.
In addition, KORE also has the ability to bring partners required for site assessments in evaluating deployment locations prior to installation in order to validate and remediate RF signal strength, network performance, and other key metrics.
We train our customers using our customer success group which helps onboard the customers on our platform, conduct periodic refresher training, educate customers about KORE products and also conduct additional training sessions. KORE offers ongoing customer support through a number of functions, including customer success teams that help train and support the customers at the start of their engagement with KORE, call center for triage support (to resolve issues quickly and easily by troubleshooting malfunctioning endpoints), technical support, network operations center to monitor network and notify customers, and support for returns management of IoT devices. Our customer support teams are spread across the world.
 
15

Table of Contents
Facilities
KORE’s corporate headquarters are located in Alpharetta, Georgia (part of the Atlanta Metropolitan Area) and consists of approximately 18,350 square feet of office space. KORE has a key IoT Solutions configuration center located in Rochester, NY. Our Rochester facility is
ISO-9001/13485
certified, holds an FDA Facilities Registration, and is HIPAA compliant. KORE believes that its existing properties are in good condition and are sufficient and suitable for the conduct of its business for the foreseeable future. To the extent its needs change as its business grows, KORE expects that additional space and facilities will be available.
Legal Proceedings
From time to time, KORE may be involved in litigation relating to claims arising out of its operations in the ordinary course of business. There are no material legal proceedings, other than routine litigation incidental to the business, to which KORE or any of its subsidiaries are a party or of which any of KORE or its subsidiaries property is subject as of the filing date of this annual report.
Government Regulations and Compliance
KORE is required to comply with increasingly complex and changing federal, state and international laws, regulations and industry standards regarding privacy, data protection and data security, including those related to the collection, storage, use, transmission and security of personally identifiable information, health information and individual credit data, for various business purposes, including medical reasons and promotional and marketing purposes. Such privacy and data protection laws and regulations, including the Health Insurance Portability and Accountability Act (“
HIPAA
”), as well as industry standards, in each case relating to the collection, use, retention, security and transfer of personally identifiable information, health information and individual credit data. Several jurisdictions have passed laws in this area, and other jurisdictions are considering imposing additional restrictions. These laws continue to develop and may be inconsistent from jurisdiction to jurisdiction. Any entities covered by HIPAA (including entities such as KORE which track health-related data) are required by the HIPAA Privacy Rule to protect and prevent the unauthorized disclosure of patient health information known as protected health information. HIPAA also requires that covered entities comply with the HIPAA Security Rule which requires, among other things that, all covered entities (i) ensure the confidentiality, integrity and availability of all electronic protected health information; (ii) detect and safeguard against anticipated threats to the security of the information; (iii) protect against anticipated impermissible uses or disclosures; and (iv) certify compliance by their workforce.
Available Information
We file electronically with the SEC our annual reports on Form
10-K,
quarterly reports on Form
10-Q,
current reports on Form
8-K,
proxy statements and other information. Our SEC filings are available to the public over the Internet at the SEC’s website at http://www.sec.gov. We make available on our website at www.korewireless.com, free of charge, copies of these reports and any amendments as soon as reasonably practicable after filing or furnishing them with the SEC. We announce material information to the public about us, our products and services and other matters through a variety of means, including our website, the investor relations section of our website, press releases, filings with the SEC, and public conference calls, in order to achieve broad distribution of information to the public. We encourage investors and others to review the information we make public in these locations, as such information could be deemed to be material information.
 
16

Table of Contents
ITEM 1A.
RISK FACTORS
In the course of conducting our business operations, we are exposed to a variety of risks. Any of the risk factors we describe below have affected or could materially adversely affect our business, financial condition and results of operations. The market price of our securities could decline, possibly significantly or permanently, if one or more of these risks and uncertainties occurs. Certain statements in “Risk Factors” are forward-looking statements. See “Cautionary Note Regarding Forward-Looking Statements.”
Risks Related to Our Products and Technology
The 5G market may take longer to materialize than we expect or, if it does materialize rapidly, we may not be able to meet the development schedule and other customer demands.
Growth of the 5G market and its emerging standards, including the newly defined 5G NR standard, is accelerating and we believe that we are at the forefront of this newly emerging standard. However, this market may take longer to materialize than we expect which could delay important commercial milestones. Even if the market does materialize at the rapid pace that we are expecting, we may have difficulties meeting aggressive timing expectations of our current customers and getting our target products to market on time to meet the demands of our target customers. We may have difficulties meeting the market and technical specifications and timelines. It is also possible that offerings developed by others will render our offerings and initiatives noncompetitive or obsolete. Additionally, our target customers have no guarantee that the configurations of their respective target products will be successful or that they can reach the appropriate target client base to provide a positive return on the research and development investments we are making in the 5G market. We are pursuing 5G opportunities in the United States and abroad. 5G markets outside of the United States will develop at different rates and we will encounter these challenges to varying degrees in different countries. Failure to manage challenges related to 5G markets and opportunities could adversely affect our business, financial condition and results of operations.
Our growth depends in part on our ability to extend our technologies and products into new and expanded areas, including 5G. Our development and investments in these new technologies, may not generate operating income or contribute to future results of operations that meet our expectations.
We continue to invest significant resources toward advancements primarily in support of
4G-
and
5G-based
technologies. We also invest in new and expanded product areas by utilizing our existing technical and business expertise and through acquisitions or other strategic transactions. Our future growth depends on our ability to develop leading and cost-effective technologies and products for these new and expanded areas and developing technologies. In particular, our growth depends significantly on our ability to develop and commercialize products using 5G technologies. In January 2022, several major U.S. wireless carriers had to temporarily delay deployment of new wireless facilities that were meant to facilitate the evolution of their wireless networks to 5G technology in response to concerns of the aviation industry that those 5G facilities could interfere with equipment used for aviation and could impede aviation safety. Although the FCC, FAA, the wireless telecommunications industry and the aviation industry are working on solutions to alleviate those concerns, the timing for resolution is unclear, and such uncertainty could further impact the amount of and timing of 5G network investment. To the extent 5G rollout is further delayed due to interference with existing technologies, or adoption of 5G is slowed as a result of such concerns, we may incur significant costs and asset impairments, which could adversely affect our business, financial condition, and results of operations.
If we are unable to support customers with low latency and/or high throughput IoT use cases, our revenue growth and profitability will be harmed
As wireless networks have evolved to support higher speeds, IoT devices have included more advanced capabilities such as video, real-time event logging, edge compute services (where computing is completed on or near the site of the sensor) and voice controls. As a result, customers have developed IoT applications that consume more network resources and require much lower network latency. In order to support these new customers and the increasing number of 5G use cases, we must continue to make significant investments in network capacity, infrastructure and edge virtualization solutions. The timely deployment of higher capacity infrastructure and edge virtualization to support high throughput, low latency IoT applications is critical to keeping and attracting key customers, the failure of which could adversely affect our business, financial condition, and results of operations.
 
17

Table of Contents
Our products are highly technical and may contain undetected errors, product defects, security vulnerabilities, or software errors.
Our products and solutions, including our software products, are highly technical and complex and, when deployed, may contain errors, defects, or security vulnerabilities including but not limited to vulnerabilities resulting from the use of third-party hardware and software. We must develop our products quickly to keep pace with the rapidly changing market, and we have a history of frequently introducing new products. Products and services as sophisticated as ours could contain undetected errors or defects, especially when first introduced or when new models or versions are released. Such occurrences could result in damage to our reputation, lost revenue, diverted development resources, increased customer service and support costs, warranty claims, and litigation.
We warrant that our products will be free of defect for various periods of time, depending on the product. In addition, certain of our contracts include epidemic failure clauses. If invoked, these clauses may entitle the customer to return or obtain credits for products and inventory, or to cancel outstanding purchase orders even if the products themselves are not defective.
Errors, viruses, or bugs may be present in software or hardware that we acquire or license from third parties and incorporate into our products or in third party software or hardware that our customers use in conjunction with our products. Our customers’ proprietary software and network firewall protections may corrupt data from our products and create difficulties in implementing our solutions. Changes to third party software or hardware that our customers use in conjunction with our software could also render our applications inoperable. Any errors, defects, or security vulnerabilities in our products or any defects in, or compatibility issues with, any third-party hardware or software or customers’ network environments discovered after commercial release could result in loss of revenue or delay in revenue recognition, loss of customers, theft of trade secrets, data or intellectual property and increased service and warranty cost, any of which could adversely affect our business, financial condition, and results of operations.
Undiscovered vulnerabilities in our products alone or in combination with third party hardware or software could expose them to hackers or other unscrupulous third parties who develop and deploy viruses, and other malicious software programs that could attack our products. Actual or perceived security vulnerabilities in our products could harm our reputation and lead some customers to return products, to reduce or delay future purchases, or use competitive products.
If there are interruptions, outages or performance degradation problems associated with the network infrastructure used to provide our services, customers may experience service outages, this may impact our reputation and future sales
Our continued success depends, in part, on our ability to provide highly available services to our customers. The majority of our current and future customers expect to use our services 24 hours a day, seven days a week, without interruption or degradation of performance. Since a large majority of customer network traffic routes through hardware managed by us, any outage or performance problem that occurs within this infrastructure could impair the ability of our customers to transmit wireless data traffic to our destination servers, which could negatively impact the customers’ IoT devices or solutions. Potential outages and performance problems may occur due to a variety of factors, including hardware failure, equipment configuration changes, capacity constraints, human error and introduction of new functionality. Additionally, we depend on services from various third parties to support IoT networks and platforms. If a third party experiences a service outage, a product defect or bug, or performance degradation, such failures could interrupt customers’ ability to use our services, which could also negatively affect their perception of our service reliability. Our services are hosted in our third party data centers and any outages in these centers from any source including catastrophic events such as terrorist attack, flood, power failure, earthquake, etc. can impact the availability of our services, which could adversely affect our business, financial condition, and results of operations.
Our internal and customer-facing systems, and systems of third parties we rely upon, may be subject to cybersecurity breaches, disruptions, ransom attacks or delays.
A cybersecurity incident in our own systems or the systems of our third-party providers may compromise the confidentiality, integrity, or availability of our own internal data, the availability of our products and websites designed to support our customers, or our customer data. Computer hackers, ransom attacks, foreign governments, or cyber terrorists may attempt to or succeed in penetrating our network security and our website. The recent discovery of wide-scale cybersecurity intrusions into U.S. government and private company computer networks by alleged Russian state actors underscores the ongoing threat posed by sophisticated and foreign state-sponsored attacks. The frequency of ransomware and malware attacks has also been increasing over time. Unauthorized access and theft to our proprietary business information or customer data or rendering them unusable for our use through encryption, may be accomplished through
break-ins,
sabotage, theft of IoT data streams and transmissions, breach of our secure network
 
18

Table of Contents
by an unauthorized party, computer viruses, computer
denial-of-service
attacks, employee theft or misuse, ransomware attacks, breach of the security of the networks of our third-party providers, or other misconduct. Additionally, outside parties may attempt to fraudulently induce employees or users to disclose sensitive or confidential information in order to gain access to data.
Despite our efforts to maintain the security and integrity of our systems, it is impossible to eliminate this risk. Because the techniques used by computer hackers who may attempt to penetrate and sabotage our network security or our website change frequently, they may take advantage of weaknesses in third-party technology or standards of which we are unaware or that we do not control and may not be recognized until long after they have been launched against a target. We may be unable to anticipate or counter these techniques. It is also possible that unauthorized access to customer data or confidential information may be obtained through inadequate use of security controls by customers, vendors, or business partners. Efforts to prevent hackers from disrupting our service or otherwise accessing our systems are expensive to develop, implement, and maintain. Such efforts require ongoing monitoring and updating as technologies change and efforts to overcome security measures become more sophisticated and may limit the functionality of, or otherwise adversely impact our service offering and systems. A cybersecurity incident affecting our systems may also result in theft of our intellectual property, proprietary data, or trade secrets, which would compromise our competitive position, reputation, and operating results. We also may be required to notify regulators about any actual or perceived personal data breach (including the EU Lead Data Protection Authority) as well as the individuals who are affected by the incident within strict time periods.
The systems we rely upon also remain vulnerable to damage or interruption from a number of other factors, including access to the internet, the failure of our network or software systems, or significant variability in visitor traffic on our product websites, earthquakes, floods, fires, power loss, telecommunication failures, computer viruses, human error, and similar events or disruptions. Some of our systems are not fully redundant, and our disaster recovery planning is not sufficient for all eventualities. Our systems are also subject to intentional acts of vandalism. Despite any precautions we may take, the occurrence of a natural disaster, a decision by any of our third-party hosting providers to close a facility we use without adequate notice for financial or other reasons, or other unanticipated problems at our hosting facilities could cause system interruptions and delays, and result in loss of critical data and lengthy interruptions in our services.
We rely on our information systems and those of third parties for activities such as processing customer orders, delivery of products, hosting and providing services and support to our customers, billing and tracking our customers, hosting and managing our customer data, and otherwise running our business. Any disruptions or unexpected incompatibilities in our information systems and those of the third parties upon whom we rely could have a significant impact on our business.
An increasing portion of our revenue comes from subscription solutions and other hosted services in which we store, retrieve, communicate, and manage data that is critical to our customers’ business systems. Disruption of our systems that support these services and solutions could cause disruptions in our customers’ systems and in the businesses that rely on these systems. Any such disruptions could harm our reputation, create liabilities to our customers, hurt demand for our services and solutions, and adversely impact our business, financial condition, and results of operations.
Some of our products rely on third-party technologies, which could result in product incompatibilities or harm availability of our products and services.
We license software, technologies, and intellectual property underlying some of our products and services from third parties. The third-party licenses we rely upon may not continue to be available to us on commercially reasonable terms, or at all, and the software and technologies may not be appropriately supported, maintained, or enhanced by the licensors, resulting in development delays. Some software licenses are subject to annual renewals at the discretion of the licensors. In some cases, if we were to breach a provision of these license agreements, the licensor could terminate the agreement immediately. The loss of licenses to, or inability to support, maintain, and enhance, any such third-party software or technology could result in increased costs, or delays in software releases or updates, until such issues have been resolved. This could have an adverse effect on our business, financial condition, and results of operations.
We also incorporate open-source software into our products. Although we monitor our use of open-source software, the terms of many open-source licenses have not been interpreted by U.S. courts, and there is a risk that such licenses could be construed in a manner that could impose unanticipated conditions or restrictions on our ability to market or sell our products or to develop new products. In such event, we could be required to seek licenses from third parties in order to continue offering our products, to disclose and offer royalty-free licenses in connection with our own source code, to
re-engineer
our products, or to discontinue the sale of our products in the event
re-engineering
cannot be accomplished on a timely basis, any of which could adversely affect our business, financial condition, and results of operations.
 
19

Table of Contents
Failure to maintain the security of our information and technology networks, including information relating to our customers and employees, could adversely affect us. Furthermore, if security breaches in connection with the delivery of our services allow unauthorized third parties to obtain control or access of our solutions, our reputation, business, financial condition, and results of operations and could be harmed.
We are dependent on information technology networks and systems, including the Internet, to process, transmit and store electronic information and, in the normal course of our business, we collect and retain certain information pertaining to our customers and employees. The protection of customer and employee data is critical to us. We devote significant resources to addressing security vulnerabilities in our products and information technology systems, however, the security measures put in place by us cannot provide absolute security, and our information technology infrastructure may be vulnerable to criminal cyber-attacks, ransomware attacks, or data security incidents due to employee or customer error, malfeasance, backdoors in third party software and hardware, or other vulnerabilities. Cybersecurity attacks are increasingly sophisticated, change frequently, and often go undetected until after an attack has been launched. We may fail to identify these new and complex methods of attack or fail to invest sufficient resources in security measures. We cannot be certain that advances in cyber-capabilities or other developments will not compromise or breach the technology protecting the networks that access our services.
As cyber-attacks become more sophisticated, the need to develop our infrastructure to secure our business and customer data can lead to increased cybersecurity protection costs. Such costs may include making organizational changes, deploying additional personnel and protection technologies, training employees, and engaging third party experts and consultants. These efforts come at the potential cost of revenue and human resources that could be utilized to continue to enhance our product offerings.
If a security breach occurs, our reputation, business, results of operations and financial condition could be harmed. We may also be subject to costly notification and remediation requirements if we, or a third party, determines that we have been the subject of a data breach involving personal information of individuals. Though it is difficult to determine what harm may directly result from any specific interruption or security breach, any failure or perceived failure to maintain performance, reliability, security and availability of systems or the actual or potential theft, loss, fraudulent use or misuse of our products or the personally identifiable data of a customer or employee, could result in harm to our reputation or brand, which could lead some customers to seek to stop using certain of our services, reduce or delay future purchases of our services, use competing services, or materially and adversely affect the overall market perception of the security and reliability of our services. A security breach also exposes us to litigation and legal risks, including regulatory actions by state and federal governmental authorities and
non-U.S.
authorities. We may not have adequate insurance coverages for a cybersecurity breach or may realize increased insurance premiums as a result of a security breach. Ultimately, a security breach exposes the Company to potential reputational harm among its customers and investors, along with uncertain damages to our competitiveness, stock price, and long-term shareholder value and could adversely affect our business, financial condition, and results of operations.
Our technology contains third-party open-source software components and failure to comply with the terms of the underlying open-source software licenses could restrict our ability to provide our platform.
Our technology contains software modules licensed to us by third-party authors under “open source” licenses. Use and distribution of open-source software may entail greater risks than use of third-party commercial software, as open-source licensors generally do not provide support, warranties, indemnification, or other contractual protections regarding infringement claims or the quality of the code. In addition, the public availability of such software may make it easier for others to compromise our platform.
Some open-source licenses contain requirements that may, depending on how the licensed software is used or modified, require that we make available source code for modifications or derivative works we create based upon the licensed open-source software, authorizes further modification and redistribution of that source code, makes that source code available at little or no cost, or grants other licenses to our intellectual property. If we combine our proprietary software with open-source software in a certain manner, we could, under certain open-source licenses, be required to release the source code of our proprietary software under the terms of an open-source software license. This could enable our competitors to create similar offerings with lower development effort and time and ultimately could result in a loss of our competitive advantages. Alternatively, to avoid the release of the affected portions of our source code, we could be required to purchase additional licenses, expend substantial time and resources to reengineer some or all of our software or cease use or distribution of some or all of our software until we can adequately address the concerns. If we are held to have breached or failed to fully comply with all the terms and conditions of an open source software license, we could face infringement or other liability, or be required to seek costly licenses from third parties to continue providing our platform on terms that are not economically feasible, to reengineer our platform, to discontinue or delay the provision of our platform if
re-engineering
could not be accomplished on a timely basis, or to make generally available, in source code form, our proprietary code, any of which could adversely affect our business, financial condition and operating results.
 
20

Table of Contents
We may become involved in litigation that could materially adversely affect our business, financial condition, results of operations, and prospects.
We may become a party to litigation and disputes related to our intellectual property, business practices, regulatory compliance, products, or platform. While we intend to vigorously defend these lawsuits, litigation can be costly and time-consuming, divert the attention of management and key personnel from our business operations, and dissuade prospective customers from subscribing to our products. We may need to settle litigation and disputes on terms that are unfavorable to us, or we may be subject to an unfavorable judgment that may not be reversible upon appeal. The terms of any settlement or judgment may require us to cease some or all of our operations or pay substantial amounts to the other party. In addition, our customer agreements include provisions requiring us to indemnify our customers against liabilities if our products infringe a third-party’s intellectual property rights, and we have negotiated other specific indemnities with certain customers, in each case, which could require us to make payments to such customers. During the course of any litigation or dispute, we may make announcements regarding the results of hearings and motions and other interim developments. If securities analysts and investors consider these announcements negative, our stock price may decline. With respect to any intellectual property rights claim, we may have to seek a license to continue practices found to be in violation of third-party rights, which may not be available on reasonable terms and may significantly increase our operating expenses. A license to continue such practices may not be available to us, and we may be required to develop alternative non-infringing technology or practices or discontinue our practices. The development of alternative, non-infringing technology or practices could require significant effort and expenses. Any of the above could materially adversely affect our business, financial condition, results of operations.
Risks Related to Customers and Demand for Our Solutions
The loss of our large customers, particularly our single largest customer could significantly impact our revenue and profitability
Our largest customer in the year ended December 31, 2021, was approximately 21% of our total revenue in that same period and while we maintain a good relationship with the customer at this moment, its potential loss could significantly impact our revenue and profitability. Our next largest customer in the year ended December 31, 2021, was approximately 3% of our total revenue in that same period and while its potential loss would not be as significant as the loss of the largest customer, it usually takes many years to win and grow customers to this level of revenue. The loss of one or several significant customers could adversely affect our business, financial condition, and results of operations.
An increase in customer churn could significantly impact the business
Customer churn is an important driver for our revenue and has been high in our history. While such customer churn has been trending directionally downwards in the last few years, it could increase because of a variety of factors, including a potential decrease in our levels of customer service or other performance failures, our inability or unwillingness to maintain competitive pricing, or our inability to keep up with the technological, operational or functional needs of our customers, a loss of key personnel or other factors which could adversely affect our business, financial condition, and results of operations.
Transitions of cellular network technologies from 2G/3G to LTE, Cat-M, NB-IoT or 5G or other cellular telecommunications technologies could impact our revenue due to the loss of subscribers or reduced pricing
In the United States, the major carriers have announced intentions to phase out their 2G and 3G networks by the end of 2022. As of December 31, 2021, KORE estimates that it has approximately 1.5 million connections that operate on 2G and 3G networks in the United States. European carriers have also announced their intentions to begin 2G and 3G network shutdowns starting in 2025.
While KORE has strong relationships with many of the affected customers and expects to retain most of the connections which will not be retired upon the switch to 4G or 5G technologies, some of these connections may be lost as a result of competitive bidding processes. LTE rate plans are typically lower in price than legacy 2G and 3G rate plans. As a result, the phase out of 2G and 3G may result in lower revenue per unit and/or lower revenue to KORE. While the projected impact of this is incorporated in KORE’s projections, if the projected impact of this phase out is more significant than projected, including if KORE loses more connections than anticipated or if LTE rate plans are priced lower than currently expected, this transition could have an adverse effect on our business, financial condition, and results of operations.
 
21

Table of Contents
Our inability to adapt to rapid technological change in our markets could impair our ability to remain competitive and adversely affect our results of operations.
All of the markets in which we operate are characterized by rapid technological change, frequent introductions of new products, services and solutions and evolving customer demands. In addition, we are affected by changes in the many industries related to the products or services we offer, including Connectivity services and IoT Solutions offered to our Connected Health, Fleet Management, Communication Services, Asset management and industrial verticals. As the technologies used in each of these industries evolves, we will face new integration and competition challenges. For example, eSIM and eUICC standards may evolve and the Company will have to evolve its technology to such standards. If we are unable to adapt to rapid technological change, it could adversely affect our business, financial condition, and results of operations and our ability to remain competitive.
Additionally, the deployment of 5G network technology is subject to a variety of risks, including those related to equipment and spectrum availability, unexpected costs, and regulatory permitting requirements that could cause deployment delays or network performance issues. These issues could result in significant costs or reduce the anticipated benefits of the enhancements to our networks. If our services or solutions fail to gain acceptance in the marketplace, or if costs associated with the implementation and introduction of these services or solutions materially increase, our ability to retain and attract customers could be adversely affected.
We may not be able to retain and increase sales to our existing customers, which could negatively impact our financial results.
We generally seek to license our platform and solutions pursuant to customer subscriptions. However, our customers have no obligation to maintain the subscription and can often terminate with
30-days’
notice. We also actively seek to sell additional solutions to our existing customers. If our efforts to satisfy our existing customers are not successful, we may not be able to retain them or sell additional functionality to them and, as a result, our revenue and ability to grow could be adversely affected. Customers may choose not to renew their subscriptions for many reasons, including the belief that our service is not required for their business needs or is otherwise not cost-effective, a desire to reduce discretionary spending, or a belief that our competitors’ services provide better value. Additionally, our customers may not renew for reasons entirely out of our control, such as the dissolution of their business or an economic downturn in their industry. A significant increase in our churn rate would have an adverse effect on our business, financial condition, and operating results.
A part of our growth strategy is to sell additional new features and solutions to our existing customers. Our ability to sell new features to customers will depend in significant part on our ability to anticipate industry evolution, practices and standards and to continue to enhance existing solutions or introduce or acquire new solutions on a timely basis to keep pace with technological developments both within our industry and in related industries, and to remain compliant with any regulations mandated by federal agencies or state-mandated or foreign government regulations as they pertain to our customers. However, we may prove unsuccessful either in developing new features or in expanding the third-party software and products with which our solutions integrate. In addition, the success of any enhancement or new feature depends on several factors, including the timely completion, introduction and market acceptance of the enhancement or feature. Any new solutions we develop or acquire might not be introduced in a timely or cost-effective manner and might not achieve the broad market acceptance necessary to generate significant revenue. If any of our competitors implement new technologies before we are able to implement them or better anticipate the innovation and integration opportunities in related industries, those competitors may be able to provide more effective or cheaper solutions than ours.
Adverse economic conditions or reduced spending on information technology solutions may adversely impact our revenue and profitability.
Uncertainty about future economic conditions makes it difficult for us to forecast operating results and to make decisions about future investments. We are unable to predict the likely duration and severity of adverse economic conditions in the United States and other countries, but the longer the duration, the greater risks we face in operating our business. We cannot assure you that current economic conditions, worsening economic conditions or prolonged poor economic conditions will not have a significant adverse impact on the demand for our solutions, and consequently could adversely affect our business, financial condition, and results of operations.
The marketability of our products may suffer if wireless telecommunications operators do not deliver acceptable wireless services.
The success of our business depends, in part, on the capacity, affordability, reliability and prevalence of wireless data networks provided by wireless telecommunications operators and on which our products and solutions operate.
 
22

Table of Contents
Currently, various wireless telecommunications operators, either individually or jointly with us, sell our products in connection with the sale of their wireless data services to their customers. Growth in demand for wireless data access may be limited if, for example, wireless telecommunications operators cease or materially curtail operations, fail to offer services that customers consider valuable at acceptable prices, change the terms of trade to us including offering us meaningful volume discounts without unduly high volume commitments, fail to maintain sufficient capacity to meet demand for wireless data access, delay the expansion of their wireless networks and services, fail to offer and maintain reliable wireless network services or fail to market their services effectively. Lack of demand for wireless data access could adversely affect our business, financial condition, and results of operations
Reduction in regulation in certain markets may adversely impact demand for certain of our solutions by reducing the necessity for, or desirability of, our solutions.
Regulatory compliance and reporting are driven by legislation and requirements, which are often subject to change, from regulatory authorities in nearly every jurisdiction globally. For example, in the United States, fleet operators can face numerous complex regulatory requirements, including mandatory Compliance, Safety and Accountability driver safety scoring, hours of service, compliance and fuel tax reporting. The reduction in regulation in certain markets may adversely impact demand for certain of our solutions, which could materially and adversely affect our business, financial condition and results of operations. Conversely, an increase in regulation could increase KORE’s cost of providing services, which could adversely affect our business, financial condition, and results of operations.
We may not be able to identify suitable acquisition candidates, complete acquisitions or successfully integrate acquisitions, and acquisitions may not produce the intended results or may expose us to unknown or contingent liabilities.
We may not be able to identify suitable acquisition candidates which are good strategic fits at the right valuation, complete acquisitions or integrate acquisitions successfully, including our recent acquisitions of Business Mobility Partners Inc. and SIMON IoT LLC. In addition, acquisitions involve numerous risks, including difficulties in the integration of acquired operations and the diversion of management’s attention from other business concerns. In order to complete such strategic transactions, we may need to seek additional financing to fund these investments and acquisitions. Should we need to do so, we may not be able to secure such financing, or obtain such financing on favorable terms due to general market conditions or the volatile nature of the healthcare marketplace. Should we issue equity securities as consideration in any acquisition, such issuance may be dilutive to shareholders and the acquisition may not produce our desired results.
Even if we are successful in making an acquisition, the business that we acquire may not be successful or may require significantly greater resources and investments than we originally anticipated. We may expend extensive resources on an acquisition of a particular business that we are not able to successfully integrate into our operations, if at all, or where our expectations with respect to customer demands are not met.
Our ability to fully realize the anticipated benefits of both historical and future acquisitions will depend, to a large extent, on our ability to integrate the businesses we acquire. Integrating and coordinating aspects of the operations and personnel of acquisitions with ours involves complex operational and personnel-related challenges. This process is time-consuming and expensive, disrupts the businesses of both our business and the acquired business and may not result in the full benefits expected by us, including cost synergies expected to arise from operational efficiencies and overlapping general and administrative functions.
The potential difficulties, and resulting costs and delays, include:


retaining key customers, key employees and key business relationships after the acquisition;


managing a larger combined company and consolidating corporate and administrative infrastructures successfully;


the inability to realize expected synergies and cost-savings;


difficulties in managing geographically dispersed operations, including risks associated with entering markets in which we have no or limited prior experience;


underperformance of any acquired business relative to our expectations and the price we paid;


negative near-term impacts on financial results after an acquisition, including acquisition-related earnings charges;
 
23

Table of Contents
 
 
the assumption or incurrence of additional debt obligations or expenses, or use of substantial portions of our cash;


the issuance of equity securities to finance or as consideration for any acquisitions that dilute the ownership of our stockholders;


claims by terminated employees and shareholders of acquired companies or other third parties related to the transaction;


problems maintaining uniform procedures, controls and policies with respect to our financial accounting systems;


unanticipated issues in integrating information technology, communications, billing platforms, operational support systems and other systems; and


risks associated with acquiring intellectual property, including potential disputes regarding acquired companies’ intellectual property.
Additionally, the integration of operations and personnel may place a significant burden on management and other internal resources. The attention of our management may be directed towards integration considerations and may be diverted
from our day-to-day business operations,
and matters related to the integration may require commitments of time and resources that could otherwise have been devoted to other opportunities that might have been beneficial to us and our business. The diversion of management’s attention, and any difficulties encountered in the transition and integration process, could harm our business, financial condition and results of operations.
Risks Related to Our Intellectual Property
We are dependent on proprietary technology, which could result in litigation that could divert significant valuable resources.
Our future success and competitive position are dependent upon our proprietary technology. Despite our efforts to protect our intellectual property, unauthorized parties may attempt to copy or otherwise obtain our software or develop software with the same functionality or to obtain and use information that we regard as proprietary. Others may develop technologies that are similar or superior to our technology or duplicate our technology. In addition, effective copyright, patent, and trade secret protection may be unavailable, limited, or not applied for in certain countries. The steps taken by us to protect our technology might not prevent the misappropriation of such technology.
The value of our products relies substantially on our technical innovation in fields in which there are many current patent filings. Third parties may claim that we or our customers (some of whom are indemnified by us) are infringing their intellectual property rights. For example, individuals and groups may purchase intellectual property assets for the purpose of asserting claims of infringement and attempting to extract settlements from us or our customers. The number of these claims has increased in recent years. As new patents are issued or are brought to our attention by the holders of such patents, it may be necessary for us to secure a license from such patent holders, redesign our products, or withdraw products from the market. In addition, the legal costs and engineering time required to safeguard intellectual property or to defend against litigation could become a significant expense of operations. Any such litigation could require us to incur substantial costs and divert significant valuable resources, including the efforts of our technical and management personnel, which could adversely affect our business, financial condition and results of operations.
If we are unable to protect our intellectual property and proprietary rights, our competitive position and our business could be harmed.
We rely on a combination of intellectual property laws, trade secrets, confidentiality procedures and contractual provisions to protect our intellectual property and proprietary rights. Monitoring unauthorized use of our intellectual property is difficult and costly. The steps we have taken to protect our proprietary rights may not be adequate to prevent misappropriation of our intellectual property. We may not be able to detect unauthorized use of, or take appropriate steps to enforce, our intellectual property rights. Our competitors may also independently develop similar technology. In addition, the laws of many countries do not protect our proprietary rights to as great an extent as do the laws of the United States. Any failure by us to meaningfully protect our intellectual property could result in competitors offering products that incorporate our most technologically advanced features, which could seriously reduce demand for our products and solutions. In addition, we may in the future need to initiate infringement claims or litigation. Litigation,
 
24

Table of Contents
whether we are a plaintiff or a defendant, can be expensive, time consuming and may divert the efforts of our technical staff and managerial personnel, which could adversely affect our business, financial condition and results of operations, whether or not such litigation results in a determination favorable to us.
An assertion by a third party that we are infringing its intellectual property could subject us to costly and time-consuming litigation or expensive licenses and our business could be harmed.
The technology industries involving mobile data communications, IoT devices, software and services are characterized by the existence of a large number of patents, copyrights, trademarks and trade secrets and by frequent litigation based on allegations of infringement or other violations of intellectual property rights. Much of this litigation involves patent holding companies or other adverse patent owners who have no relevant product revenue of their own, and against whom our own patent portfolio may provide little or no deterrence. One or more patent infringement lawsuits from
non-practicing
entities may be brought against us or our subsidiaries every year in the ordinary course of business.
We cannot assure you that we or our subsidiaries will prevail in any current or future intellectual property infringement or other litigation given the complex technical issues and inherent uncertainties in such litigation. Defending such claims, regardless of their merit, could be time-consuming and distracting to management, result in costly litigation or settlement, cause development delays, or require us or our subsidiaries to enter into royalty or licensing agreements. In addition, we or our subsidiaries could be obligated to indemnify our customers against third parties’ claims of intellectual property infringement based on our products or solutions. If our products or solutions violate any third-party intellectual property rights, we could be required to withdraw them from the market, re-develop them or seek to obtain licenses from third parties, which might not be available on reasonable terms or at all. Any efforts to re-develop our products or solutions, obtain licenses from third parties on favorable terms or license a substitute technology might not be successful and, in any case, might substantially increase our costs and harm our business, financial condition and operating results. Withdrawal of any of our products or solutions from the market could harm our business, financial condition and operating results.
In addition, we incorporate open-source software into our products and solutions. Given the nature of open-source software, third parties might assert copyright and other intellectual property infringement claims against us based on our use of certain open-source software programs. The terms of many open-source licenses to which we are subject have not been interpreted by U.S. courts or courts of other jurisdictions, and there is a risk that those licenses could be construed in a manner that imposes unanticipated conditions or restrictions on our ability to commercialize our products and solutions. In that event, we could be required to seek licenses from third parties in order to continue offering our products and solutions, to
re-develop
our solutions, to discontinue sales of our solutions, or to release our proprietary software source code under the terms of an open-source license, any of which could adversely affect our business, financial condition, and results of operations.
Risks Related to Competition
The market for the products and services that we offer is rapidly evolving and highly competitive. We may be unable to compete effectively.
The market for the products and services that we offer is rapidly evolving and highly competitive. We expect competition to continue to increase and intensify, especially in the 5G market. Many of our competitors or potential competitors have significantly greater financial, technical, operational and marketing resources than we do. These competitors, for example, may be able to respond more rapidly or more effectively than we can to new or emerging technologies, changes in customer requirements, supplier-related developments, or a shift in the business landscape. They also may devote greater or more effective resources than we do to the development, manufacture, promotion, sale, and post-sale support of their respective products and services.
Many of our current and potential competitors have more extensive customer bases and broader customer, supplier and other industry relationships that they can leverage to establish competitive dealings with many of our current and potential customers. Some of these companies also have more established and larger customer support organizations than we do. In addition, these companies may adopt more aggressive pricing policies or offer more attractive terms to customers than they currently do, or than we are able to do. They may bundle their competitive products with broader product offerings and may introduce new products, services and enhancements. Current and potential competitors might merge or otherwise establish cooperative relationships among themselves or with third parties to enhance their products, services or market position. In addition, at any time any given customer or supplier of ours could elect to enter our then existing line of business and thereafter compete with us, whether directly or indirectly. As a result, it is possible that new competitors or new or otherwise enhanced relationships among existing competitors may emerge and rapidly acquire significant market share to the detriment of our business.
 
25

Table of Contents
Our products compete with a variety of solutions, including other Subscription-based IoT platforms and solutions. Our current competitors include:
For Connectivity services: telecom carriers such as
T-Mobile
and Vodafone; Mobile Virtual Network Operators such as Aeris and Wireless Logic;
For IoT Solutions and Analytics: device management services providers such as Velocitor and Futura, fleet management SaaS providers such as Fleetmatics and GPS Trakit, and analytics services providers such as Galooli and Intellisite.
We expect our competitors to continue to improve the features and performance of their current products and to introduce new products, services and technologies which, if successful, could reduce our sales and the market acceptance of our products, generate increased price competition and make our products obsolete. For our products to remain competitive, we must, among other things, continue to invest significant resources (financial, human and otherwise) in, among other things, research and development, sales and marketing, and customer support. We cannot be sure that we will have or will continue to have sufficient resources to make these investments or that we will be able to make the technological advances in the marketplace, meet changing customer requirements, achieve market acceptance and respond to our competitors’ products. If we are unable to compete effectively, it could adversely affect our business, financial condition and results of operations.
The market for IoT Connectivity and IoT Solutions is very competitive. If we do not compete effectively, our operating results may be harmed.
The market for IoT Connectivity and IoT Solutions is very competitive. Competition in the addressable markets is based primarily on the functionality and scalability of the underlying platforms, proprietary intellectual property, access to favorable terms of trade from cellular carriers and other vendors, the ability and willingness to offer competitive pricing to customers, customer service and responsiveness, the depth of customer relationships, product performance, the demonstrated ability to maintain compliance with laws such as HIPAA in certain industries, having the expertise required to resolve difficulties in installing, using and maintaining solutions, brand and reputation, and the financial resources of the vendor. We expect competition to be maintained at current levels and potentially even intensify in the future with the introduction of new technologies such as 5G and market entrants. In addition, wireless carriers, such as Vodafone may offer solutions that benefit from the carrier’s scale which we may be unable to match for larger customer opportunities. We may not be able to compete effectively in this ecosystem as the competitive landscape continues to develop. Competition could result in reduced operating margins, increased sales and marketing expenses and the loss of market share, any of which could adversely affect our business, financial condition, and results of operations.
We may not be able to maintain and expand our business if we are not able to hire, retain and manage additional qualified personnel.
Our success in the future depends in part on the continued contribution of our executive, technical, engineering, sales, marketing, operations and administrative personnel. Recruiting and retaining skilled personnel in the industries in which we operate, including engineers and other technical staff and skilled sales and marketing personnel, is highly competitive. In addition, in the event that we acquire another business or company, the success of any acquisition will depend in part on our retention and integration of key personnel from the acquired company or business.
Although we may enter into employment agreements with members of our senior management and other key personnel, these arrangements do not prevent any of our management or key personnel from leaving the Company. If we are not able to attract or retain qualified personnel in the future, or if we experience delays in hiring required personnel, particularly qualified technical and sales personnel, we may not be able to maintain and expand our business.
Risks Related to Developing and Delivering Our Solutions
We are dependent on telecommunications carriers to provide our IoT Connectivity Services and a disruption in one or more of these relationships could significantly adversely impact our business
Our IoT Connectivity services are built on top of cellular connectivity provided by large telecommunications carriers and while we have a large number of carrier relationships, revenue derived from connectivity built on top of cellular networks provided by our top three carrier relationships are approximately 41% of the business for the year ended December 31, 2021. Our inability to keep an
on-going
contractual relationship with our existing or desired future telecommunications carrier partners or to maintain favorable terms of trade with them including competitive pricing, reasonable or no volume commitments, payment terms, access to latest cellular and network technologies including
 
26

Table of Contents
5G, eSIMs and eUICC, could adversely affect our ability to sell our connectivity services to customers. KORE’s contracts with large telecommunications carriers are not long term, and so are subject to frequent renegotiation. The outcome of any renegotiation cannot be guaranteed. Additional consolidation of carriers could further reduce our bargaining power in negotiations with carriers, which could adversely affect our business, financial condition, and results of operations.
We are dependent on a limited number of suppliers for certain critical components to our solutions; a disruption in our supply chain could adversely affect our revenue and results of operations.
Our current reliance on a limited group of suppliers involves risks, including a potential inability to obtain an adequate supply of required products or components to meet customers’ IoT Solutions delivery requirements, a risk that we may accumulate excess inventories if we inaccurately forecast demand for our products, reduced control over pricing and delivery schedules, discontinuation of or increased prices for certain components, and economic conditions that may adversely impact the viability of our suppliers and contract manufacturers. Any disruption in our supply chain could reduce our revenue and adversely impact our financial results. Such a disruption could occur as a result of any number of events, including, but not limited to, increases in wages that drive up prices or labor stoppages, the imposition of regulations, quotas or embargoes on components, a scarcity of, or significant increase in the price of, required electronic components for our products, trade restrictions, tariffs or duties, fluctuations in currency exchange rates, transportation failures affecting the supply chain and shipment of materials and finished goods, third party interference in the integrity of the products sourced through the supply chain, the unavailability of raw materials, severe weather conditions, natural disasters, civil unrest, military conflicts, geopolitical developments, war or terrorism, including the ongoing conflict in Ukraine, regional or global pandemics like COVID-19, and disruptions in utility and other services. In recent months global supply chains have been disrupted by COVID-19 and other factors, resulting in shortages of a number of goods, including chips necessary to produce a wide variety of devices. To the extent we are unable to obtain adequate supplies of chips, this could impact our brand as well as our results of operations. Any inability to obtain adequate deliveries or any other circumstance that would require us to seek alternative sources of supply or to manufacture, assemble, and test such components internally could significantly delay our ability to ship our products, which could damage relationships with current and prospective customers and could harm our reputation and brand and could adversely affect our business, financial condition, and results of operations.
In February 2022, in response to the military conflict between Russia and Ukraine, the United States and other North Atlantic Treaty Organization member states, as well as
non-member
states, announced targeted economic sanctions on Russia, including certain Russian citizens and enterprises, and the continuation of the conflict may trigger additional economic and other sanctions. The potential impacts of the conflict and related sanctions could include supply chain and logistics disruptions, macro financial impacts resulting from the exclusion of Russian financial institutions from the global banking system, volatility in foreign exchange rates and interest rates, inflationary pressures on raw materials and energy and heightened cybersecurity threats. Although to date our operations have not been directly impacted by the conflict, we do not and cannot know if the conflict, which remains ongoing, could escalate and result in broader economic and security concerns which could adversely affect our business, financial condition or results of operations.
We currently rely on third parties to manufacture and warehouse the components of our solutions, which exposes us to a number of risks and uncertainties outside our control.
We currently rely on third parties to manufacture and warehouse the components of our solutions. If one of these third-party manufacturers were to experience delays, disruptions, capacity constraints or quality control problems in its manufacturing operations, product shipments to our customers could be delayed or rejected or our customers could consequently elect to cancel the underlying subscription. These disruptions would negatively impact our revenue, competitive position and reputation. Further, if we are unable to manage successfully our relationship with a manufacturer, the quality and availability of products used in our services and solutions may be harmed. None of our third-party manufacturers is obligated to supply us with a specific quantity of products, except as may be provided in a particular purchase order that we have submitted to, and that has been accepted by, such third-party manufacturer. Our third-party manufacturers could, under some circumstances, decline to accept new purchase orders from us or otherwise reduce their business with us. If a manufacturer stopped manufacturing our products for any reason or reduced manufacturing capacity, we may be unable to replace the lost manufacturing capacity on a timely and comparatively cost-effective basis, which would adversely impact our operations. In addition, we generally do not enter into long-term contracts with our manufacturers. As a result, we are subject to price increases due to availability, and subsequent price volatility, in the marketplace of the components and materials needed to manufacture our products. If a third-party manufacturer were to negatively change the product pricing and other terms under which it agrees to manufacture for us and we were unable to locate a suitable alternative manufacturer, our manufacturing costs could increase.
 
27

Table of Contents
Because we outsource the manufacturing of the components of our solutions, the cost, quality and availability of third-party manufacturing operations is essential to the successful production and sale of our products. Our reliance on third-party manufacturers exposes us to a number of risks which are outside our control, including:


unexpected increases in manufacturing costs;


interruptions in shipments if a third-party manufacturer is unable to complete production in a timely manner;


inability to control quality of finished products;


inability to control delivery schedules;


inability to control production levels and to meet minimum volume commitments to our customers;


inability to control manufacturing yield;


inability to maintain adequate manufacturing capacity; and


inability to secure adequate volumes of acceptable components at suitable prices or in a timely manner.
Although we promote ethical business practices and our operations personnel periodically monitor the operations of our manufacturers, we do not control the manufacturers or their labor and other legal compliance practices. If our current manufacturers, or any other third-party manufacturer which we may use in the future, violate U.S. or foreign laws or regulations, we may be subjected to extra duties, significant monetary penalties, adverse publicity, the seizure and forfeiture of products that we are attempting to import or the loss of our import privileges. The effects of these factors could render the conduct of our business in a particular country undesirable or impractical and could adversely affect our business, financial condition, and results of operations.
We depend on sole source suppliers for some products used in our IoT Solutions. The availability and sale of those services would be harmed if there is a disruption to our relationship with any of these sole-source suppliers, or if they are not able to meet our demand and alternative suitable products are not available on acceptable terms, or at all.
Our services use hardware, software and services from various third parties, some of which are procured from single suppliers. For example, some of our healthcare devices are sourced from JACS. From time to time, certain components used in our products or solutions have been in short supply or their anticipated commercial introduction has been delayed or their availability has been interrupted for reasons outside our control. For example, we currently rely on a single production system at Integron, an operating subsidiary of Kore. While we are currently pursuing alternative production system from third-party suppliers, if we are unable to find a suitable alternative on commercially reasonable terms, our operations may experience interruptions. If there is a shortage or interruption in the availability to us of any such systems, components or products and we cannot timely obtain a commercially and technologically suitable substitute or make sufficient and timely design or other modifications to permit the use of such a substitute component or product, we may not be able to timely deliver sufficient quantities of our products or solutions to satisfy our contractual obligations and may not be able to meet particular revenue expectations. Moreover, even if we timely locate a substitute part or product, but its price materially exceeds the original cost of the component or product, then our business, financial condition and results of operations could be adversely affected.
Natural disasters, public health crises, such as the
COVID-19
pandemic, political crises, climate change and other catastrophic events or other events outside of our control could damage our facilities or the facilities of third parties on which we depend, and could impact consumer spending.
If any of our facilities or the facilities of our third-party service providers including for example our telecommunications carrier partners, other suppliers of products that are components of our IoT Solutions, or our data center providers, or our other partners is affected by natural disasters, such as earthquakes, tsunamis, wildfires, power shortages, floods, public health crises (such as pandemics and epidemics), political crises (such as terrorism, war, political instability or other conflict), climate change or other events outside our control, including a cyberattack, our critical business or IT systems could be destroyed or disrupted and our ability to conduct normal business operations and our revenue and operating results could be adversely affected. For example, the COVID-19 pandemic has impacted, and may continue to have an impact on our operations, including the implementation of various containment measures, such as government-imposed shelter-in-place orders, quarantines, national or regional lockdowns, travel restrictions and other public health safety measures. Specifically, in response to the spread of COVID-19, and in accordance with direction from government authorities, we have, for example, limited the number of such personnel that can be present at our facilities at any one time, mandated the usage of face masks in our facilities, limited the maximum numbers of people allowed in rooms at one time and requested that many of our personnel work remotely. Our business also may be impacted by changes in the severity of the COVID-19 pandemic at different times in the various cities and regions
 
28

Table of Contents
where we operate and offer services, and by challenges faced in implementing nationwide COVID-19 vaccinations. Even after the COVID-19 pandemic has moderated and the business and social distancing restrictions have eased, we may continue to experience similar adverse effects to our business. Moreover, these types of events could negatively impact consumer spending in the impacted regions or, depending upon the severity, globally, which could adversely affect our business, financial condition and results of operations.
We rely on third-party intellectual property to develop and provide our solutions and significant increases in licensing costs or defects in third-party software could harm our business.
We rely on intellectual property licensed from third parties to develop and offer our solutions. In addition, we may need to obtain future licenses from third parties to use intellectual property associated with our solutions. These licenses may not be available to us on acceptable terms, without significant price increases or at all. Any loss of the right to use any such intellectual property required for the development and maintenance of our solutions could result in delays in the provision of our solutions until equivalent technology is either developed by us, or, if available from others, is identified, obtained, and integrated, which could harm our business. Any errors or defects in third-party intellectual property could result in errors or a failure of our solutions, which could adversely affect our business, financial condition, and results of operations.
Our solutions integrate with third-party technologies and if our solutions become incompatible with these technologies, our solutions would lose functionality and our customer acquisition and retention could be adversely affected.
Our solutions integrate with third-party software and devices to allow our solutions to perform key functions. Errors, viruses or bugs may be present in third-party software that our customers use in conjunction with our solutions. Changes to third-party software that our customers use in conjunction with our solutions could also render our solutions inoperable. Customers may conclude that our software is the cause of these errors, bugs or viruses and terminate their subscriptions. The inability to easily integrate with, or any defects in, any third-party software could result in increased costs, or in delays in software releases or updates to our products until such issues have been resolved, which could adversely affect on our business, financial condition, results of operations, and future prospects and could damage our reputation.
Our solutions rely on cellular and GPS networks and any disruption, failure or increase in costs could impede our profitability and harm our financial results.
The critical links in our current solutions are between devices which in some cases are located at our customers facilities as well as third party cellular networks, which allow us to obtain data and transmit it to our system. Increases in the fees charged by cellular carriers for data transmission or changes in the cellular networks, such as a cellular carrier discontinuing support of the network currently used by our
in-vehicle
devices or customer premise equipment, requiring retrofitting of our devices could increase our costs and impact our profitability. In addition, technologies that rely on GPS depend on the use of radio frequency bands and any modification of the permitted uses of these bands may adversely affect the functionality of GPS and, in turn, our solutions. If we are unable to maintain good relationships and favorable terms and conditions with the cellular network carrier on which we rely, it could adversely affect our business, financial condition, and results of operations.
The mobile carriers can and will discontinue radio frequency technologies as they become obsolete. If we are unable to design our solutions into new technologies such as 4G, 4G LTE and 5G or 5G NR, our future prospects and revenue could be limited.
Any significant disruption in service on our websites or in our computer systems could damage our reputation and result in a loss of customers, which would harm our business and operating results.
Our brand, reputation, and ability to attract, retain, and serve our customers are dependent upon the reliable performance of our services and our customers’ ability to access our solutions at all times. Our customers rely on our solutions to make operating decisions related to their businesses, as well as to measure, store and analyze valuable data regarding their businesses. Our solutions are vulnerable to interruption and our data centers are vulnerable to damage or interruption from human error, intentional bad acts, computer viruses or hackers, earthquakes, hurricanes, floods, fires, war, terrorist attacks, power losses, hardware failures, systems failures, telecommunications failures, and similar events, any of which could limit our customers’ ability to access our solutions. Prolonged delays or unforeseen difficulties in connection with adding capacity or upgrading our network architecture may cause our service quality to suffer. Any event that significantly disrupts our service or exposes our data to misuse could damage our reputation and harm our business, financial condition and results of operations, including reducing our revenue, causing us to issue credits to customers, subjecting us to potential liability, increasing our churn rates, or increasing our cost of acquiring new customers.
 
29

Table of Contents
Our future capital needs are uncertain, and we may need to raise additional funds in the future. We may not be able to raise such additional funds on acceptable terms or at all.
We may need to raise substantial additional capital in the future to fund our operations, develop and commercialize new products and solutions or acquire companies. If we require additional funds in the future, we may not be able to obtain those funds on acceptable terms, or at all. If we raise additional funds by issuing equity securities, our stockholders may experience dilution. Debt financing, if available, may involve covenants restricting our operations or our ability to incur additional debt. Any debt or additional equity financing that we raise may contain terms that are not favorable to us or our stockholders. In addition, restrictions in our existing debt agreements may limit the amount and/or type of indebtedness that we are able to incur.
If we do not have, or are not able to obtain, sufficient funds, we may have to delay development or commercialization of our products and solutions, liquidate some or all of our assets, or delay, reduce the scope of or eliminate some or all of our sales and marketing expansion programs. Any of these actions could harm our operating results.
We have a history of losses and may not be able to achieve or sustain profitability in the future.
We have a history of losses, and we may not achieve or maintain profitability in the future. We incurred net losses of $23.4 million in 2019, $35.2 million in 2020, and $24.5 million in 2021. As of December 31, 2021, we had an accumulated deficit of $138.2 million. We are not certain whether or when we will be able to achieve or sustain profitability in the future. We also expect our expenses to increase in future periods as we continue to invest in growth, which could negatively affect our future results of operations if our revenue does not increase. These investments may not result in increased revenue or profitable growth. Any failure to increase our revenue as we invest in our business, or to manage our costs, could prevent us from achieving or maintaining profitability or positive cash flow. We may also incur significant losses in the future for a number of reasons, including the other risks described in this prospectus, and unforeseen expenses, difficulties, complications, delays, and other unknown events. If we are unable to successfully address these risks and challenges, our business, financial condition, results of operations, and prospects could be materially adversely affected.
Risks Related to International Operations
We face risks inherent in conducting business internationally, including compliance with international and U.S. laws and regulations that apply to our international operations
These laws and regulations include data privacy requirements, labor relations laws, tax laws, anti-competition regulations, import and trade restrictions, export control laws, and laws that prohibit corrupt payments to governmental officials or certain payments or remunerations to customers, including the U.S. Foreign Corrupt Practices Act (“
FCPA
”), the U.K. Bribery Act, and other anti-corruption laws that have recently been the subject of a substantial increase in global enforcement. Many of our products are subject to U.S. export law restrictions that limit the destinations and types of customers to which our products may be sold or that require an export license in connection with sales outside the United States. Given the high level of complexity of these laws, there is a risk that some provisions may be inadvertently or intentionally breached, for example through fraudulent or negligent behavior of individual employees, our failure to comply with certain formal documentation requirements or otherwise. Also, we may be held liable for actions taken by our local partners. Violations of these laws and regulations could result in fines, criminal sanctions against us, our officers or our employees, and prohibitions or conditions on the conduct of our business. Any such violations could include prohibitions or conditions on our ability to offer our products in one or more countries and could materially damage our reputation, our brand, our international expansion efforts, our ability to attract and retain employees, our business, financial condition and results of operations.
We operate in many parts of the world that have experienced significant governmental corruption to some degree and, in certain circumstances, strict compliance with anti-bribery laws may conflict with local customs and practices. We may be subject to competitive disadvantages to the extent that our competitors are able to secure business, licenses, or other preferential treatment by making payments to government officials and others in positions of influence or through other methods that relevant law and regulations prohibit us from using. Our success depends, in part, on our ability to anticipate these risks and manage these difficulties.
 
30

Table of Contents
Our substantial international operations may increase our exposure to potential liability under anti-corruption, trade protection, tax and other laws and regulations.
The FCPA and other anti-corruption laws and regulations (“
Anti-Corruption Laws
”) prohibit corrupt payments by our employees, vendors or agents. From time to time, we may receive inquiries from authorities in the United States and elsewhere about our business activities outside of the United States and our compliance with Anti-Corruption Laws. While we devote substantial resources to our global compliance programs and have implemented policies, training and internal controls designed to reduce the risk of corrupt payments, our employees, vendors or agents may violate our policies.
Our failure to comply with Anti-Corruption Laws could result in significant fines and penalties, criminal sanctions against us, our officers or our employees, prohibitions on the conduct of our business, and damage to our reputation and could adversely affect our business, financial condition, and results of operations. Operations outside of the United States may be affected by changes in trade protection laws, policies and measures, and other regulatory requirements affecting trade and investment.
As a result of our international operations, we are subject to foreign tax regulations. Such regulations may not be clear, not consistently applied and subject to sudden change, particularly with regard to international transfer pricing. Our earnings could be reduced by the uncertain and changing nature of such tax regulations.
Our software contains encryption technologies, certain types of which are subject to U.S. and foreign export control regulations and, in some foreign countries, restrictions on importation and/or use. Any failure on our part to comply with encryption or other applicable export control requirements could result in financial penalties or other sanctions under the U.S. or foreign export regulations, including restrictions on future export activities, which could adversely affect our business financial condition, and results of operations. Regulatory restrictions could impair our access to technologies needed to improve our solutions and may also limit or reduce the demand for our solutions outside of the United States.
We may be affected by fluctuations in currency exchange rates
We are potentially exposed to adverse as well as beneficial movements in currency exchange rates. Although the majority of our sales are transacted in U.S. dollars, expenses may be paid in local currencies. An increase in the value of the dollar could increase the real cost to our customers of our products in those markets outside the U.S. where we sell in dollars, and a weakened dollar could increase the cost of local operating expenses, procurement of raw materials from sources outside the United States, and overseas capital expenditures. We also conduct certain investing and financing activities in local currencies. Our foreign exchange forward contracts reduce, but do not eliminate, the impact of currency exchange rate movements; therefore, changes in exchange rates could adversely affect our business, financial condition and results of operations.
Risk Related to Regulation
We are subject to evolving privacy laws in the United States and other jurisdictions that are subject to potentially differing interpretations and which could adversely impact our business and require that we incur substantial costs
Existing privacy-related laws and regulations in the United States and other countries are evolving and are subject to potentially differing interpretations, and various U.S. federal and state or other international legislative and regulatory bodies may expand or enact laws regarding privacy and data security-related matters. For example, the EU-U.S. Privacy Shield, a basis for data transfers from the EU to the U.S., was invalidated by the European Court of Justice, and we expect that the international transfer of personal data will present ongoing compliance challenges and complicate our business transactions and operations. Brexit, the United Kingdom’s withdrawal from the European Union, could also lead to further legislative and regulatory changes with regard to personal data transfers between the two territories. New privacy laws have come into effect in Brazil and New Zealand in 2020, and revisions of privacy laws are currently pending in countries like Canada and China. Some countries are considering or have passed legislation that requires local storage and processing of data, including geospatial data. In addition, in June 2018, California enacted the California Consumer Privacy Act (the “
CCPA
”), which took effect in January 2020 and has been amended by the California Privacy Rights Act (the “
CPRA
”) passed via ballot initiative in November 2020 and will fully take effect in January 2023. The CCPA and CPRA, among other things, gives California residents expanded rights to access and delete their personal information, opt out of certain personal information sharing, and receive detailed information about how their personal information is used. Other states and the U.S. Congress have introduced data privacy legislation that may impact our business. Data privacy legislation, amendments and revisions to existing data privacy legislation, and other developments impacting data privacy and data protection may require us to modify our data processing practices and policies, increase the complexity of providing our products and services, and cause us to incur substantial costs in an effort to comply. Failure to comply may lead to significant fines and business interruption and could adversely affect our business, financial condition and results of operations.
 
31

Table of Contents
We are subject to the impact of governmental and other certifications processes and regulations, which could adversely affect our products and our business
We market many solutions that are subject to governmental regulations and certifications before they can be sold. The European Union increasingly regulates the use of our products on agriculture, construction, and other types of machinery. As we develop and enhance features which support automated and autonomous operation of our customer’s products, we are increasingly subject to functional safety regulation. CE certification is required for GNSS receivers and data communications products, which must also conform to the European harmonized GNSS receiver requirements and the radio equipment directive to be sold in the European community. In the future, U.S., European, or other governmental authorities may propose GPS receiver testing and certification for compliance with published GPS signal interface or other specifications. Governmental authorities may also propose other forms of GPS receiver performance standards, which may limit design alternatives, hamper product innovation, or impose additional costs. Some of our products that use integrated radio communication technology require product type certification and some products require an
end-user
to obtain licensing from the FCC and other national authorities for frequency-band usage. Compliance with evolving product regulations in our major markets could require that we redesign our products, cease selling products in certain markets, and increase our costs of product development. An inability to obtain required certifications in a timely manner could adversely affect our ability to bring our products to market and harm our customer relationships. Failure to comply with evolving requirements could result in fines and limitations on sales of our products, which could adversely affect our business, financial condition and results of operations.
Regulations and changes in applicable laws relating to data privacy may increase our expenditures related to compliance efforts or otherwise limit the solutions we can offer, which may harm our business and adversely affect our financial condition.
Our products and solutions enable us to collect, manage and store a wide range of data, such as data related to vehicle tracking and fleet management, including vehicle location and fuel usage, speed and mileage. Some of the data we collect or use in our business is subject to data privacy laws, which are complex and increase our cost of doing business. The U.S. federal government and various state governments have adopted or proposed limitations on the collection, distribution and use of personal information. Many foreign jurisdictions, including the European Union and the United Kingdom, have adopted legislation (including directives or regulations) that increase or change the requirements governing data collection and storage in these jurisdictions. We market our products in over 50 countries, and accordingly, we are subject to many different, and potentially conflicting, privacy laws. If our privacy or data security measures fail to comply, or are perceived to fail to comply, with current or future laws and regulations, we may be subject to litigation, regulatory investigations or other liabilities.
Furthermore, there can be no assurance that our employees, contractors and agents will comply with the policies and procedures we establish regarding data privacy and data security, particularly as we expand our operations through organic growth and acquisitions. While our employees may violate our policies and procedures, the Company remains responsible for, and obligated to implement, policies and procedures and enter into contracts with service providers that require appropriate protection. Any violations could subject us to civil or criminal penalties, including substantial fines or prohibitions on our ability to offer our products in one or more countries, and could also materially damage our reputation, our brand, our international expansion efforts, our business, financial condition and results of operations.
The transmission of data over the Internet and cellular networks is a critical component of our SaaS business model. Additionally, as cloud computing continues to evolve, increased regulation by federal, state or foreign agencies becomes more likely, particularly in the areas of data privacy and data security. In addition, taxation of services provided over the Internet or other charges imposed by government agencies, or by private organizations for accessing the Internet, may be imposed. Any regulation imposing greater fees for Internet use or restricting information exchange over the Internet, could result in a decline in the use of the Internet and the viability of Internet-based services, which could adversely affect our business, financial condition and results of operations.
Our solutions and products enable us to collect, manage and store a wide range of customer data. The United States and various state governments have adopted or proposed limitations on the collection, distribution and use of personal data, as well as requirements that must be followed if a breach of such personal data occurs. The European Union and the United Kingdom have adopted legislation (including directives, national laws and regulations) that increase or change the requirements governing data collection, use, storage and disclosure of personal data in these jurisdictions. The current European Union legislation related to data protection is the General Data Protection Regulation, which came into effect on May 25, 2018. We have updated and will continue to evaluate our group data protection and security policies, charters, and procedures to assist in maintaining data privacy and data security in line with international practices.
 
32

Table of Contents
We may also be subject to costly notification and remediation requirements if we, or a third party, determines that we have been the subject of a data breach involving personal data of individuals. Data breach notification regulations vary among the countries where we conduct business, and also vary among the states of the United States, and any breach of personal data could be subject to any number of these requirements.
As noted above, we have sought to implement internationally recognized practices regarding data privacy and data security. If our privacy or data security measures fail to comply, or are perceived to fail to comply, with current or future laws and regulations, we may be subject to litigation, regulatory investigations or other liabilities. Moreover, if future laws and regulations limit our customers’ ability to use and share this data or our ability to store, process and share data with our customers over the Internet, demand for our solutions could decrease and our costs could increase. We might also have to limit the manner in which we collect data, the types of personal data that we collect, or the solutions we offer. Any of these risks would materially and adversely affect our business, results of operations and financial condition.
Enhanced United States fiscal, tax and trade restrictions and executive and legislative actions could adversely affect our business, financial condition, and results of operations.
There is currently significant uncertainty about the future relationship between the United States and various other countries, most significantly China, with respect to trade policies, treaties, tariffs and taxes. The current and former U.S. administrations have called for substantial changes to U.S. foreign trade policy with respect to China and other countries, including significant new and increased tariffs on goods imported into the United States. In 2018, the Office of the U.S. Trade Representative (the “USTR”) enacted tariffs on imports into the U.S. from China, including communications equipment products and components manufactured and imported from China. The tariff became effective in September 2018, with an initial rate of 10% and was scheduled to increase from 10% to 25% on January 1, 2019. The scheduled increase was delayed until March 2, 2019; however trade negotiations between the U.S. and China continue and the scheduled increase has been further delayed indefinitely. Our business may also be affected by tariffs set by countries into which we sell our products, whether as a response to U.S. foreign trade policy or otherwise. In addition, changes in international trade agreements, regulations, restrictions and tariffs, including new tariffs, may increase our operating costs, reduce our margins and make it more difficult for us to compete in the U.S. and overseas markets, and our business, financial condition and results of operations could be adversely impacted.
In some cases, the U.S. government’s imposition of trade restrictions involving products sold by certain Chinese manufacturers has caused U.S. wireless carriers to divert business from international providers to the Company, and accordingly, the Company has invested resources in satisfying the needs of such customers. If the U.S. government were to remove or reduce such trade restrictions, it could cause such carriers to reduce their business with the Company and we may be unable to recoup or attain a return on such investments.
Risk Related to Financial Reporting
The requirements of being a public company may strain our resources and divert management’s attention, and the increases in legal, accounting, insurance and compliance expenses may be greater than we anticipate.
We are a public company, and as such (and particularly after we are no longer an “emerging growth company”), will incur significant legal, accounting and other expenses that KORE did not incur prior to the Business Combination. We are subject to the reporting requirements of the Exchange Act, and are required to comply with the applicable requirements of the Sarbanes-Oxley Act and the Dodd-Frank Wall Street Reform and Consumer Protection Act, as well as the rules and regulations subsequently implemented by the SEC and the listing standards of The New York Stock Exchange, including changes in corporate governance practices and the establishment and maintenance of effective disclosure and financial controls. Compliance with these rules and regulations can be burdensome. Our management and other personnel need to devote a substantial amount of time to these compliance initiatives. Moreover, these rules and regulations will increase our historical legal and financial compliance costs and will make some activities more time-consuming and costly. For example, we expect that these rules and regulations may make it more difficult and more expensive for us to attract and retain qualified members of our board of directors as compared to KORE prior to the Business Combination as well as significantly more expensive to provide the required insurance. In particular, we expect to incur significant expenses and devote substantial management effort toward ensuring compliance with the requirements of Section 404 of the Sarbanes-Oxley Act, which will increase when we are no longer an “emerging growth company.” We will need to hire additional accounting and financial staff, and engage outside consultants, all with appropriate public company experience and technical accounting knowledge and maintain an internal audit
 
33

Table of Contents
function, which will increase our operating expenses. Moreover, we could incur additional compensation costs in the event that we decide to pay cash compensation closer to that of other public companies, which would increase our general and administrative expenses and could materially and adversely affect our profitability. We are evaluating these rules, regulations and cannot predict or estimate the amount of additional costs we may incur or the timing of such costs.
We were not required to document and test our internal controls over financial reporting nor has our management been required to certify the effectiveness of our internal controls and our auditors have not been required to opine on the effectiveness of our internal control over financial reporting. Failure to maintain adequate financial, information technology and management processes and controls could result in material weaknesses which could lead to errors in our financial reporting, which could adversely affect our business.
We were not required to thoroughly document and test our internal controls over financial reporting nor was our management required to certify the effectiveness of our internal controls and our auditors were not required to opine on the effectiveness of our internal control over financial reporting. We will cease to be an emerging growth company status and become subject to the SEC’s internal control over financial reporting management and auditor attestation requirements upon the earliest to occur of: (i) the last day of the first fiscal year in which our annual gross revenue exceed $1.07 billion; (ii) the date on which we have issued more than $1.0 billion in non-convertible debt securities during the previous three years; (iii) the date on which we are deemed a large accelerated filer under the rules of the SEC, which will occur at such time as we (a) have an aggregate worldwide market value of common equity securities held by non-affiliates of $700 million or more as of the last business day of our most recently completed second quarter, (b) have been required to file annual and quarterly reports under the Exchange Act, for a period of at least 12 months and (c) have filed at least one annual report pursuant to the Exchange Act. Additionally, our independent registered public accounting firm may be required to formally attest to the effectiveness of our internal controls over financial reporting commencing with our second annual report on Form 10-K (
i.e.
, for the year ending December 31, 2022). We may not be able to complete our evaluation, testing and any required remediation in a timely fashion. In addition, our current controls and any new controls that we develop may become inadequate because of poor design and changes in our business, including increased complexity resulting from any international expansion. Any failure to implement and maintain effective internal controls over financial reporting could adversely affect the results of assessments by our independent registered public accounting firm and their attestation reports.
KORE has identified material weaknesses in its internal controls over financial reporting. If remediation of such material weaknesses are not effective, or if we fail to develop and maintain proper and effective internal controls over financial reporting, KORE’s ability to produce timely and accurate financial statements, comply with applicable laws and regulations, or access the capital markets could be impaired.
KORE has identified material weaknesses in its internal controls over financial reporting. If we fail to develop and maintain proper and effective internal controls over financial reporting, KORE’s ability to produce timely and accurate financial statements, comply with applicable laws and regulations, or access the capital markets could be impaired.
As a public company, KORE is actively evaluating its internal control over financial reporting in a manner that meets the standards of publicly traded companies required by Section 404(a) of the Sarbanes-Oxley Act, or Section 404. A material weakness is defined as a deficiency, or combination of deficiencies, in internal control over financial reporting, such that there is a reasonable possibility that a material misstatement of our annual or interim financial statements will not be prevented or detected on a timely basis.
Nevertheless, KORE is ultimately responsible for establishing and maintaining adequate internal control over our financial reporting, as defined in Rule 13a-15(f) under the Securities Exchange Act of 1934. As disclosed in Item 9A, “Controls and Procedures,” management noted several material weaknesses in our internal control over financial reporting as of December 31, 2021.
Refer to “Item 9A. Control and Procedures” for a detailed discussion regarding the material weaknesses identified as well as management’s remediation plans.
We are actively engaged in developing a remediation plan designed to address these material weaknesses, however, we cannot guarantee that these steps will be sufficient or that we will not have material weaknesses in the future. If our remedial measures are insufficient to address the material weaknesses, or if additional material weaknesses in our internal control are discovered or occur in the future, our financial statements may contain material misstatements and we could be required to restate our financial results.
The process of designing and implementing effective internal control over financial reporting is a continuous effort that requires KORE to anticipate and react to changes in its business and the economic and regulatory environments and to expend significant resources to maintain internal controls over financial reporting that are adequate to satisfy our reporting obligations as a public company. The rules governing the standards that must be met for our management to assess our internal control over financial reporting are complex and require significant documentation, testing and possible remediation. Testing and maintaining our internal control over financial reporting may divert KORE management’s attention from other matters that are important to our business.
 
34

Table of Contents
Risks Related to our Common Stock
The price of our securities may be volatile.
The trading price of our securities may fluctuate substantially and may be lower than the price at which you purchase such securities. This may be especially true for companies like ours with a small public float. The trading price of our securities may be volatile and subject to wide fluctuations due to a variety of factors, including:


the success of competitive services or technologies;


developments related to our existing or any future collaborations;


regulatory or legal developments in the United States and other countries;


developments or disputes concerning our intellectual property or other proprietary rights;


the recruitment or departure of key personnel;


actual or anticipated changes in estimates as to financial results, development timelines or recommendations by securities analysts;


variations in our financial results or those of companies that are perceived to be similar to us;


general economic, industry and market conditions; and


the other factors described in this “Risk Factors” section.
These market and industry factors may materially reduce the market price of our common stock regardless of our operating performance.
Future resales of our common stock may cause the market price of our securities to drop significantly, even if our business is doing well.
Pursuant to the Investor Rights Agreements (as defined below), the Sponsor and the KORE stockholders party thereto are contractually restricted from selling or transferring any of its shares of our common stock (the
“Lock-up
Shares”), other than (i) any transfer to an affiliate of a holder, (ii) distribution to profit interest holders or other equity holders in such holder or (iii) as a pledge in a bona fide transaction to third parties as collateral to secure obligations under lending arrangements with third parties. Such restrictions end on the date that is 12 months after the Closing. However, following the expiration of such lockup, the Sponsor and the KORE equity holders party to the Investor Rights Agreement will not be restricted from selling shares of our common stock held by them, other than by applicable securities laws.
As restrictions on resale end, the sale or possibility of sale of these shares could have the effect of increasing the volatility in our share price or the market price of our common stock could decline if the holders of currently restricted shares sell them or are perceived by the market as intending to sell them. In addition, we may issue additional shares of our common stock or other equity securities without the approval of investors, which would reduce investors’ proportionate ownership interests and may depress the market price of our common stock.
We may be subject to securities litigation, which is expensive and could divert management attention.
The market price of our securities may be volatile and, in the past, companies that have experienced volatility in the market price of their securities have been subject to securities class action litigation. We may be the target of this type of litigation in the future. Securities litigation against us could result in substantial costs and divert management’s attention from other business concerns, which could seriously harm our business.
Reports published by analysts, including projections in those reports that differ from our actual results, could adversely affect the price and trading volume of our common stock.
Securities research analysts may establish and publish their own periodic projections for us. These projections may vary widely and may not accurately predict the results we actually achieve. Our share price may decline if its actual results do not match the projections of these securities research analysts. Similarly, if one or more of the analysts who write reports on or downgrades our stock or publishes inaccurate or unfavorable research about our business, our share price could decline. If one or more of these analysts ceases coverage of us or fails to publish reports on us regularly, our securities price or trading volume could decline.
 
35

Table of Contents
We do not intend to pay cash dividends for the foreseeable future.
We currently intend to retain our future earnings, if any, to finance the further development and expansion of our business and do not intend to pay cash dividends in the foreseeable future. Any future determination to pay dividends will be at the discretion of our board of directors and will depend on our financial condition, results of operations, capital requirements and future agreements and financing instruments, business prospects and such other factors as our board of directors deems relevant.
Since we are a holding company, we do not have any independent means of generating revenue other than through our subsidiaries. We intend to cause KORE Wireless to make distributions to us, in an amount at least sufficient to allow us to pay all applicable taxes and our corporate and other overhead expenses. Pursuant to the terms of the Credit Agreement, KORE Wireless is prohibited from declaring or making certain payments in respect of equity interests, subject to certain customary exceptions. We are therefore restricted from declaring or paying any dividend to our stockholders to the extent such dividend is not permitted under the Credit Agreement.
There can be no assurance that we will be able to comply with the continued listing standards of the NYSE.
Our common stock are currently listed on NYSE. If NYSE delists our common stock from trading on its exchange for any reason, we and our stockholders could face significant material adverse consequences including:


a limited availability of market quotations for our securities;


a determination that our common stock is a “penny stock” which will require brokers trading in our common stock to adhere to more stringent rules, possibly resulting in a reduced level of trading activity in the secondary trading market for our common stock;


a limited amount of analyst coverage; and


a decreased ability to issue additional securities or obtain additional financing in the future.
 
ITEM 1B.
UNRESOLVED STAFF COMMENTS
None.
 
ITEM 2.
PROPERTIES
KORE’s corporate headquarters are located in Alpharetta, Georgia (part of the Atlanta Metropolitan Area) and consists of approximately 18,350 square feet of office space. KORE has a key IoT Solutions configuration center located in Rochester, NY. Our Rochester facility holds an FDA Facilities Registration, is
ISO-9001/13485
certified and is HIPAA compliant. KORE believes that its existing properties are in good condition and are sufficient and suitable for the conduct of its business for the foreseeable future. To the extent its needs change as its business grows, KORE expects that additional space and facilities will be available.
 
ITEM 3.
LEGAL PROCEEDINGS
From time to time, the Company is involved in litigation arising out of the ordinary course of our business. There are no material legal proceedings, other than ordinary routine litigation incidental to the business, to which the Company or any of the Company’s subsidiaries are a party or of which any of the Company or the Company’s subsidiaries’ property is subject.
 
ITEM 4.
MINE SAFETY DISCLOSURES
Not applicable.
 
36

Table of Contents
PART II.
 
ITEM 5.
MARKET FOR REGISTRANT’S COMMON EQUITY, RELATED STOCKHOLDER MATTERS AND ISSUER PURCHASES OF EQUITY SECURITIES
Market Information for Common Equity
Our common stock has been listed on the New York Stock Exchange under the symbol “KORE” since October 1, 2021. Prior to that date, there was no public trading market for our common stock.
Holders of Record
As of March 28, 2022, there were approximately 76.2 million shares of our common stock outstanding and 8.9 million warrants to purchase our common stock outstanding, with 79 and 2 holders of record of our common stock and warrants, respectively. The actual number of stockholders is greater than this number of record holders and includes stockholders who are beneficial owners but whose shares are held in “street name” accounts by brokers and other nominees.
Dividend Policy
We have not paid any cash dividends on our common stock to date. The payment of cash dividends in the future will be dependent upon our revenue and earnings, if any, capital requirements and general financial condition. The payment of any cash dividends will be within the discretion of our board of directors. Our ability to declare dividends may be limited by the terms of financing or other agreements entered into by us or our subsidiaries from time to time.
Stock Performance Graph
The following graph depicts the total return to stockholders from the closing price on October 1, 2021 (the date our common stock began trading on NYSE) through December 31, 2021, relative to the performance of the Russell 2000 and the Nasdaq Telecommunications Index. The graph assumes $100 invested on October 1, 2021.
 
The performance graph is not intended to be indicative of future performance. The performance graph shall not be deemed “soliciting material” or to be “filed” with the SEC for purposes of Section 18 of the Exchange Act, or otherwise subject to the liabilities under that Section, and shall not be deemed to be incorporated by reference into any of the Company’s filings under the Securities Act or the Exchange Act.
 
37

Table of Contents
Recent Sales of Unregistered Securities and Use of Proceeds from Registered Securities
(a) Sales of Unregistered Securities
The information required has been previously disclosed in our Quarterly Report on Form 10-Q for the period ended September 30, 2021 filed with the SEC on November 16, 2021 and on our Current Report on Form 8-K filed with the SEC on October 10, 2021.
Issuer Purchases of Equity Securities
None.
 
ITEM 6.
RESERVED
 
ITEM 7.
MANAGEMENT’S DISCUSSION AND ANALYSIS OF FINANCIAL CONDITION AND RESULTS OF OPERATIONS
The following discussion and analysis of the financial condition and results of operations of KORE Group Holdings, Inc. should be read together with our audited consolidated financial statements as of and for the years ended December 31, 2021 and 2020. A detailed discussion comparing our results of operations for the years ended December 31, 2020 and 2019 can be found in “KORE’s Management’s Discussion and Analysis of Financial Condition and Results of Operations,” of our Form
S-4
Registration Statement filed on August 11, 2021. This discussion may contain forward-looking statements based upon current expectations that involve risks and uncertainties. Our actual results may differ materially from those projected in these forward-looking statements as a result of various factors, including those set forth under “Risk Factors”. Unless the context otherwise requires, all references in this section to “the Company” “KORE,” “us,” “our” or “we” refer to Maple Holdings, Inc. prior to the Business Combination, and to KORE Group Holdings, Inc. following the consummation of the Business Combination on September 30, 2021.
Overview
KORE Group Holdings, Inc. is the parent entity of KORE Wireless Group, Inc., its wholly owned and principal operating subsidiary. Both entities are incorporated in Delaware. Our corporate headquarters are located in Alpharetta, Georgia.
KORE simplifies IoT adoption by putting more intelligence into our software and platforms. Our technology stack enables our customers with an easy way to assemble and configure the ‘IoT Building Blocks’ they need to deploy their End Solutions. IoT Building Blocks enable the data journey from the Edge Device to the customer Application, hence driving the solutions and outcomes our customers desire.
KORE is one of the largest global independent IoT companies enabling mission-critical CaaS, or “IoT Connectivity” for reporting purposes, IoT Solutions and Analytics (or simply “IoT Solutions” for reporting purposes) to enterprise customers across five key industry verticals, comprising (i) Connected Health, (ii) Fleet Management, (iii) Asset Monitoring, (iv) Communications Services and (v) Industrial IoT (or “IIoT”).
Example customer use cases across our five key verticals are illustrated below:


Connected Health
: Remote patient monitoring and telemedicine enabled by connected medical devices, IoT device enabled clinical drug trials, mPERS connected emergency devices, connected medical equipment diagnostics, electronic visit verification.


Fleet Management
: Stolen vehicle recovery location tracking, connected cameras for tracking vehicle driving conditions and driver behavior, connected route optimization, fuel consumption optimization, connected preventive maintenance, usage-based insurance, connected cars.


Asset Monitoring
: Home/business security sensor and camera solutions, offender tracking through ankle bracelets, tank monitoring, supply chain inventory and asset tracking, fuel pipeline flow monitoring.


Communication Services:
IoT and consumer service providers, carrier IoT business units, enterprise connectivity / failsafe, private networking—we may provide Connectivity Enablement as a Service for some of these customers.


Industrial IoT:
Smart utilities / meters, smart cities / buildings, smart factories, field service automation, manufacturers of smart or connected products providing global connectivity to devices across the globe, over different networks and protocols is a highly complex undertaking.
 
38

Table of Contents
KORE’s portfolio of IoT connectivity services capabilities, proprietary technology and IP stack, combined with its vast network of 44 carrier integrations globally enables the Company to be a market leader in working with enterprise customers. Apart from basic IoT connectivity services, we also provide connectivity enablement services to enable other service providers to provide IoT connectivity.
Successful deployment of IoT Solutions is extremely complex; notably, some of the significant challenges in IoT deployment include:


Lack of readily available
in-house
IoT resources and expertise;


Significant time required to get to market;


High failure rate of IoT initiatives;


A highly fragmented vendor landscape;


An ecosystem that is quickly evolving and changing rapidly;


Substantial and increasing regulatory/compliance issues;


Interoperability and compatibility with assorted technologies.
Through early 2018, KORE has been executing a multi-year strategic transformation program to transform from a ‘connectivity only’ player to a market leading, global enabler of IoT providing IoT Connectivity, IoT Solutions and Analytics. The elements of this transformation program are building the core technology platform of the future ‘KORE One
’, building IoT Solutions products and a strategic repositioning of the Company in the market including strategic M&A. This multi-year strategic transformation program is expected to be complete by end of 2023. As a result of this transformation program:


We believe KORE One is now an industry leading platform for IoT subscription and network management, and which provides us with a competitive edge in the market.


Amongst industry analysts, KORE has continued to establish and improve its position as the only pure play IoT enabler. Recognized in 2019 by Gartner as the only independent service provider to be named a “Leader” in the Magic Quadrant for Managed IoT Connectivity Services, KORE continued its upward momentum in 2020 as it improved upon its position to be ranked among the top global services providers within the same category.


KORE’s product portfolio has expanded significantly. A few years ago, KORE was primarily IoT Connectivity Services focused while today its product portfolio includes IoT Solutions such as IoT Deployment Services and Security Software and Services. KORE’s IoT Connectivity Services have also become richer through the addition of the eSIMs and “Connectivity Enablement as a Service” to the IoT Connectivity Services product portfolio.


IoT Solutions has increased as a proportion of KORE’s total revenue each year since 2018. For the years ended December 31, 2021, and 2020, respectively, IoT Solutions represented 32% and 26% of KORE’s total revenue.
KORE’s IoT and analytics solutions include IoT device management services, IoT location-based services software, and IoT device security services software for the
Machine-to-Machine
market.
Customers of KORE’s products include fleet owners and transportation companies, fleet management software providers, healthcare companies including healthcare device manufacturers, healthcare payors and healthcare contract research organizations, telecommunications service providers, manufacturers and industrial automation providers, application service providers and enterprises in various other industries, including consumer electronic devices, retail, home and office security and safety etc. KORE’s largest customers include Fortune 500 enterprises and innovative solution providers across multiple high growth vertical markets.
KORE’s products compete with a variety of solutions, including other subscription-based IoT platforms and solutions. Our current competitors include:


For IoT Connectivity
—telecom carriers such as T-Mobile and Vodafone; Mobile Virtual Network Operators such as Aeris and Wireless Logic; and


For IoT Solutions and Analytics
—device management services providers such as Velocitor and Futura, fleet management SaaS providers such as Fleetmatics and GPS Trakit, and analytics services providers such as Galooli and Intellisite. KORE has made several key acquisitions that have enhanced solutions to new and existing customers.
 
39

Table of Contents
Trends Affecting Our Business
All of the markets in which we operate are characterized by rapid technological change, frequent introductions of new products, services and solutions and evolving customer demands. We expect our market to be competitive especially with the focus on IoT with the development and deployment of 5G technologies. In addition, we are affected by changes in the many industries related to the products or services we offer, including the fleet management, connected biomedical devices and home security industries. As the technologies used in each of these industries evolves, we will face new integration and competition challenges.
Our ability to expand our business through new solutions and penetration into new sectors.
The success of our business depends, in part, on our ability to maintain and protect our proprietary technologies, information, processes and
know-how.
We rely primarily on trademark, copyright, trade secret and other intellectual property laws in the U.S. and similar laws in other countries, confidentiality agreements and procedures and other contractual arrangements to protect our technology. The growing number of IoT, eSIM and 5G use cases presents opportunity for us to deliver critical solutions in these rapidly growing industries. We expect that product offerings such as the highly scalable KORE One platform and the growth of eSIMs will position us for growth in the connectivity market.
Our growth strategy consists of the following:


Organic volume growth – leveraging the strong IoT industry growth expressed in terms of our customers’ revenue, device and data usage growth, while continuing to maintain high customer retention.


Cross-sell and upsell – selling KORE’s growing portfolio of IoT Solutions developed during the prior two years and going-forward, to our large base of connectivity services only customers.


Deepening our presence in focused industry sectors – developing more of a vertical orientation in our business and deepening industry domain knowledge that will in turn allow the development and deployment of
pre-configured
industry solutions.


Enhancing AIoT (Artificial Intelligence + IoT) and Edge Analytics capabilities.


Strategic acquisitions that will allow KORE to expand our IoT Solutions and advanced IoT connectivity capabilities while ensuring a highly disciplined use of capital for such acquisitions.
We operate in a highly competitive market.
The market for KORE’s products and solutions is rapidly evolving and highly competitive. It is likely to continue to be affected by new product introductions and industry participants. The unique expertise required to design its product offerings and customers’ reluctance to try unproven products has confined the number of competing firms to a relatively small number.
KORE competes in the IoT connectivity market on the basis of the following factors:


The number of carrier integrations (44)


KORE One platform (7 engines)


ConnectivityPro service and related APIs


eSIM technology stack/ proprietary IP


Hypercore technology
KORE competes in the IoT Solutions market on the basis of the following factors:


Deep industry vertical knowledge and experience (e.g., in Connected Health through FDA, HIPAA, ISO 9001/13485 compliance)


Breadth of solutions and analytics services


3,300+ connectivity-only customers provides us a unique opportunity to cross-sell and upsell our existing connectivity-only customers
While the abovementioned factors provide KORE with certain competitive advantages, KORE’s market is highly competitive, and we expect it to continue to be so especially with the greater focus on the IoT market through the development and deployment of 5G technologies.
 
40

Table of Contents
Impact of transitions of IoT connections from 2G/3G to LTE.
In the United States, the major carriers have announced intentions to phase out their 2G and 3G networks by the end of 2022 which will result in carriers migrating customers onto LTE platforms. While we expect customers to experience increased customer satisfaction from the migration onto superior LTE platforms, the rate plans under these platforms are typically lower in price than legacy 2G and 3G rate plans. As a result, the phase out of 2G and 3G may result in lower revenue per unit and/or lower revenue to KORE. While KORE has strong relationships with many of the affected customers and expects to retain most of the connections which will not be retired on 4G or 5G technologies, some of these connections may be lost as a result of competitive bidding processes. The projected impact of this is incorporated in KORE’s projections.
Business Combination
On March 12, 2021, KORE entered into a definitive merger agreement with CTAC, a special purpose acquisition company affiliated with Cerberus Capital Management, L.P. On September 30, 2021, as contemplated by the Merger Agreement, (i) CTAC merged with and into LLC Merger Sub (the “Pubco Merger”), with LLC Merger Sub being the surviving entity of the Pubco Merger and Pubco as parent of the surviving entity, (ii) immediately prior to the First Merger (as defined below), Cerberus Telecom Acquisition Holdings, LLC (the “Sponsor”) contributed 100% of its equity interests in Corp Merger Sub to Pubco (the “Corp Merger Sub Contribution”), as a result of which Corp Merger Sub became a wholly owned subsidiary of Pubco, (iii) following the Corp Merger Sub Contribution, Corp Merger Sub merged with and into KORE (the “First Merger”), with KORE being the surviving corporation of the First Merger, and (iv) immediately following the First Merger and as part of the same overall transaction as the First Merger, KORE merged with and into LLC Merger Sub (the “Second Merger” and, together with the First Merger, being collectively referred to as the “Mergers” and, together with the other transactions contemplated by the Merger Agreement, the “Transactions” and the closing (the “Closing”) of the Transactions, the “Business Combination”), with LLC Merger Sub being the surviving entity of the Second Merger and Pubco being the sole member of LLC Merger Sub. In connection with the Business Combination, Pubco changed its name to “KORE Group Holdings, Inc.”
The most significant change in the post-combination Company’s reported financial position and result was an increase in cash of $63.2 million. We paid $19.0 million in transaction costs relating to the Business Combination at the closing.
Following the Business Combination, the Company trades under the ticker symbol “KORE” on the NYSE. We expect to incur additional annual expenses as a public company for, among other things, directors’ and officers’ liability insurance, director fees and additional internal and external accounting and legal and administrative resources, including increased audit and legal fees.
COVID-19
In March 2020, the World Health Organization declared the outbreak of the COVID-19 a global pandemic, which has resulted in significant disruption and uncertainty in the global economic markets, and which in turn has impacted our business as well as most other businesses. Given the amount of uncertainty currently regarding the scope and duration of the COVID-19 pandemic, we are currently unable to predict the precise impact that COVID-19 pandemic will have on our business, financial condition and results of operations in the future. As of the date of this filing, the Company has experienced certain negative impacts from the pandemic; such as the loss of one major customer and multiple smaller customers that experienced financial distress, resulting in payment delays and a reduction in revenue from those customers. Overall, as of the date of this filing, COVID-19 has not had a significant negative impact on the Company’s results of operations, as evidenced by factors such as continued revenue growth and a decrease in the Company’s bad debt expense for the year ended December 31, 2021 as compared to the year ended December 31, 2020.
We believe COVID-19’s continued impact on our business, financial condition and results of operations will be driven by a number of factors that we are unable to predict or control, including, for example: the severity and duration of the pandemic, including the timing of availability of a treatment or vaccine for COVID-19; the pandemic’s impact on the U.S. and global economies; the timing, scope and effectiveness of additional governmental responses to the pandemic; the timing and path of economic recovery; and the negative impact on our clients, counterparties, vendors and other business partners that may indirectly adversely affect us.
Operating Segments
We have determined that we operate in a single operating and reportable segment, consistent with how our chief operating decision maker (“CODM”) allocates resources and assesses performance.
 
41

Table of Contents
Components of Results of Operations
Revenue
We derive revenue from:
-Services: IoT Connectivity services and IoT Solutions services.
-Products: SIMs (IoT Connectivity) and IoT devices (IoT Solutions).
KORE views our business as being constituted of two services lines: IoT Connectivity and IoT Solutions.
The fees for IoT Connectivity generally consist of a monthly subscription fee and additional data usage fees that are part of a bundled solution which enable other Providers and Enterprise customers to complete their platform for solutions to provide IoT Connectivity. IoT Connectivity also includes charges for each subscriber identity modules (SIMs) sold to a customer.
In IoT Solutions, we derive revenue from IoT device management services, location-based software services and IoT security software services. Fees charged for device management services include the cost of the underlying IoT device and the cost of deploying and managing such devices. Fees charged for device management services are generally billed on a fee per deployed IoT device basis which depends on the scope of the underlying services and the IoT device being deployed. Location based software services and IoT security software services are charged on a
per-subscriber
basis.
Costs and Expenses
Cost of Revenue
Cost of revenue consists primarily of costs associated with IoT Connectivity and those associated with IoT Solutions. IoT Connectivity costs include carrier costs, network operations, technology licenses, and other costs such as shipping a SIM. IoT Solution costs include the cost of devices, shipping costs, warehouse lease and related facilities expenses, and personnel costs. Total cost of revenue excludes depreciation and amortization.
Operating expenses
We incur expenses associated with sales, marketing, customer support, and administrative activities related to the operation of our business, which are generally included as part of selling, general and administrative expenses. We also incur significant charges for depreciation and amortization of our intangible assets (including intangible assets we acquired or developed), other acquired intellectual property, as well as our fixed assets which support the deployment of our IoT Connectivity services and IoT Solutions services. We also incur engineering expenses developing and supporting the operation of our communications systems and the early stage engineering work on new products and services that are not yet determined to be technologically feasible.
Key Metrics
KORE reviews a number of metrics to measure our performance, identify trends affecting our business, prepare financial projections, and make strategic decisions. The calculation of the key metrics and other measures discussed below may differ from other similarly titled metrics used by other companies, securities analysts, or investors.
Number of Connections
Total Connections constitutes the total of all KORE IoT Connectivity services connections, including both CaaS and CEaaS connections, but excluding certain connections where mobile carriers license KORE’s subscription management platform from KORE. Total Connections include the contribution of eSIMs and is the principal measure used by management to assess the performance of the business on a periodic basis.
DBNER
DBNER (Dollar Based Net Expansion Rate) tracks the combined effect of cross-sales of IoT Solutions to KORE’s existing customers, its customer retention and the growth of its existing business. KORE calculates DBNER by dividing the revenue for a given period (“given period”) from existing
go-forward
customers by the revenue from the same customers for the same period measured one year prior (“base period”).
The revenue included in the current period excludes revenue from (i) customers that are non go-forward customers, meaning customers that have either communicated to KORE before the last day of the current period their intention not to provide future business to KORE or customers that KORE has determined are transitioning away from KORE based on a sustained multi-year time period of declines in revenue and (ii) new customers that started generating revenue after the end of the base period. For example, to calculate our DBNER for the trailing 12 months ended December 31, 2021, we divide (i) revenue, for the trailing 12 months ended December 31, 2021, from go-forward customers that started generating revenue on or before December 31, 2020 by (ii) revenue, for the trailing 12 months
 
42

Table of Contents
ended December 31, 2020, from the same cohort of customers. For the purposes of calculating DBNER, if KORE acquires a company during the given period or the base period, then the revenue of a customer before the acquisition but during either the given period or the base period is included in the calculation. Further, it is often difficult to ascertain which customers should be deemed not to be go-forward customers for purposes of calculating DBNER. Customers are not required to give notice of their intention to transition off of the KORE platform, and as discussed above in “Information about KORE—Customer and Key Partners”, a customer’s exit from the KORE platform can take months or longer, and total connections of any particular customer can at any time increase or decrease for any number of reasons, including pricing, customer satisfaction or product fit – accordingly, a decrease in total connections may not indicate that a customer is intending to exit the KORE platform, particularly if that decrease is not sustained over a period of several quarters. DBNER would be lower if it were calculated using revenue from non go-forward customers.
As of December 31, 2021, and 2020, DBNER excludes approximately 0.6 million, 1.1 million connections, respectively, from non go-forward customers, in each case, the vast majority of which are connections from Non-Core Customers.
KORE defines “Non-Core Customers” to be customers that management has judged to be lost as a result of the integration of Raco, Wyless and other acquisitions completed during in the 2014-2017 period, but which continue to have some connections (and account for some revenue) each year with KORE. Non-Core Customers are a subset of non go-forward customers.
DBNER is used by management as a measure of growth at KORE’s existing customers (i.e., “same store” growth). It is not intended to capture the effect of either new customer wins or the declines from non go-forward customers on KORE’s total revenue growth. This is because DBNER excludes new customers which started generating revenue after the base period, and also excludes any customers which are non go-forward customers on the last day of the current period. Revenue increases from new customer wins, and a decline in revenue from non go-forward customers are also important factors in assessing KORE’s revenue growth, but these factors are independent of DBNER.
Results of Operations for the Years ended December 31, 2021 and 2020
Revenue
(in thousands USD)


Years Ended
December 31,
 
  
Change 2021


2021
 
  
2020
 
  
$
 
  
%
 
Services
  
$
187,962
 
  
$
172,845
 
  
$
15,117


9
Products
  
 
60,255


40,915


19,340


47


Total Revenue
  
$
248,217
 
  
$
213,760
 
  
$
34,457


16


Total revenue for the year ended December 31, 2021 increased by $34.5 million, or 16%, to $248.2 million from $213.8 million in 2020.
Services revenue growth
of $15.1 million was driven by the growth in IoT Connectivity services revenue of $10.1 million as well as the growth of IoT Solutions services revenue of $5.0 million. IoT Connectivity services revenue growth of $10.1 million was driven by the organic growth of our existing IoT customers of $20.5 million and new customers acquired of $1.5 million. These increases were offset partially by a decrease of $6.0 million in revenue from Non-Core Customers (customers lost from integration of old acquisitions in 2014-17) and the migration of customers from 2G and 3G technologies to LTE (“Long Term Evolution”) cellular technologies involving a one-time adjustment in price estimated at $6.0 million. Services revenue growth of $5.0 million was due to an increase in product deployments by KORE related to its IoT Solutions. This growth was driven by our largest customer and their LTE transition project.
Products revenue growth
of $19.3 million was driven primarily by an increase in the number of devices deployed by KORE related to its IoT Solutions. Within product revenue, there was a $18.5 million increase driven by our largest customer and their LTE transition project.
 
43

Table of Contents
The table below presents how management views our revenue for the years ended December 31, 2021 and 2020, together with the percentage of total revenue represented by each revenue category:
(in thousands USD)


Years Ended
December 31,
 
  
Change 2021


2021
 
  
2020
 
  
$
 
  
%
 
IoT Connectivity
  
$
168,804
 
  
$
158,748
 
  
$
10,056


6
IoT Solutions
  
 
79,413


55,012


24,401


44


Total Revenue
  
$
248,217
 
  
$
213,760
 
  
$
34,457


16


December 31,


2021
 
  
2020
 
Period End Connections
  
 
14.6 million


11.8 million
 
Average Connections Count for the Period
  
 
13.4 million


10.7 million
 
Total revenue for the year ended December 31, 2021 increased by $34.5 million, or 16%, to $248.2 million from $213.8 million for the year ended December 31, 2020.
IoT Connectivity growth
of $10.0 million, which includes SIM revenue, was driven by the organic growth of our existing IoT customers of $20.5 million as well as $1.5 million from newly acquired customers. These increases were partially offset by $6.0 million from
Non-Core
Customers (customers lost from the integration of old acquisitions in
2014-17)
as well as the migration of customers from 2G and 3G technologies to LTE cellular technologies which resulted in a
one-time
adjustment in price estimated at $6.0 million. Notably, most new IoT Connectivity customers relationships usually start small and often expand significantly in the first 12 to 24 months, depending on the device requiring connectivity in the use case.
KORE grew its total number of connections from 11.8 million on December 31, 2020 to 14.6 million on December 31, 2021, mostly as a result of additional connections from existing customers, which resulted in the growth of KORE IoT Connectivity revenue in the year ended December 31, 2021 with respect to the year ended December 31, 2020.
IoT Solutions growth
of $24.4 million was driven by the organic growth of our Connected Health IoT Solutions. A large portion of the IoT Solutions growth was due the LTE transitions project with our largest customer.
Within IoT Solutions, there was an increase in devices deployed and provided by KORE to its IoT Solutions customers, and a proportionate increase in IoT deployment services revenue associated with each device shipped. Directionally, we expect the growth in IoT Solutions to continue to be driven primarily by an increase in device deployments although actual deployment volumes may vary from quarter to quarter.
For the twelve months ended December 31, 2021, KORE’s DBNER was 122% compared to 106% in the twelve months ended December 31, 2020.
Costs of revenue, exclusive of depreciation and amortization, and gross margins


Years Ended
December 31,
 
  
Change 2021


2021
 
  
2020
 
  
$
 
  
%
 
Cost of services
  
$
69,867
 
  
$
64,520
 
  
$
5,347


8
Cost of products
  
 
52,357


33,410


18,947


57


Total cost of revenue
  
$
122,224
 
  
$
97,930
 
  
$
24,294


25


Years Ended


December 31,
 
Gross margin rate
  
2021
 
 
2020
 
Cost of services
  
 
62.8
 
 
62.7
Cost of products
  
 
13.1
 
 
18.3
Total gross margins
  
 
50.8
 
 
54.2
Total cost of revenue for the year ended December 31, 2021 increased $24.3 million, or 25%, to $122.2 million from $97.9 million for the year ended December 31, 2020.
 
44

Table of Contents
Cost of services
increased by $5.3 million for the year ended December 31, 2021, compared to the year ended December 31, 2020. The increase in the cost of services was primarily driven by increased carrier costs resulting from the growth in IoT Connectivity revenue which was partially offset by the $1.1 million settlement of a disputed amount owed to a Carrier from 2020.
During fiscal 2021, the gross margin percentage of our services business increased nominally compared to the same period in fiscal 2020.
Cost of products
increased $18.9 million for the year ended December 31, 2021, compared to the year ended December 31, 2020. The increase was primarily driven by increases in the cost of devices associated with the growth in IoT Solutions. Notably, in the year ended December 31, 2021, there was an increase in devices deployed by KORE to its Connected Health IoT Solutions customers. Additionally, increased shipping costs during fiscal 2021 as compared to fiscal 2020 contributed the increase in the cost of products.
During fiscal 2021, the gross margin percentage of our products business declined as compared to the same period in fiscal 2020. The decline was mainly due to the large volumes associated with our largest customer’s LTE transition project. To win the large volumes associated with this project, additional
one-time
project-specific discounts were given, which contributed significantly to the decline in gross margins on products. Additionally, increased shipping costs during fiscal 2021 as compared to fiscal 2020 also pressured gross margin percentage on products.
The table below presents how management views our costs of revenue for the years ended December 31, 2021 and 2020, exclusive of depreciation and amortization:
(in thousands USD)


Years Ended


December 31,
 
  
Change 2021
 
Cost of revenue
  
2021
 
  
2020
 
  
$
 
  
%
 
Cost of IoT Connectivity
  
$
66,567
 
  
$
63,706
 
  
$
2,861


4
Cost of IoT Solutions
  
 
55,657


34,224


21,433


63


Total cost of revenue
  
$
122,224
 
  
$
97,930
 
  
$
24,294


25


Years Ended
 
Gross margin rate
  
2021
 
 
2020
 
IoT Connectivity
  
 
60.6
 
 
59.9
IoT Solutions
  
 
29.9
 
 
37.8
Total gross margins
  
 
50.8
 
 
54.2
Total cost of revenue for the year ended December 31, 2021 increased $24.3 million, or 25%, to $122.2 million from $97.9 million for the year ended December 31, 2020.
Cost of IoT Connectivity
increased by $2.9 million for the year ended December 31, 2021, compared to the year ended December 31, 2020. This was driven by increased carrier costs associated with the growth in IoT Connectivity revenue offset by a $1.1 million settlement of a disputed amount owed to a Carrier from 2020. The amount in dispute arose in the normal course of business and did not result in any actual or pending litigation.
During fiscal 2021, the gross margin percentage of IoT Connectivity increased nominally compared to the same period in fiscal 2020.
Cost of IoT Solutions
increased by $21.4 million for the year ended December 31, 2021, compared to the year ended December 31, 2020. This was primarily driven by the increased cost of devices and labor associated with the volume growth in IoT Solutions. Notably, in the year ending December 31, 2021, there was an increase in devices provided and shipped by KORE to its Connected Health IoT Solutions customers. This resulted in an increase in the cost of devices provided and shipped, and a proportionate increase in IoT deployment and device management services revenue associated with each device shipped which also resulted in an increase in the labor and other costs of providing such IoT deployment and device management services.
In fiscal 2021, the gross margin percentage of IoT Solutions declined as compared to the same period last year. The decline was mainly due to the large volumes associated with our largest customer’s LTE transition project. To win the large volumes associated with this project, additional
one-time
project-specific discounts were given, which contributed significantly to the decline in gross margins on IoT Solutions. Additionally, market-wide increases in shipping and labor costs in fiscal 2021 as compared to fiscal 2020 also pressured the gross margins on IoT Solutions.
 
45

Table of Contents
Selling, general and administrative expenses
(in thousands USD )


Years Ended


December 31,
 
  
Change 2021


2021
 
  
2020
 
  
$
 
  
%
 
Selling, general, and administrative
  
$
 91,733
 
  
$
72,883
 
  
$
18,850


26
Selling, general and administrative (SG&A) expenses relate primarily to expenses for general management, sales and marketing, finance, audit and legal fees and general operating expenses. The increase in SG&A expenses for the year ended December 31, 2021, compared to the year ended December 31, 2020, was primarily due to a decreased foreign currency gain of $0.3 million, an increase in salary and benefit related items of $7.2 million, an increase in stock compensation expense of $3.5 million and costs associated with going public of $6.4 million. All other items, which includes marketing, travel, information technology and facilities related items increased $1.4 million.
Depreciation and amortization
(in thousands USD)


Years Ended


December 31,
 
  
Change 2021


2021
 
  
2020
 
  
$
 
  
%
 
Depreciation and amortization
  
$
50,414
 
  
$
52,488
 
  
$
(2,074
  
 
(4
)% 
There were no significant changes in depreciation and amortization expense for the year ended December 31, 2021, compared to the year ended December 31, 2020.
Other (income) expense
(in thousands USD)


Years Ended


December 31,
 
  
Change 2021


2021
 
  
2020
 
  
$
 
  
%
 
Interest expense, including amortization of deferred financing costs, net
  
$
23,260
 
  
$
23,493
 
  
$
(233
  
 
(1
)% 
Change in fair value of warrant liability
  
 
(5,267
  
 
7,485


(12,752
  
 
(170
)% 


Total Other (Income) Expense
  
$
17,993
 
  
$
30,978
 
  
$
(12,985
  
 
(42
)% 


The decrease in other expense for the year ended December 31, 2021, compared to the year ended December 31, 2020, was primarily due to a $12.8 million decrease in expense related to the change in fair value of our warrant liability. Additionally, but insignificantly, our interest expense decreased because of a reduction in LIBOR rates compared to the prior year.
Income taxes
(in thousands USD)


December 31,
 
  
Change 2021


2021
 
  
2020
 
  
$
 
  
%
 
Income tax benefit
  
$
(9,694
  
$
(5,318
  
$
(4,376
  
 
82
For the years ended December 31, 2021 and 2020, we recognized an income tax benefit of $9.7 million and $5.3 million, respectively, in the consolidated statements of operations.
 
46

Table of Contents
The change to the income tax benefit for the year ended December 31, 2021 compared to the income tax benefit for the year ended December 31, 2020 was primarily due to changes in the jurisdictional mix of earnings period over period as well as differences in the deductibility of certain expenses resulting from the Business Combination.
Liquidity and Capital Resources
Overview
Our liquidity requirements arise from our working capital needs, our obligations to make scheduled payments of interest on our indebtedness and our need to fund capital expenditures to support our current operations and to facilitate growth and expansion. We have financed our operations and expansion with a combination of debt and equity.
At December 31, 2021, we had total equity of $272.1 million, net of an accumulated deficit of $(138.2) million. Our primary sources of liquidity consist of cash and cash equivalents totaling $86.0 million and a Revolving Credit Facility of $30.0 million of which the full $30.0 million was available for use for working capital and general business purposes. We believe this will be sufficient to provide working capital, make interest payments and make capital expenditures to support operations and facilitate growth and expansion for the next twelve months.
Our ability to pay dividends on our common stock is limited by restrictions under the terms of agreements governing our indebtedness. Subject to the full terms and conditions under the agreements governing our indebtedness, we may be permitted to make dividends and distributions under such agreements if there is no event of default and certain
pro-forma
financial ratios (as defined by such agreements) are met.
In July 2017, the United Kingdom’s Financial Conduct Authority announced that it would no longer require banks to submit rates for the LIBOR after 2021. In November 2020, the ICE Benchmark Administration (IBA), LIBOR’s administrator, proposed extending the publication of USD LIBOR through June 2023. Subsequently, in March of 2021, IBA stated it will cease publication of certain LIBOR rates after December 31, 2021. USD LIBOR rates that do not cease on December 31, 2021 will continue to be published through June 30, 2023. The Company has reviewed its debt facilities and continues to evaluate commercial contracts that may utilize LIBOR as the reference rate. The Company will continue its assessment and monitor regulatory developments during the transition period.
Cash flows (used in)/provided by from operating activities
For the year ended December 31, 2021, cash used in operating activities was $14.9 million. For the year ended December 31, 2020, cash provided by operating activities was $26.5 million.
For the year ended December 31, 2021, our operating cash flows changed primarily due to increases in accounts receivable and inventories, of $11.9 and $9.9 million, respectively to support the growth of the business, as well as $8.2 million of payments to reduce the Company’s outstanding vendor payables. Cash paid for interest decreased by $1.8 million in the year ended December 31, 2021 as compared to the year ended December 31, 2020 due to a lower LIBOR interest rate.
For the year ended December 31, 2020, we also had a net benefit from working capital management, and while accounts receivable and inventories increased to support the growth of the business, these were offset by increased vendor payables. Cash paid for interest decreased by $2.4 million in the year ended December 31, 2020 as compared to the year ended December 31, 2019 due to a lower LIBOR interest rate.
Cash flows from investing activities
Cash used in our investing activities in the year ended December 31, 2021 was $13.1 million resulting primarily from capital expenditures during the period related to technology equipment, software licenses, and internally developed software.
Cash used in our investing activities in 2020 was $11.6 million, resulting primarily from capital expenditures during the period related to technology equipment, software licenses, and internally developed software.
Cash flows from financing activities
Cash provided by our financing activities in the year ended December 31, 2021, was $103.9 million. For the year ended December 31, 2021, our financing cash flows changed primarily due to the net proceeds from the issuance of common stock of $224.0 million, the receipt of approximately $119.6 million proceeds from the Backstop Notes (net of issuance costs), of which $15.4 million was required under US GAAP to be allocated as “equity portion of convertible debt”. These cash inflows were partially offset by the $229.9 million settlement of preferred stock, the $3.2 million repayment of long-term debt and, repayment of related party note of $1.5 million, and payment of capital lease obligations of $1.2 million.
 
47

Table of Contents
Cash used in our financing activities in the year ended December 31, 2020, was $12.7 million, primarily due to repayment of revolving credit facility of $8.3 million, and $3.5 million of term loan principal payments.
Future Liquidity and Capital Resource Requirements
We believe that our existing cash and cash equivalents along with expected cash flows from operating activities and additional funds available under our Revolving Credit Facility, will be sufficient over the next 12 months to provide working capital, cover interest payments on our debt facilities and fund growth initiatives, and capital expenditures.
As of December 31, 2021, the Company has $24.3 million of purchase and lease commitments for the remainder of the 2022 fiscal year. Additionally, as of December 31, 2021, the Company has $3.2 million of scheduled principal payments relating to the UBS term loan for the remainder of the 2022 fiscal year. The Company’s compliance with the term loan from UBS is measured partially based on Consolidated EBIT, a measure of which is shown in “Part II, Item 7. Management’s Discussion and Analysis of Financial Condition and Results of Operations—Non-GAAP Financial Measures” section of the Company’s 10-K.
As of December 31, 2021, the Company has $45.4 million of purchase and lease commitments for the fiscal years 2022 through 2026 and thereafter. We also have scheduled principal payments relating to the UBS term loan of $3.2 million for each of the fiscal years 2022 through 2024, with all outstanding principal due on December 24, 2024. Further, the Company has semi-annual interest payments due on $120 million related to the Backstop Notes. All outstanding principal on the Backstop Notes is due in full in 2028.
From 2022 to 2026, we expect to fund supplier and carrier-related purchase and lease commitments (all of which are costs of operating the business) entirely from cash inflows from our customers. We currently expect that the excess cash flows after paying the abovementioned contractual commitments, as well as other costs of business, such as payroll, costs incurred on suppliers and carrier spend (which is not currently committed contractually in addition to the committed spend), interest and taxes - will be sufficient to meet outstanding debt principal payments from 2022 to 2024.
Our available cash and cash equivalents, together with our results of operations, are expected to be sufficient to meet our operating expenses, debt service payments, capital requirements and other obligations for at least the next 12 months. However, to increase available liquidity or to fund acquisitions or other strategic activities, we may seek additional financing. We have no commitments for any additional financing and have no lines of credit or similar sources of financing, other than the borrowings available under the Credit Facilities, and the Bank Overdraft Facility. We cannot be sure that we can obtain additional financing on favorable terms, if at all, through the issuance of equity securities or the incurrence of additional debt. Additional equity financing may dilute our stockholders, and debt financing, if available, may restrict our ability to repurchase common stock or debt, declare and pay dividends, raise future capital and make acquisitions. If we are unable to obtain additional needed financing, it may prohibit us from refinancing existing indebtedness and making acquisitions, capital expenditures and/or investments, which could materially and adversely affect our business. We may need additional capital to fund future mergers & acquisitions.
Key activities during the years ended December 31, 2021 and 2020 are as follows:


The Company closed the Business Combination on September 30, 2021, resulting in a net increase in cash of $63.2 million and a recapitalization of the Company’s equity structure.


The Company used $14.9 million for the year ended December 31, 2021 and provided $26.5 million of cash flows from operating activities for the year ended December 31, 2020.


The Company’s investment activity used $13.1 million and $11.6 million for the years ended December 31, 2021 and 2020, respectively, resulting primarily from capital expenditures during the period related to technology equipment, software licenses, and internally developed software.


During the year ended December 31, 2021, the Company drew and repaid $25.0 million on its revolving credit facility. During the year ended December 31, 2020, the Company repaid $8.3 million of its revolving credit facility.
Non-GAAP
Financial Measures
In addition to our results determined in accordance with GAAP, we believe the following non-GAAP measures are useful in evaluating our operational performance. We use the following non-GAAP financial information to evaluate our ongoing operations and for internal planning and forecasting purposes. We believe that non-GAAP financial
 
48

Table of Contents
information, when taken collectively, may be helpful to investors in assessing our operating performance. Non-GAAP financial information is presented for supplemental informational purposes only, should not be considered a substitute for financial information presented in accordance with generally accepted accounting principles, and may be different from similarly-titled non-GAAP measures used by other companies.
EBITDA and Adjusted EBITDA
“EBITDA” is defined as net income (loss) before other non-operating expense or income, income tax expense or benefit, and depreciation and amortization. “Adjusted EBITDA” is defined as EBITDA adjusted for unusual and other significant items that management views as distorting the operating results from period to period. Such adjustments may include stock-based compensation, integration and acquisition-related charges, tangible and intangible asset impairment charges, certain contingent liability reversals, transformation, and foreign currency transaction gains and losses. EBITDA and Adjusted EBITDA are intended as supplemental measures of our performance that are neither required by, nor presented in accordance with, GAAP. We believe that the use of EBITDA and Adjusted EBITDA provides an additional tool for investors to use in evaluating ongoing operating results and trends and in comparing the Company’s financial measures with those of comparable companies, which may present similar non-GAAP financial measures to investors. However, you should be aware that when evaluating EBITDA and Adjusted EBITDA we may incur future expenses similar to those excluded when calculating these measures. In addition, our presentation of these measures should not be construed as an inference that our future results will be unaffected by unusual or non-recurring items. Our computation of Adjusted EBITDA may not be comparable to other similarly titled measures computed by other companies, because all companies may not calculate Adjusted EBITDA in the same fashion.
Because of these limitations, EBITDA and Adjusted EBITDA should not be considered in isolation or as a substitute for performance measures calculated in accordance with GAAP. We compensate for these limitations by relying primarily on our GAAP results and using EBITDA and Adjusted EBITDA on a supplemental basis. You should review the reconciliation of net loss to EBITDA and Adjusted EBITDA below and not rely on any single financial measure to evaluate our business.
The following table reconciles net loss to EBITDA and Adjusted EBITDA for the periods shown:
(in thousands USD)


For the Years Ended December 31,


2021
 
  
2020
 
Net loss
  
$
(24,453
  
$
(35,201
Income tax expense (benefit)
  
 
(9,694
  
 
(5,318
Interest expense
  
 
23,260


23,493
 
Depreciation and amortization
  
 
50,414


52,488
 
EBITDA
  
 
39,527


35,462
 
Change in Fair value of warrant liabilities (non-cash)
  
 
(5,267
  
 
7,485
 
Transformation expenses
  
 
8,937


7,354
 
Acquisition and integration-related restructuring costs
  
 
11,287


5,709
 
Stock-based compensation
(non-cash)
  
 
4,564


1,161
 
Other income tax liability reversal
(non-cash)
  
 
—  


80
 
Foreign currency loss
(non-cash)
  
 
344


233
 
Other
  
 
478


335


Adjusted EBITDA
  
$
59,870
 
  
$
57,819


Transformation expenses are related to the implementation of our strategic transformation plan, which include the costs of a re-write of our core technology platform, expenses incurred to design certain new IoT Solutions and “go-to-market” capabilities.
Acquisition and integration-related restructuring costs for the years ended December 31, 2021 and 2020 relate to legal, accounting, advisory, and other professional services costs associated with the Integron Acquisition and Integron’s integration into KORE, certain synergies related to our acquisitions, certain
one-time
severance costs associated with our transformation, and accounting and advisory fees related to the Business Combination. The Business Combination is the primary driver of the increase in acquisition and integration-related restructuring costs period over period.
 
49

Table of Contents
Concentration of Credit Risk and
Off-Balance
Sheet Arrangements
Cash and cash equivalents are financial instruments that are potentially subject to concentrations of credit risk. The Company’s cash and cash equivalents are deposited in accounts at large financial institutions, and amounts may exceed federally insured limits. The Company believes it is not exposed to significant credit risk due to the financial strength of the depository institutions in which the cash and cash equivalents are held.
The Company has a total of $45.4 million of purchase and lease commitments payable that are not recorded as liabilities on the balance sheet as of December 31, 2021. Additionally, the Company has a $0.4 million standby letter of credit and bank guarantees as of December 31, 2021. The Company has no other financial instruments or commitments with
off-balance-sheet
risk of loss.
Critical Accounting Policies and Estimates
Our discussion and analysis of our results of operations, liquidity and capital resources are based on our consolidated financial statements which have been prepared in conformity with GAAP. The preparation of these financial statements requires us to make estimates and assumptions that affect the reported amounts of assets and liabilities and the disclosure of contingent assets and liabilities as of the date of the financial statements, as well as the reported expenses incurred during the reporting periods. Our estimates are based on our historical experience and on various other factors that we believe are reasonable under the circumstances, the results of which form the basis for making judgments about the carrying value of assets and liabilities that are not readily apparent from other sources.
Actual results may differ from these estimates under different assumptions or conditions. We believe that the accounting policies discussed below are critical to understanding our historical and future performance, as these policies relate to the more significant areas involving management’s judgments and estimates.
While our significant accounting policies are described in the notes to our consolidated financial statements, we believe that the following accounting policies are most critical to understanding our financial condition and historical and future results of operations:
Revenue Recognition
We derive revenue primarily from IoT Connectivity and IoT Solutions. IoT Connectivity arrangements provide customers with secure and reliable wireless connectivity to mobile and fixed devices through various mobile network carriers. Revenue from IoT Connectivity consists of monthly recurring charges (“
MRC’s
”) and overage/usage charges, and contracts are generally short-term in nature (
i.e.
, month-to-month arrangements). Customers generally may cancel with 30 days’ notice without substantive cost or fees. Revenue for MRC’s and overage/usage charges are recognized over time as the Company satisfies the performance obligation (generally starting when an enrolled device is activated on the Company’s platform). MRC’s are billed monthly in advance (generally in the last week of a month); any amounts billed for which the service has not been provided as of the balance sheet dates are reported as a contract liability and components of deferred revenue. Overage/usage charges are billed in arrears on a monthly cycle. Overage/usage charges are evaluated on a monthly basis, and any overage/usage charges determined by management as unlikely to be collected due to a customer disputing the charge or due to a concession are reserved. Reserved items are written off when deemed uncollectible or recognized as revenue if collected. Certain IoT Connectivity customers also have the option to purchase products and/or equipment (
e.g.
, subscriber identification module or “SIM” cards, routers, phones, or tablets) from us on an as needed basis. Sales of products IoT Connectivity customers are recognized when control is transferred to the customer, which is typically upon shipment of the product.
IoT Solutions arrangements includes device solutions (including connectivity), deployment services, and/or technology-related professional services. We evaluate each IoT Solutions arrangement to determine the contract for accounting purposes. If a contract contains more than one performance obligation, we allocate consideration to each performance obligation based on the standalone selling prices of each performance obligation. Standalone selling prices are based on analyses performed by management based on readily observable prices or utilizing a cost-plus-margin approach if prices are not observable. Hardware, deployment services, and connectivity services generally have readily observable prices. The standalone selling price of our warehouse management services (which is associated with our bill-and-hold inventory and determined to be immaterial as discussed below) was determined using a cost-plus-margin approach with the primary assumptions including Company profit objectives, internal cost structure, and current market trends. Device and other hardware sales in IoT Solutions arrangements are generally accounted for as separate contracts since the customer is not obligated to purchase additional services when committing to the purchase of any products. Such sales are typically recognized upon shipment to the customer. However, in certain contracts, the customer has requested us to hold the products ordered for later shipment to the customer’s remote location or to the customer’s end user as a part of a vendor managed inventory model. In these situations, we have concluded that transfer of control to the customer occurs prior to shipment. In these “bill-and-hold” arrangements, the right to invoice, transfer of legal title and transfer of the risk and rewards associated with the products occurs when we receive the hardware from a
 
50

Table of Contents
third-party vendor and have deemed it to be functional. Additionally, the products are identified both physically and systematically as belonging to a specific customer, are usable by the customer, and are only shipped, used, or disposed as directed by the specific customer. Based on these factors, we recognize revenue on
bill-and-hold
hardware when the hardware is received by us and deemed functional.
Deployment services consist of us preparing hardware owned by a customer for use by a customer’s end user. Deployment and connectivity may both be included within a single IoT Solutions contract and are considered separate performance obligations. While consideration for deployment services is generally fixed when ordered by the client, consideration for connectivity services is variable and solely related to the connectivity services. Therefore, the fixed consideration is allocated to the deployment services and is recognized as revenue when the services are provided (
i.e.
, when the related hardware is shipped to the customer). Connectivity within IoT Solutions contracts are recognized similar to the IoT Connectivity as described above, since such contracts are generally short term in nature and variability is resolved each month as the services are provided.
Professional services are generally provided over a contract term of one to two months. Revenue is recognized over time on an input method basis (typically, based on hours completed to date and an estimate of total hours to complete the project).
Accounting for Business Combinations
We account for acquired businesses using the acquisition method of accounting, which requires that assets acquired and liabilities assumed be recorded at their respective fair values on the date of acquisition. We assign fair value of the consideration paid to the underlying net assets of the acquired business based on their respective fair values. Any excess of the purchase price over the estimated fair values of the net assets acquired is recorded to goodwill. Intangible assets are amortized over the expected life of the asset. We recognize acquisition-related expenses and restructuring costs separately from the business combination and expense as incurred. All changes in accounting for deferred tax asset valuation allowances and acquired income tax uncertainties after the measurement period are recognized as a component of provision for income taxes. We make significant assumptions and estimates in determining the preliminary estimated purchase price and the preliminary allocation of the estimated purchase in the consolidated financial statements. These preliminary estimates and assumptions are subject to change as we finalize the valuations. The final valuations may change significantly from the preliminary estimates. Fair value determinations and useful life estimates are based on, among other factors, estimates of expected future cash flows from revenue of the intangible assets acquired, estimates of appropriate discount rates used to calculate the present value of expected future cash flows, estimated useful lives of the intangible assets acquired, customer attrition rates, future changes in technology and brand awareness, and other factors. Although we believe the assumptions and estimates we have made have been reasonable and appropriate, they are based, in part, on historical experience, information obtained from the management of the acquired companies and future expectations. For these and other reasons, actual results may vary significantly from estimated results. During the preliminary purchase price measurement period, which may be up to one year from the business combination date, we will record adjustments to the provisional amounts recognized at the acquisition date to reflect new information obtained about facts and circumstances that existed as of the acquisition date, with a corresponding offset to goodwill. After the preliminary purchase price measurement period, we will record adjustments to assets acquired or liabilities assumed subsequent to the purchase price measurement period in our operating results in the period in which the adjustments were determined.
Internal Use Software
Certain costs of platform and software applications developed for internal use are capitalized as intangible assets. Capitalization of costs begins when two criteria are met: (i) the preliminary project stage is completed (
i.e.
, application development stage) and (ii) it is probable that the software will be completed and used for its intended function. The Company also capitalizes costs related to specific upgrades and enhancements when it is probable the expenditures will result in additional functionality. Costs incurred for maintenance, minor upgrades and enhancements are recorded under selling, general and administrative expense in the consolidated statement of operations as incurred. Costs related to preliminary project activities and postimplementation operating activities are also recorded under selling, general and administrative expense in the consolidated statement of operations as incurred. The Company amortizes the capitalized costs on a straight-line basis over the useful life of the asset. The average useful life for capitalized internal use computer software is between 3-5 years. Capitalized internal use computer software, net of accumulated amortization, was $25.2 million and $23.2 million as of December 31, 2021 and 2020, respectively, and was included in intangible assets.
Intangible Assets
Identifiable intangible assets acquired individually or as part of a group of other assets are initially recognized and measured at cost. The cost of a group of intangible assets acquired in a transaction, including those acquired in a business combination that meet the specified criteria for recognition apart from goodwill, is the sum of the individual assets acquired based on their acquisition date fair values. The cost incurred to enhance the service potential of an intangible asset is capitalized as a betterment.
 
51

Table of Contents
Identifiable intangible assets comprise assets that have a definite life. Customer relationship intangibles are amortized on an accelerated basis and the other intangible assets are amortized on a straight-line basis over their estimated useful lives as follows:
 
Customer Relationships
  
10-13 years
Technology
  
5-9
years
Carrier Contracts
  
10 years
Trademarks
  
9-10
years
Non-compete
agreements
  
3 years
Internally developed and computer acquired software
  
3-5
years
As of December 31, 2021 and December 31, 2020, the Company determined that there were no indicators of impairment and did not recognize any impairment of its intangible assets.
Goodwill
Goodwill is not amortized but tested for impairment on an annual basis and between annual tests whenever events or changes in circumstances indicate that the carrying amount may not be recoverable. Goodwill is tested for impairment at the reporting unit level, which is defined as an operating segment, or one level below the operating segment. We operate in one operating segment, which is our only reporting unit.
We test for an indication of goodwill impairment on October 1st of each year or when indicators of impairment exist. A significant amount of judgment is involved in determining if an indicator of impairment has occurred. We perform a qualitative assessment to determine whether the existence of events or circumstances leads to a determination that it is more likely than not the fair value of the reporting units is less than its carrying amount. Qualitative factors that we consider include macroeconomics conditions such as geographical location and fluctuations in foreign exchange, industry and market conditions, financial performance, a significant adverse change in legal factors or in the business climate, unanticipated competition, entity-specific events and share price trends. If, based on the evaluation, we determine that the fair value of the reporting unit is less than the carrying value, then an impairment loss is recognized in an amount equal to that excess, limited to the total amount of goodwill allocated to that reporting unit. Under a quantitative test, we obtain a third-party valuation of the fair value of the reporting unit. Assumptions we use in the fair value calculation include revenue growth and profitability, terminal values, discount rates, and implied control premium. Impairments, if any, are recorded to the statement of operations in the period the impairment is recognized. As of October 1, 2021, and December 31, 2020, the Company determined there were no indicators of impairment and we did not recognize any impairment of our goodwill.
Income Taxes
We account for income taxes using the asset and liability method. Under this method, deferred tax assets and liabilities are recognized for the future tax consequences of temporary differences between the carrying amounts and tax bases of assets and liabilities using enacted rates. The effect of a change in tax rates on deferred taxes is recognized in income in the period that includes the enactment date.
We recognize the financial statement effect of an uncertain income tax position when it is more likely than not, based on the technical merits, that the position will be sustained upon examination. Recognized income tax positions are measured at the largest amount that is greater than 50% likely to be realized. A valuation allowance is recorded to reduce deferred income tax assets to an amount, which in the opinion of management is more likely than not to be realized.
Management judgment is required in determining our provision for income taxes, our deferred tax assets and liabilities, and any valuation allowance recorded against our deferred tax assets. We consider factors such as the cumulative income or loss in recent years; reversal of deferred tax liabilities; projected future taxable income exclusive of temporary differences; the character of the income tax asset, including income tax positions; tax planning strategies and the period over which we expect the deferred tax assets to be recovered in the determination of the valuation allowance. In the event that actual results differ from these estimates or we adjust our estimates in the future, we may need to adjust our valuation allowance, which could materially impact our financial position and results of operations.
 
52

Table of Contents
Stock Based Compensation
Our share-based compensation plans consist of the 2014 Equity Incentive Plan (the “2014 Plan”), under which the board is authorized to grant stock options to eligible employees, and directors of the Company and the 2021 Incentive Award Plan (“2021 Plan”), under which the board is authorized to grant stock options and restricted stock units. See “Note 14—Stock Based Compensation” in our accompanying consolidated financial statements for information on the Plan and related stock options.
We use the Black-Scholes valuation model to estimate the fair value of each option award on the date of grant, which uses assumptions for expected volatility, expected dividends, expected term, and the risk-free interest rate. We expense the fair value of the option awards on a straight-line basis over the requisite service period and have elected to account for forfeitures as they occur.
Recent accounting pronouncements
As an emerging growth company (“
EGC
”), the JOBS Act allows the Company to delay adoption of new or revised accounting pronouncements applicable to public companies until such pronouncements are applicable to private companies. The Company has elected to use this extended transition period under the JOBS Act until such time the Company is no longer considered to be an EGC.
See Note 2 to the accompanying consolidated financial statements for more information about recent accounting pronouncements, the timing of their adoption, and our assessment, to the extent we have made one, of their potential impact on our financial condition and our results of operations.
 
53

Table of Contents
ITEM 7A.
QUANTITATIVE AND QUALITATIVE DISCLOSURES ABOUT MARKET RISK
Quantitative and Qualitative Disclosures About Market Risk
We are exposed to certain market risks in the ordinary course of business, including sensitivities as follows:
Interest Rate Risk
As of December 31, 2021, and 2020, we had cash and cash equivalents of $86.0 million and $10.3 million, respectively, and restricted cash of $0.4 million and $0.4 million. Cash and cash equivalents consist of highly liquid instruments with an original maturity of less than 90 days or the ability to redeem amounts on demand. Restricted cash consist primarily of cash deposits held with financial institutions for letters of credit and is not available for general corporate purposes. The cash and cash equivalents are held for working capital purposes. Due to the short-term nature of our investments, we have not been exposed to, nor do we anticipate being exposed to, material risks due to changes in interest rates. We estimate a 100 basis- point change in interest rates during any of the periods presented would not have had a material impact on our interest income on an annualized basis.
We are subject to risk from fluctuations in the interest rates related to our long-term debt. The interest rates are based upon the applicable LIBOR rate plus an applicable margin for such loans or the lender’s base rate plus an applicable margin for such loans. Based on December 31, 2021 estimated LIBOR rates, we estimate a 100 basis point change in the LIBOR rate would have a $3.1 million impact on our interest expense on an annualized basis. Based on December 31, 2020 estimated LIBOR rates, we estimate a 100 basis- point change in the LIBOR rate would have a $3.1 million impact on our interest expense on an annualized basis.
Exchange Rate Risk
Our reporting currency is the U.S. dollar, although we transact business in various foreign locations and currencies. The functional currency of the Company’s foreign subsidiaries is generally the local currency. As a result, their reported financial results could be significantly affected by changes in foreign currency exchange rates upon translation to U.S. dollars. When the U.S. dollar strengthens against other currencies, the translated value of the foreign functional currency income and expense amounts results in lower net income (or higher net loss). When the U.S. dollar weakens, the translated value of the foreign functional currency income and expense amounts results in higher net income (or lower net loss). Our reported results are therefore adversely affected by a stronger U.S. dollar relative to major currencies worldwide when foreign operations are net profitable.
During the year ended December 31, 2021, we recognized net loss of $16.6 million from operations located outside the U.S., virtually all of which was originally accounted for in currencies other than the U.S. dollar. Upon translation into U.S. dollars, such reported net loss would have increased or decreased, assuming a hypothetical 10% change in weighted-average foreign currency exchange rates against the U.S. dollar, by approximately $1.7 million.
Similarly, during the year ended December 31, 2020, we recognized net loss of $16.1 million from operations located outside the U.S., virtually all of which was originally accounted for in currencies other than the U.S. dollar. Upon translation into U.S. dollars, such reported net loss would have increased or decreased, assuming a hypothetical 10% change in weighted-average foreign currency exchange rates against the U.S. dollar, by approximately $1.6 million.
 
54

Table of Contents
ITEM 8.
FINANCIAL
STATEMENTS AND SUPPLEMENTARY DATA
INDEX TO CONSOLIDATED FINANCIAL
STATEMENTS


56


57


59


60


61


62


64


95


95
 
 
55

Table of Contents
Report of Independent Registered Public Accounting Firm
Shareholders and Board of Directors
KORE Group Holdings, Inc.
Alpharetta, Georgia
Opinion on the Consolidated Financial Statements
We have audited the accompanying consolidated balance sheets of KORE Group Holdings, Inc. (the “Company”) as of December 31, 2021 and 2020, the related consolidated statements of operations, comprehensive loss, temporary equity and stockholders’ equity, and cash flows for each of the three years in the period ended December 31, 2021, and the related notes and schedule (collectively referred to as the “consolidated financial statements”). In our opinion, the consolidated financial statements present fairly, in all material respects, the financial position of the Company at December 31, 2021 and 2020, and the results of its operations and its cash flows for each of the three years in the period ended December 31, 2021
,
in conformity with accounting principles generally accepted in the United States of America.
Basis for Opinion
These consolidated financial statements are the responsibility of the Company’s management. Our responsibility is to express an opinion on the Company’s consolidated financial statements based on our audits. We are a public accounting firm registered with the Public Company Accounting Oversight Board (United States) (“PCAOB”) and are required to be independent with respect to the Company in accordance with the U.S. federal securities laws and the applicable rules and regulations of the Securities and Exchange Commission and the PCAOB.
We conducted our audits in accordance with the standards of the PCAOB. Those standards require that we plan and perform the audit to obtain reasonable assurance about whether the consolidated financial statements are free of material misstatement, whether due to error or fraud. The Company is not required to have, nor were we engaged to perform, an audit of its internal control over financial reporting. As part of our audits we are required to obtain an understanding of internal control over financial reporting but not for the purpose of expressing an opinion on the effectiveness of the Company’s internal control over financial reporting. Accordingly, we express no such opinion.
Our audits included performing procedures to assess the risks of material misstatement of the consolidated financial statements, whether due to error or fraud, and performing procedures that respond to those risks. Such procedures included examining, on a test basis, evidence regarding the amounts and disclosures in the consolidated financial statements. Our audits also included evaluating the accounting principles used and significant estimates made by management, as well as evaluating the overall presentation of the consolidated financial statements. We believe that our audits provide a reasonable basis for our opinion.
/s/ BDO USA, LLP
We have served as the Company’s auditor since 2019.
Atlanta, Georgia
March 29, 2022
 
56

Table of Contents
KORE Group Holdings, Inc. and Subsidiaries
Consolidated Balance Sheets
(In thousands USD, except share and per share amounts)


December 31,
 
  
December 31,


2021
 
  
2020
 
Assets


Current assets


Cash and cash equivalents
  
$
85,976
 
  
$
10,321
 
Accounts receivable, net of allowances for credits and doubtful accounts of $1,800 and $2,804, at December 31, 2021, and 2020, respectively
  
 
51,304


40,661
 
Inventories, net
  
 
15,470


5,842
 
Income taxes receivable
  
 
954


Prepaid expenses and other receivables
  
 
7,448


5,429


Total current assets
  
 
161,152


62,253
 
Non-current
assets


Restricted cash
  
 
367


372
 
Property and equipment, net
  
 
12,240


13,709
 
Intangibles assets, net
  
 
203,474


240,203
 
Goodwill
  
 
381,962


382,749
 
Deferred tax assets


122
 
Other long-term assets
  
 
407


611


Total assets
  
$
759,602
 
  
$
700,019


Liabilities, temporary equity and stockholders’ equity


Current liabilities


Accounts payable
  
$
16,004
 
  
$
22,978
 
Accrued liabilities
  
 
21,311


17,209
 
Income taxes payable
  
 
467


244
 
Current portion of capital lease obligations
  
 
191


856
 
Deferred revenue
  
 
6,889


7,772
 
Current portion of long-term debt and other borrowings, net
  
 
3,326


3,161


Total current liabilities
  
 
48,188


52,220
 
Non-current
liabilities


Deferred tax liabilities
  
 
36,722


42,840
 
Due to related parties


1,615
 
Warrant liability
  
 
286


15,944
 
Capital lease obligations
  
 
264


508
 
Long-term debt and other borrowings, net
  
 
399,115


298,404
 
Other long-term liabilities
  
 
2,884


4,377


Total liabilities
  
$
487,459
 
  
$
415,908


Commitments and contingencies (note 1
1
)


See accompanying notes to consolidated financial statements.
 
5
7

Table of Contents
 
KORE Group Holdings, Inc. and Subsidiaries
Consolidated Balance Sheets - Continued
(In thousands USD, except share and per share amounts)


December 31,
 
 
December 31,


2021
 
 
2020
 
Temporary equity


Series A Preferred Stock; par value $1,000 per share; none authorized, issued and outstanding at December 31, 2021; 7,765,229 shares authorized, and 7,756,158 shares issued and outstanding at December 31, 
2020
  
$
—  
 
 
$
77,562
 
Series A-1 Preferred Stock; par value $1,000 per share; none authorized, issued and outstanding at December 31, 2021; 10,480,538 shares authorized, 7,862,107 shares issued and outstanding at December 31, 2020
  
 
—  


78,621
 
Series B Preferred Stock; par value $1,000 per share; none authorized, issued and outstanding at December 31, 2021; 9,090,975 shares authorized, 9,090,975 shares issued and outstanding at December 31, 2020
  
 
—  


90,910
 
Series C Convertible Preferred Stock; par value $1,000 per share; none authorized, issued and outstanding at December 31, 2021; 6,872,894 shares authorized, 2,566,186 shares issued and outstanding at December
 31,
 
2020
  
 
—  


16,802


Total temporary equity
  
$
—  
 
 
$
263,895


Stockholders’ equity


Common stock, voting; par value $0.0001 per share; 315,000,000 shares authorized, 72,027,743 shares issued and outstanding at December 31, 2021; 55,659,643 shares authorized, 30,281,520 shares issued and outstanding at December 31, 2020
  
$
7
 
 
$
3
 
Additional
paid-in
capital
  
 
413,646


135,616
 
Accumulated other comprehensive loss
  
 
(3,331
 
 
(1,677
Accumulated deficit
  
 
(138,179
 
 
(113,726


Total stockholders’ equity
  
 
272,143


20,216


Total liabilities, temporary equity and stockholders’ equity
  
$
759,602
 
 
$
700,019


See accompanying notes to consolidated financial statements.
 
58

Table of Contents
KORE Group Holdings, Inc. and Subsidiaries
Consolidated Statements of Operations
(In thousands USD, except share and per share amounts)
 
For the years ended
  
December 31,
 
 
December 31,
 
 
December 31,


2021
 
 
2020
 
 
2019
 
Revenue


Services
  
$
187,962
 
 
$
172,845
 
 
$
159,425
 
Products
  
 
60,255


40,915


9,727


Total revenue
  
 
248,217


213,760


169,152
 
Cost of revenue


Cost of services
  
 
69,867


64,520


57,621
 
Cost of products
  
 
52,357


33,410


6,044


Total cost of revenue (exclusive of depreciation and amortization shown separately below)
  
 
122,224


97,930


63,665


Operating expenses


Selling, general and administrative
  
 
91,733


72,883


65,298
 
Depreciation and amortization
  
 
50,414


52,488


48,131
 
Intangible asset impairment loss


3,892


Total operating expenses
  
 
142,147


125,371


117,321


Operating loss
  
 
(16,154
 
 
(9,541
 
 
(11,834
Interest expense, including amortization of deferred financing costs, net
  
 
23,260


23,493


24,785
 
Change in fair value of warrant liability
  
 
(5,267
 
 
7,485


(235


Loss before income taxes
  
 
(34,147
 
 
(40,519
 
 
(36,384
Income tax expense (benefit)


Current
  
 
177


1,051


(1,450
Deferred
  
 
(9,871
 
 
(6,369
 
 
(11,491


Total income tax benefit
  
 
(9,694
 
 
(5,318
 
 
(12,941


Net loss attributable to the Company
  
$
(24,453
 
$
(35,201
 
$
(23,443


Loss per share:


Basic
  
$
(1.03
 
$
(1.96
 
$
(1.45
Diluted
  
$
(1.03
 
$
(1.96
 
$
(1.45
Weighted average shares outstanding (in Number):


Basic
  
 
41,933,050


31,650,173


31,169,435
 
Diluted
  
 
41,933,050


31,650,173


31,169,435
 
See accompanying notes to consolidated financial statements.
 
59

Table of Contents
KORE Group Holdings, Inc. and Subsidiaries
Consolidated Statements of Comprehensive Loss
(In thousands USD)
 
For the years ended
  
December 31,
2021
 
 
December 31,
2020
 
 
December 31,
2019
 
Net loss
 
$
(24,453
 
$
(35,201
 
$
(23,443
Other comprehensive income (loss):


Foreign currency translation adjustment
  
 
(1,654
 
 
2,116


517


Comprehensive loss
  
$
(26,107
 
$
(33,085
 
$
(22,926


See accompanying notes to consolidated financial statements.
 
60

Table of Contents
KORE Group Holdings, Inc. and Subsidiaries
Consolidated Statements of Temporary Equity and Stockholders’ Equity
(In thousands, USD, except share amounts)


Series A Preferred
Stock
 
 
Series A-1
Preferred Stock
 
 
Series B Preferred
Stock
 
 
Series C Convertible
Preferred Stock
 
 
Total
Temporary
Equity
 
 
Common Stock
 
 
Additional
paid-in
capital
 
 
Accumulated
Other
Comprehensive
Income (Loss)
 
 
Accumulated
Deficit
 
 
Total
Stockholders’
Equity


Temporary Equity


Shares
 
 
Amount
 
 
Shares
 
 
Amount
 
 
Shares
 
 
Amount
 
 
Shares
 
 
Amount
 
 
Amount
 
 
Shares
 
 
Amount
 
 
Amount
 
 
Amount
 
 
Amount
 
 
Amount
 
Balance at December 31, 2018 (as previously reported)
 
 
42,750
 
 
$
60,270


60,013
 
 
$
61,444


57,000
 
 
$
76,832


16,802
 
 
$
16,802
 
 
$
215,348


213,756
 
 
$
2
 
 
$
174,601
 
 
$
(4,310
 
$
(55,082
 
$
115,211


Conversion of Stock
 
 
5,984,277


—  


6,084,419


—  


7,626,175


—  


2,549,384


—  


—  


29,530,231


1


(1
 
 
—  


—  


—  


Balance at December 31, 2018, effect of reverse recapitalization
 
 
6,027,027
 
 
$
60,270


6,144,432
 
 
$
61,444


7,683,175
 
 
$
76,832


2,566,186
 
 
$
16,802
 
 
$
215,348


29,743,987
 
 
$
3
 
 
$
174,600
 
 
$
(4,310
 
$
(55,082
 
$
115,211


Issuance of stock
 
 
—  


—  


—  


—  


—  


—  


—  


—  


—  


573,016


—  


7,000


—  


—  


7,000
 
Repurchase and cancellation of stock
 
 
—  


—  


—  


—  


—  


—  


—  


—  


—  


(7,653
 
 
—  


(80
 
 
—  


—  


(80
Accrued dividends payable
 
 
808,976


8,090


805,092


8,051


550,599


5,506


—  


—  


21,647


—  


—  


(21,647
 
 
—  


—  


(21,647
Foreign currency translation adjustment
 
 
—  


—  


—  


—  


—  


—  


—  


—  


—  


—  


—  


—  


517


—  


517
 
Share-based compensation
 
 
—  


—  


—  


—  


—  


—  


—  


—  


—  


—  


—  


1,682


—  


—  


1,682
 
Net loss
 
 
—  


—  


—  


—  


—  


—  


—  


—  


—  


—  


—  


—  


—  


(23,443
 
 
(23,443


Balance at December 31, 2019
 
 
6,836,003
 
 
$
68,360


6,949,524
 
 
$
69,495


8,233,774
 
 
$
82,338


2,566,186
 
 
$
16,802
 
 
$
236,995


30,309,350
 
 
$
3
 
 
$
161,555
 
 
$
(3,793
 
$
(78,525
 
$
79,240


Repurchase and cancellation of stock
 
 
—  


—  


—  


—  


—  


—  


—  


—  


—  


(27,830
 
 
—  


(200
 
 
—  


—  


(200
Accrued dividends payable
 
 
920,155


9,202


912,583


9,126


857,201


8,572


—  


—  


26,900


—  


—  


(26,900
 
 
—  


—  


(26,900
Foreign currency translation adjustment
 
 
—  


—  


—  


—  


—  


—  


—  


—  


—  


—  


—  


—  


2,116


—  


2,116
 
Share-based compensation
 
 
—  


—  


—  


—  


—  


—  


—  


—  


—  


—  


—  


1,161


—  


—  


1,161
 
Net loss
 
 
—  


—  


—  


—  


—  


—  


—  


—  


—  


—  


—  


—  


—  


(35,201
 
 
(35,201


Balance at December 31, 2020
 
 
7,756,158
 
 
$
77,562


7,862,107
 
 
$
78,621


9,090,975
 
 
$
90,910


2,566,186
 
 
$
16,802
 
 
$
263,895


30,281,520
 
 
$
3
 
 
$
135,616
 
 
$
(1,677
 
$
(113,726
 
$
20,216


Derecognition of shares
 
 
—  


—  


—  


—  


—  


—  


(45,818
 
 
(300
 
 
(300
 
 
—  


—  


—  


—  


—  


—  
 
Accrued dividends payable
 
 
765,609


7,656


824,076


8,241


692,543


6,925


—  


—  


22,822


—  


—  


(22,822
 
 
—  


—  


(22,822
Foreign currency translation adjustment
 
 
—  


—  


—  


—  


—  


—  


—  


—  


—  


—  


—  


—  


(1,654
 
 
—  


(1,654
Share-based compensation
 
 
—  


—  


—  


—  


—  


—  


—  


—  


—  


200,426


—  


(1,856
 
 
—  


—  


(1,856
Distributions to and conversions of preferred
stock
 
 
(8,521,767
 
 
(85,218
 
 
(8,686,183
 
 
(86,862
 
 
(9,783,518
 
 
(97,835
 
 
(2,520,368
 
 
(16,502
 
 
(286,417
 
 
7,120,368


1


56,502


—  


—  


56,503
 
CTAC shares recapitalized, net of equity issuance costs of $15,943
 
 
—  


—  


—  


—  


—  


—  


—  


—  


—  


10,373,491


1


6,428


—  


—  


6,460
 
Conversion of KORE warrants
 
 
—  


—  


—  


—  


—  


—  


—  


—  


—  


1,365,612


—  


10,663


—  


—  


10,663
 
Private offering and merger financing, net of
equity issuance costs of $8,123
 
 
—  


—  


—  


—  


—  


—  


—  


—  


—  


22,686,326


2


216,875


—  


—  


217,126
 
Equity portion of convertible debt, net of deferred financing costs of $
384
, net of sponsor shares of $683
, net of deferred tax liability of $3,999


—  


—  


—  


—  


—  


—  


—  


—  


—  


—  


—  


12,240


—  


—  


11,960
 
Net loss
 
 
—  


—  


—  


—  


—  


—  


—  


—  


—  


—  


—  


—  


—  


(24,453
 
 
(24,453


Balance at December 31, 2021


$


$


$


$
 
 
$


72,027,743
 
 
$
7
 
 
$
413,646
 
 
$
(3,331
 
$
(138,179
 
$
272,143


See accompanying notes to consolidated financial statements.
 
6
1

Table of Contents
KORE Group Holdings, Inc. and Subsidiaries
Consolidated Statements of Cash Flows
(In thousands USD)
 
For the years ended
  
December 31,
2021
 
 
December 31,
2020
 
 
December 31,
2019
 
Cash flows from operating activities


Net loss
  
$
(24,453
 
$
(35,201
 
$
(23,443
Adjustments to reconcile net loss to net cash (used in) provided by operating activities


Depreciation and amortization
  
 
50,414


52,488


48,131
 
Intangible asset impairment loss
  
 
—  


—  


3,892
 
Amortization of deferred financing costs
  
 
2,097


2,313


2,063
 
Amortization of discount on Backstop Notes
  
 
424


—  


—  
 
Deferred income taxes
  
 
(9,871
 
 
(6,178
 
 
(11,419
Non-cash
foreign currency loss
  
 
344


233


1,440
 
Share-based compensation
  
 
4,564


1,161


1,682
 
Provision for doubtful accounts
  
 
322


640


905
 
Change in fair value of warrant liability
  
 
(5,267
 
 
7,485


(235
Settlement gain on carrier commitment liability
  
 
—  


—  


(2,269
Change in operating assets and liabilities, net of operating assets and liabilities acquired:


Accounts receivable
  
 
(11,884
 
 
(6,072
 
 
860


Inventories
  
 
(9,875
 
 
(3,027
 
 
(566


Prepaid expenses and other receivables
  
 
(1,700
 
 
(2,020
 
 
169


Accounts payable and accrued liabilities
  
 
(8,371
 
 
13,100


(2,458


Deferred revenue
  
 
(805
 
 
1,583


(44


Income taxes payable
  
 
(697
 
 
(34
 
 
(1,158


Change in minimum carrier commitment liability
  
 
—  


—  


(3,297


Cash (used in) provided by operating activities
  
$
(14,758
)
 
$
26,471
 
 
$
14,253


Cash flows used in investing activities


Additions to intangible assets
  
 
(9,247
 
 
(10,135
 
 
(10,491
)


Additions to property and equipment
  
 
(4,172
 
 
(1,834
 
 
(2,391
Acquisition of Integron LLC, net of cash acquired
  
 
—  


366


(37,488


Net cash used in investing activities
  
$
(13,419
 
$
(11,603
)
 
 
$
(50,370
)


Cash flows from financing activities


Proceeds from revolving credit facility
  
 
25,000


8,135


Repayment on revolving credit facility
  
 
(25,000
 
 
(8,300
 
 
—  


Repayment of term loan
  
 
(3,161
 
 
(3,526
 
 
(2,888


Repayment of other borrowings - notes payable
  
 
(173
 
 
—  


—  
 
Proceeds from term loan
  
 
—  


—  


35,000


Proceeds from convertible debt
  
 
104,167


Proceeds from equity portion of convertible debt, net of issuance costs
  
 
15,697


—  


—  


Payment of deferred financing costs
  
 
(1,579
 
 
—  


(2,089


Repayment of related party note
  
 
(1,538
 
 
—  


—  


Repurchase of common stock


(200
 
 
(80


Proceeds from CTAC and PIPE financing, net of issuance costs
  
 
223,688


—  


—  


Settlements of preferred shares
  
 
(229,915
 
 
—  


—  


Payment of capital lease obligations
  
 
(828
)
 
 
(692
 
 
(1,080


Payment of stock option share employee withholding taxes
  
 
(2,305
 
 
—  


Cash provided by/(used in) financing activities
  
$
104,053
 
 
$
(12,718
 
$
36,998


Effect of Exchange Rate Change on Cash and Cash Equivalents
  
 
(226
 
 
(149
 
 
(162
Change in Cash and Cash Equivalents and Restricted Cash
  
 
75,650


2,001


719
 
Cash and Cash Equivalents and Restricted Cash, beginning of period
  
 
10,693


8,692


7,973


Cash and Cash Equivalents and Restricted Cash, end of period
  
$
86,343
 
 
$
10,693
 
 
$
8,692
 
See accompanying notes to consolidated financial statements.
 
6
2

Table of Contents
KORE Group Holdings, Inc. and Subsidiaries
Consolidated Statements of Cash Flows - Continued
(In thousands USD)
 
For the years ended
  
2021
 
  
2020
 
  
2019
 
Non-cash
investing and financing activities:


Equity issued for acquisition of Integron LLC
  
$
 
—  
 
  
$
—  
 
  
$
7,000
 
Equity financing fees accrued
  
 
3,602


—  


—  
 
Capital leases


622


1,120
 
Common shares issued to preferred shareholders
  
 
56,502


—  


—  
 
Equity financing fees settled in common shares
  
 
1,863


—  


—  
 
Common shares issued to warrant holders
  
 
10,663


—  


—  
 
Common shares issued to option holders pursuant to the Cancellation Agreements
 
 
1,072


Sponsor shares distributed to lender under Backstop Agreement
  
 
683


—  


—  
 
Supplemental cash flow information:


Interest paid
  
$
19,874
 
  
$
21,544
 
  
$
23,977
 
Taxes paid (net of refunds)
  
 
957


379


417
 
See accompanying notes to consolidated financial statements.
 
6
3

Table of Contents
KORE Group Holdings, Inc. and Subsidiaries
Notes to Consolidated Financial Statements
(In thousands USD, except share and per share amounts)
NOTE 1 - NATURE OF OPERATIONS
Business Combination
On March 12, 2021
, Maple Holdings Inc. (“Maple” or “pre-combination KORE”) entered into a definitive merger agreement (the “Business Combination”) with Cerberus Telecom Acquisition Corp. (NYSE: CTAC). On September 29
, 2021
, CTAC held a special meeting, at which CTAC’s shareholders voted to approve the proposals outlined in the proxy statement filed by CTAC with the Securities Exchange Commission (the “SEC”) on August 13
, 2021
, including, among other things, the adoption of the Business Combination and approval of the other transactions contemplated by the merger agreement.
On September 30
, 2021
(the “Closing Date”), as contemplated by the merger agreement, (i) CTAC merged with and into King LLC Merger Sub, LLC (“LLC Merger Sub”) (the “Pubco Merger”), with LLC Merger Sub being the surviving entity of the Pubco Merger and King Pubco, Inc. (“Pubco”) as parent of the surviving entity, (ii) immediately prior to the First Merger (as defined below), Cerberus Telecom Acquisition Holdings, LLC (the “Sponsor”) contributed 100% of its equity interests in King Corp Merger Sub, Inc. (“Corp Merger Sub”) to Pubco (the “Corp Merger Sub Contribution”), as a result of which Corp Merger Sub became a wholly owned subsidiary of Pubco, (iii) following the Corp Merger Sub Contribution, Corp Merger Sub merged with and into Maple (the “First Merger”), with Maple being the surviving corporation of the First Merger, and (iv) immediately following the First Merger and as part of the same overall transaction as the First Merger, Maple merged with and into LLC Merger Sub (the “Second Merger” and, together with the First Merger, being collectively referred to as the “Mergers” and, together with the other transactions contemplated by the merger agreement, the “Transactions” and the closing of the Transactions, the Business Combination), with LLC Merger Sub being the surviving entity of the Second Merger and Pubco being the sole member of LLC Merger Sub. In connection with the Business Combination, Pubco changed its name to “KORE Group Holdings, Inc.” (the “Company”) The combined Company remained listed on the NYSE under the new ticker symbol “KORE”.
The Business Combination was accounted for as a reverse recapitalization whereby pre-combination KORE was determined to be the accounting acquirer and CTAC was treated as the “acquired” company for accounting purposes. The Business Combination was accounted as the equivalent of pre-combination KORE issuing stock for the net assets of CTAC, accompanied by a recapitalization whereby pre-combination KORE was determined to be the accounting acquirer.
The consolidated balance sheets, statements of operations and statements of temporary equity and stockholders’ equity and these notes to the consolidated financial statements reflect the reverse recapitalization as discussed above. Reported shares and earnings per share available to common stockholders, prior to the Business Combination, have been retroactively restated to reflect the exchange ratio established in the merger agreement. The number of shares of preferred stock was also retroactively restated based on the exchange ratio.
Organization
The Company provides advanced connectivity services, location-based services, device solutions, managed and professional services used in the development and support of IoT technology for the Machine-to-Machine (“M2M”) market. The Company’s IoT platform is delivered in partnership with the world’s largest mobile network operators and provides secure, reliable wireless connectivity to mobile and fixed devices. This technology enables the Company to expand its global technology platform by transferring capabilities across new and existing vertical markets and delivers complimentary products to channel partners and resellers worldwide.
The Company has operating subsidiaries located in Australia, Belgium, Brazil, Canada, Dominican Republic, Ireland, Malta, Mexico, the Netherlands, New Zealand, Singapore, Switzerland, the United Kingdom and the United States. The Company’s consolidated financial statements (the “consolidated financial statements”) reflect its financial statements and those of its wholly owned subsidiaries.
NOTE 2 – SUMMARY OF SIGNIFICANT ACCOUNTING POLICIES
Basis of Presentation
The Company’s consolidated financial statements are expressed in U.S. dollars and have been prepared in accordance with accounting principles generally accepted in the United States of America (“US GAAP”). Intercompany balances and transactions were eliminated upon consolidation. The preparation of consolidated financial statements in conformity with GAAP requires management to make use of estimates and assumptions that affect the reported amounts and disclosures.
 
6
4

Table of Contents
The Business Combination is accounted for as a
reve
rse recapitalization as pre-combination KORE was determined to be the accounting acquirer under FASB’s ASC Topic 805, Business Combination (“ASC 805”).
Pre-combination
KORE was determined to be the accounting acquirer based on the evaluation of the following facts and circumstances:


the equity holders of
pre-combination
KORE hold the majority (54%) of voting rights in the Company;


the senior management of
pre-combination
KORE became the senior management of the Company;


in comparison with CTAC,
pre-combination
KORE has significantly more revenues and total assets and a larger net loss; and


the operations of pre-combination KORE comprise the ongoing operations of the Company, and the Company assumed pre-Combination KORE’s headquarters.
Accordingly, for accounting purposes, the financial statements of the Company represent a continuation of the financial statements of pre-combination KORE with the acquisition being treated as the equivalent of pre-combination KORE issuing stock for the net assets of CTAC, accompanied by a recapitalization. The net assets of CTAC were stated at historical cost, with no goodwill or other intangible assets recorded. Pre-combination KORE was deemed to be the predecessor and the consolidated assets and liabilities and results of operations prior to September 30, 2021 are those of
pre-combination
KORE. Reported shares and earnings per share available to common stockholders, prior to the Business Combination, have been retroactively restated to reflect the exchange ratio established in the merger agreement. The number of shares of preferred stock was also retroactively restated based on the exchange ratio.
Foreign Currency
The functional currency of the Company’s foreign subsidiaries is generally the local currency. Any transactions recorded in the Company’s foreign subsidiaries denominated in a currency other than the local currency are remeasured using current exchange rates each reporting period with the resulting unrealized gains or losses being included in selling, general and administrative expenses on the consolidated statements of operations. Such unrealized gains and losses primarily relate to intercompany balances and amounted to unrealized losses of $0.3 million, $0.2 million and $1.4 million in 2021, 2020 and 2019, respectively.
For consolidation purposes, all assets and liabilities denominated in a foreign currency are translated into U.S. dollars at the exchange rate on the balance sheet date. Revenues and expenses are translated at the average exchange rate during the period. Equity transactions are translated using historical exchange rates. Adjustments resulting from translating foreign functional currency financial statements into U.S. dollars are recorded as part of a separate component of stockholders’ equity and reported in the consolidated statements of comprehensive loss.
Segments
Operating segments are defined as components of an entity for which separate financial information is available and that is regularly reviewed by the Chief Operating Decision Maker (“CODM”) in deciding how to allocate resources to the individual segment and in assessing performance. The Company’s CODM is its Chief Executive Officer. The Company has determined that it operates in one operating segment and one reportable segment, as the CODM reviews financial information presented on a consolidated basis for purposes of making operating decisions, allocating resources, and evaluating financial performance.
COVID-19
Impact
During the period ended December 31, 2021, an outbreak of the novel coronavirus (“COVID-19”) has continued to spread across the globe and continued to result in significant economic disruption. The extent of the impact of COVID-19 on the Company’s operational and financial performance will depend on certain developments, including the duration and spread of any future outbreaks; however as of this filing, COVID-19 has not had a negative impact on the Company’s financial condition or results of operations.
Use of Estimates
The preparation of consolidated financial statements, in conformity with US GAAP, requires management to make estimates and assumptions that affect the reported amounts of assets and liabilities, and disclosure of contingent assets and liabilities at the date of the consolidated financial statements, and the reported amounts of revenues and expenses during the reporting period. The most significant estimates relate to revenue recognition such as determining the nature and timing of the satisfaction of performance obligations, revenue reserves, allowances for accounts receivable, inventory obsolescence, the recognition and measurement of assets acquired and liabilities assumed in business combinations at fair value, assessment of indicators of goodwill impairment, determination of useful lives of the
 
6
5


Table of Contents
Company’s intangible assets and equipment, the
assessment
of expected cash
flows
used in evaluating long-lived assets for impairment, the calculation of capitalized software costs, accounting for uncertainties in income tax positions, and the value of securities underlying stock-based compensation. Although these estimates are based on management’s best knowledge of current events and actions that the Company may undertake in the future, actual results may be different from these estimates.
Revenue Recognition
On January 1, 2019, the Company adopted ASC 606, Revenue from Contracts with Customers, using the modified retrospective method for those contracts with customers which were not completed as of January 1, 2019. The adoption of ASC 606 did not have a material effect on the Company’s financial statements.
The guidance provides that an entity should apply the following steps: (1)
 identify the contract with a customer; (2)
 identify the performance obligations in the contract; (3)
 determine the transaction price; (4)
 allocate the transaction price to the performance obligations in the contract; and (5)
 recognize revenue when, or as, the entity satisfies a performance obligation. Payments are generally due and received within
30-60
days from the point of billing customers.
The Company derives revenues primarily from IoT Connectivity and IoT Solutions. Connectivity arrangements provide customers with secure and reliable wireless connectivity to mobile and fixed devices through various mobile network carriers. Revenue from IoT Connectivity consists of monthly recurring charges (“MRC’s”) and overage/usage charges, and contracts are generally short-term in nature (i.e.,
month-to-month
arrangements). Revenue for MRC’s and overage/usage charges are recognized over time as the Company satisfies the performance obligation (generally starting when an enrolled device is activated on the Company’s platform). MRC’s are billed monthly in advance (generally in the last week of a month); any amounts billed for which the service has not been provided as of the balance sheet dates are reported as a contract liability and components of deferred revenue. Overage/usage charges are billed in arrears on a monthly cycle. Overage/usage charges are evaluated on a monthly basis, and any overage/usage charges determined by management as unlikely to be collected due to a customer disputing the charge or due to a concession are reserved. Reserved items are written off when deemed uncollectible or recognized as revenue if collected. Certain IoT Connectivity customers also have the option to purchase products and/or equipment (e.g. subscriber identification module or “SIM” cards, routers, phones, or tablets) from the Company on an as needed basis. Product sales to IoT Connectivity customers are recognized when control is transferred to the customer, which is typically upon shipment of the product.
IoT Solutions arrangements includes device solutions (including connectivity), deployment services, and/or technology-related professional services. Management evaluates each IoT Solutions arrangement to determine the contract for accounting purposes. If a contract contains more than one performance obligation, consideration is allocated to each performance obligation based on standalone selling prices. Device and other hardware sales in IoT Solutions arrangements are generally accounted for as separate contracts since the customer is not obligated to purchase additional services when committing to the purchase of any products. Such sales are typically recognized upon shipment to the customer. However, in certain contracts, the customer has requested the Company to hold the products ordered for later shipment to the customer’s remote location or to the customer’s end user as a part of a vendor managed inventory model. In these situations, management has concluded that transfer of control to the customer occurs prior to shipment. In these “bill-and-hold” arrangements, the right to invoice, transfer of legal title and transfer of the risk and rewards associated with the products occurs when the Company receives the hardware from a third-party vendor and has deemed it to be functional. Additionally, the products are identified both physically and systematically as belonging to a specific customer, are usable by the customer, and are only shipped, used, or disposed as directed by the specific customer. Based on these factors, management recognizes revenue on bill-and-hold hardware when the hardware is received by the Company and deemed functional. As part of the bill-and-hold arrangements, the Company performs a service related to the storage of the hardware. The Company has determined that any storage fee related to bill-and-hold inventory is immaterial to the consolidated financial statements taken as a whole.
Deployment services consist of the Company preparing hardware owned by a customer for use by a customer’s end user. Deployment and connectivity may both be included within a single IoT Solutions contract and are considered separate performance obligations. While consideration for deployment services is generally fixed when ordered by the client, consideration for connectivity services is variable and solely related to the connectivity services. Therefore, the fixed consideration is allocated to the deployment services and is recognized as revenue when the services are provided (i.e. when the related hardware is shipped to the customer). Connectivity within IoT Solutions contracts are recognized similar to the IoT Connectivity as described above, since such contracts are generally short term in nature and variability is resolved each month as the services are provided.

6
6


Table of Contents
Professional services are generally provided over a contract term of one to two months. Revenue is recognized over time on an input method basis (typically, based on hours completed to date and an estimate of total hours to complete the project).
There are no material instances where variable consideration is constrained and not recorded at the initial time of sale. Product returns are recorded as a reduction to revenue based on anticipated sales returns that occur in the normal course of business and are immaterial for the years ended December 31, 2021, 2020, and 2019, respectively. The Company primarily has assurance-type warranties that do not result in separate performance obligations.
The Company did not recognize any material revenue in the current reporting period for performance obligations that were fully satisfied in previous periods.
The Company does not have material unfulfilled performance obligation balances for contracts with an original length greater than one year in any of the years presented. Additionally, the Company does not have material costs related to obtaining a contract with amortization periods greater than one year for any of the years presented.
Overage usage charges are evaluated on a monthly basis, and any overage/usage charges determined by management as unlikely to be collected due to a customer disputing the charge or due to a concession are reserved in the month billed and are not initially recognized as revenue. These amounts are netted against accounts receivable and reversed when credited to the customer account generally no longer than one to two months after initial billing.
The Company applies ASC 606 utilizing the following allowable exemptions or practical expedients:


Exemption to not disclose the unfulfilled performance obligation balance for contracts with an original length of one year or less.


Practical expedient to recognize the incremental costs of obtaining a contract as an expense when incurred if the amortization period of the asset that the entity otherwise would have recognized is one year or less.


Election to present revenue net of sales taxes and other similar taxes.


Election from recognizing shipping and handling activities as a separate performance obligation.


Practical expedient not requiring the entity to adjust the promised amount of consideration for the effects of a significant financing component if the entity expects, at contract inception, that the period between when the entity transfers a promised good or service to a customer and when the customer pays for that good or service will be one year or less.
Cash and Cash Equivalents and Restricted Cash
Cash and cash equivalents include highly liquid instruments with an original maturity of less than 90 days from the date of purchase or the ability to redeem amounts on demand. Cash and cash equivalents are stated at cost, which approximates their fair value.
Restricted cash represents cash deposits held with financial institutions for letters of credit and is not available for general corporate purposes.
Concentrations of Credit Risk and
Off-Balance-Sheet
Risk
Cash and cash equivalents are financial instruments that are potentially subject to concentrations of credit risk. The Company’s cash and cash equivalents are deposited in accounts at large financial institutions, and amounts may exceed federally insured limits. The Company believes it is not exposed to significant credit risk due to the financial strength of the depository institutions in which the cash and cash equivalents are held. The Company has no
other financial instruments with
off-balance-sheet
risk of loss.
Accounts Receivable, Net of Allowance for Doubtful Accounts
The carrying amount of accounts receivable is reduced by a valuation allowance that reflects management’s best estimate of the amounts that will not be collected. Management reviews all accounts receivable balances that exceed terms from the invoice date individually, and based on an assessment of current creditworthiness, past payment history, and historical loss experience, and provides an allowance for the portion, if any, of the balance not expected to be collected. All accounts or portions thereof considered uncollectible or require excessive collection costs are written off to the allowance for doubtful accounts and recorded under selling, general and administrative expense in the consolidated statements of operations. The Company incurred bad debt expense of $0.3 million, $0.6 million and $0.9 million for the years ended December 31, 2021, 2020 and 2019, respectively. As of December 31, 2021 and 2020, the Company reduced accounts receivable for a valuation allowance for bad debt expense of $0.5
million and $0.5 million, respectively.
 
6
7


Table of Contents
Inventories
The
Company records its inventory, which primarily consists of finished goods such as SIM cards, other hardware and packaging materials, using the first-in, first-out method (“FIFO”). Certain items in inventory require limited assembly procedures to be performed before shipping the items to customers. Due to the insignificant nature and cost associated with the assembly procedures, the Company classifies these items as finished goods. Inventories are stated at the lower of cost or net realizable value. The Company performs ongoing evaluations and maintains a reserve if necessary for slow-moving and obsolete items, based upon factors surrounding the inventory age, amount of inventory on hand and projected sales.
Property and Equipment
The Company’s property and equipment primarily consist of computer hardware and software, networking equipment as well as furniture and fixtures. Property and equipment are recorded at cost and are depreciated over their estimated useful lives using the declining-balance method at the following annual rates:
 
Computer hardware
 and software
  
 
30
Networking equipment
  
 
20
Furniture and fixtures
  
 
20
Maintenance, repairs, and ordinary replacements are recorded under selling, general and administrative expense in the consolidated statement of operations as incurred. Expenditures for improvements that extend the physical or economic life of the property are capitalized. Leasehold improvements are depreciated using the straight-line method over the shorter of the estimated useful life or the remaining term of the lease. The Company includes computer software in property and equipment as the software is integral to enabling the functioning of the hardware.
Leases
Leases entered into by the Company, in which substantially all the benefits and risk of ownership are transferred to the Company, are recorded as obligations under capital leases. Obligations under capital leases reflect the present value of future lease payments, discounted at an appropriate interest rate, and are reduced by rental payments, net of imputed interest. Assets under capital leases are amortized based on the useful lives of the assets. All other leases are classified as operating leases, and leasing costs, including any rent holidays, leasehold incentives and rent concessions, are recorded on a straight-line basis over the lease term under selling, general and administrative expense in the consolidated statement of operations.
Internal Use Software
Certain costs of platform and software applications developed for internal use are capitalized as intangible assets. Capitalization of costs begins when two criteria are met: (i) the preliminary project stage is completed (i.e. application development stage) and (ii) it is probable that the software will be completed and used for its intended function. The Company also capitalizes costs related to specific upgrades and enhancements when it is probable the expenditures will result in additional functionality. Costs incurred for maintenance, minor upgrades and enhancements are recorded under selling, general and administrative expense in the consolidated statement of operations as incurred. Costs related to preliminary project activities and postimplementation operating activities are also recorded under selling, general and administrative expense in the consolidated statement of operations as incurred. The Company amortizes the capitalized costs on a straight-line basis over the useful life of the asset. Refer to “Note 7, Goodwill and Other Intangible Assets” to the consolidated financial statements, for further detail of the Company’s average useful lives for capitalized internal use computer software.
Business Combinations
The Company allocates the fair value of the consideration transferred to the assets acquired and liabilities assumed based on their fair values at the acquisition date. The excess of the fair value of consideration transferred over the fair value of the assets acquired, and liabilities assumed is recorded as goodwill. Acquisition-related expenses and restructuring costs are recognized separately from the business combination and expensed as incurred. All changes in accounting for deferred tax asset valuation allowances and acquired income tax uncertainties after the measurement period are recognized as a component of provision for income taxes. When determining the fair values of assets acquired and liabilities assumed, management makes significant estimates and assumptions, especially with respect to intangible assets. Critical estimates in valuing intangible assets include expected future cash flows based on consideration of future growth rates and margins, customer attrition rates, future changes in technology and brand awareness and discount rates. Fair value estimates are based on the assumptions management believes a market participant would use in pricing the asset or liability. While the Company uses its best estimates and assumptions as a part of the purchase price allocation process to accurately value assets acquired and liabilities assumed as of the business combination date, its estimates and assumptions are inherently uncertain and subject to refinement. As a result, during the preliminary purchase price measurement period, which may be up to one year from the business
 
68

Table of Contents
combination date, the Company records adjustments to the provisional amounts recognized at the acquisition date to reflect new information obtained about facts and circumstances that existed as of the acquisition date, with a corresponding offset to goodwill. After the preliminary purchase price measurement period, the Company records adjustments to assets acquired or liabilities assumed subsequent to the purchase price measurement period in its operating results in the period in which the adjustments were determined.​​​​​​​​​​​​​​
Fair Value Measurements
The Company applies the provisions of ASC 820, Fair Value Measurements, for
fair
value measurements of financial assets and financial liabilities and for fair value measurements of non-financial items that are recognized or disclosed at fair value in the financial statements on a recurring basis. The Company also applied the provisions of the subtopic to fair value measurements of non-financial assets and non-financial liabilities that are recognized or disclosed at fair value in the financial statements on a non-recurring basis. The subtopic defines fair value as the price that would be received to sell an asset or paid to transfer a liability in an orderly transaction between market participants at the measurement date. The subtopic also establishes a framework for measuring fair value and expands disclosures about fair value measurements. The fair value framework requires the Company to categorize certain assets and liabilities into three levels, based upon the assumptions used to price those assets or liabilities. The t
hree
levels are defined as follows:
Level 1: Quoted prices in active markets for identical assets or liabilities.
Level 2: Quoted prices for similar assets and liabilities in active markets or inputs that are observable.
Level 3: Unobservable inputs reflecting management’s own assumptions about the inputs used in pricing the asset or liability.
The Company has determined the estimated fair value of its financial instruments based on appropriate valuation methodologies; however, considerable judgment is required to develop these estimates. Accordingly, these estimated fair values are not necessarily indicative of the amounts the Company could realize in a current market exchange. The estimated fair values can be materially affected by using different assumptions or methodologies. The methods and assumptions used in estimating the fair values of financial instruments are based on carrying values and future cash flows.
Cash, cash equivalents and restricted cash are stated at cost, which approximates their fair value. The carrying amounts reported in the balance sheet for accounts receivable, accounts payable, and accrued liabilities approximate fair value, due to their short-term maturities.
The carrying amounts of the Company’s outstanding borrowings are carried at amortized cost using the effective interest rate method. The Company’s outstanding borrowings are not required to be measured at fair value and subsequently remeasured at current fair values at the end of each reporting period.
The carrying values of the Company’s outstanding borrowings are disclosed at the end of each reporting period in “Note 9 – Long Term Debt and Other Borrowings, net” to the consolidated financial statements.
The Company has outstanding private warrants (“Private Warrants”) issued for the purchase of common stock, which are liability-classified. The Private Warrants are marked to fair value and evaluated as level 2 for fair value as disclosed in “Note 15 Warrants on Common Stock” to the consolidated financial statements.
Intangible
Assets
Identifiable intangible assets acquired individually or as part of a group of other assets are initially recognized and measured at cost. The cost of a group of intangible assets acquired in a transaction, including those acquired in a business combination that meet the specified criteria for recognition apart from goodwill, is the sum of the individual assets acquired based on their acquisition date fair values. The cost incurred to enhance the service potential of an intangible asset is capitalized as a betterment.
Identifiable intangible assets comprise assets that have a definite life. Customer relationship intangibles are amortized on an accelerated basis and the other intangible assets are amortized on a straight-line basis over their estimated useful lives as follows:
 
Customer relationships
  
10-13 years
Technology
  
5-9 years
Carrier contracts
  
10
years
Trademarks
  
9
-10 years
Non-compete
agreements
  
3
years
Internally developed computer software
  
3
-5 years
 
6
9

Table of Contents
The
Company
capitalizes costs directly related to the design, deployment and enhancements of its internal operating support systems, including employee-related costs. As of December 31, 2019, the Company determined that there was an indicator of impairment and recognized a $3.9 million impairment on RACO intangible assets. As of December 31, 2021 and 2020, the Company determined that there were no indicators of impairment and did not recognize any impairment of its intangible assets.
Goodwill
Goodwill represents the excess fair value of consideration transferred over the fair value of the net identifiable assets acquired in a business combination. Goodwill is evaluated annually for impairment or more frequently if impairment indicators are present. A qualitative assessment is performed to determine whether the existence of events or circumstances leads to a determination that it is more likely than not the fair value of the reporting unit is less than its carrying amount. Qualitative factors considered are macroeconomics conditions such as geographical location and fluctuations in foreign exchange, industry and market conditions, financial performance, entity-specific events and share price trends. If, based on the evaluation, it is determined that the fair value of the reporting unit is less than the carrying value, then an impairment loss is recognized in an amount equal to that excess, limited to the total amount of goodwill allocated to that reporting unit. Under a quantitative test, the Company obtains a third-party valuation of the fair value of the reporting unit. Assumptions used in the fair value calculation include revenue growth and profitability, terminal values, discount rates, and implied control premium. These assumptions are consistent with those the Company believes hypothetical marketplace participants would use. The Company has not recorded an impairment to goodwill for the years ended December 31, 2021, 2020 and 2019, respectively.
During the fourth quarter of 2021, the Company changed the date of its annual impairment test of goodwill from
December 3
1 to October 1. The Company believes the change in goodwill impairment date does not result in a material change in the method of applying the accounting principle. This change provides the Company additional time to complete the annual impairment test of goodwill in advance of our year end reporting. The Company will continue to perform interim impairment testing should circumstances or events require. This change does not result in a delay, acceleration, or avoidance of an impairment charge. This change was applied prospectively in 2021 because it was impracticable to apply it retrospectively due to the difficulty in making estimates and assumptions without using hindsight.
Deferred Financing Fees
Deferred financing fees consist principally of debt issuance costs which are being amortized using the effective interest method over the terms of the related debt agreements and are presented in the consolidated balance sheets as direct deductions from long-term debt. Issuance costs for credit facilities are recorded in other long-term assets in the consolidated balance sheets and are amortized over the term of the agreement using the straight-line method.
Impairment of Long-Lived Assets
The Company reviews long-lived assets, such as property and equipment, and purchased intangibles subject to amortization, for impairment whenever events or changes in circumstances indicate that the carrying amount of an asset may not be recoverable. Recoverability of assets to be held and used is measured by a comparison of the carrying amount of an asset to the estimated undiscounted future cash flows expected to be generated by the asset. If the carrying amount of an asset exceeds its estimated future cash flows, an impairment charge is recognized for the amount by which the carrying amount of the asset exceeds the fair value of the asset. Assets to be disposed of by sale would be separately presented in the consolidated balance sheet and reported at the lower of the carrying amount or fair value less costs to sell and are no longer depreciated. The assets and liabilities of a group classified as held for sale would be presented separately in the appropriate asset and liability sections of the consolidated balance sheet. There were no assets classified as held for sale at any of the balance sheet dates presented.
Income Taxes
The Company provides for income taxes under the asset and liability method. Deferred tax assets and liabilities are recognized for the future tax consequences attributable to differences between the financial statement carrying amounts of existing assets and liabilities and their respective tax bases. Deferred tax assets and liabilities are measured using enacted tax rates expected to apply to taxable income in the years in which those temporary differences are expected to be recovered or settled. The Company recognized the effect of income tax positions only if those positions are more likely than not to be sustained. Recognized income tax positions are measured at the largest amount that is greater than 50% likely to be realized. The effect on deferred tax assets and liabilities of a change in tax rates is recognized in income in the year that includes the date of enactment. A valuation allowance is recorded to reduce deferred tax assets to an amount, which, in the opinion of management, is more likely than not to be realized. The Company considers factors such as the cumulative income or loss in recent years; reversal of deferred tax liabilities; projected future taxable income exclusive of temporary differences; the character of the income tax asset, including income tax positions; tax planning strategies and other factors in the determination of the valuation allowance.
 
70

Table of Contents
Earnings (Loss) Per Share
The Company calculates basic and diluted earnings/(loss) per common share.
Basic earnings/(loss) per share is calculated by dividing earnings/(loss) for the period by the weighted-average common shares outstanding for the period including outstanding warrants. Diluted earnings/(loss) per share includes the effect of dilutive instruments and uses the average share price for the period in determining the number of shares that are to be added to the weighted-average number of shares outstanding. Cumulative dividends on preferred shares are subtracted from net income/(loss) to arrive at earnings/(loss) attributable to common stockholders.
In periods of net income, the Company allocates net income to the common shares under the
two-class
method for the Series C Preferred shares and unvested share-based payment awards that contain participating rights to dividends or dividend equivalents (whether paid or unpaid). Because the Series C Preferred share and share-based payment awards do not have an obligation to fund losses, they are not included in the calculation during periods of losses because their effect would be antidilutive.
Adjustment to Outstanding Shares
In the unaudited consolidated financial statements for the three and nine months ended September 30, 2021 and 2020 filed with the SEC, the Company incorrectly excluded approximately 1.4 
million shares (after the effect of the recapitalization) of common stock resulting from the assumed conversion of the Kore Warrants from the weighted average number of common shares outstanding in the calculation of basic and diluted earnings per share. 
As a result, basic and diluted net loss per common share and the weighted average number of common shares outstanding were misstated by an amount that the Company has determined to be immaterial. The Company has chosen to revise the previously reported amounts. The exclusion of such shares did not affect the previously reported total stockholders’ equity or net loss or any other line items within the unaudited consolidated financial statements.
The following table provides a comparison between the previously filed numbers and the numbers after the correction for the affected periods:


Previous Filings
 
  
After Correction


2021
 
  
2020
 
  
2021
 
  
2020


(unaudited)
 
  
(unaudited)
 
  
(unaudited)
 
  
(unaudited)
 
Three months Ended September 30,


Net loss attributable to common shareholders
  
$
(8,331
  
$
(12,787
  
$
(8,331
  
$
(12,787
Loss per share:


Basic
  
$
(0.27
  
$
(0.42
  
$
(0.26
  
$
(0.40
Diluted
  
$
(0.27
  
$
(0.42
  
$
(0.26
  
$
(0.40
Weighted-average shares outstanding:


Basic
  
 
30,732,921


30,281,520


32,098,715


31,647,131
 
Diluted
  
 
30,732,921


30,281,520


32,098,715


31,647,131


Previous Filings
 
  
After Correction


2021
 
  
2020
 
  
2021
 
  
2020


(unaudited)
 
  
(unaudited)
 
  
(unaudited)
 
  
(unaudited)
 
Nine months Ended September 30,


Net loss attributable to common shareholders
  
$
(31,222
  
$
(39,966
  
$
(31,222
  
$
(39,966
Net loss per share


Basic
  
$
(1.03
  
$
(1.32
  
$
(0.98
  
$
(1.26
Diluted
  
$
(1.03
  
$
(1.32
  
$
(0.98
  
$
(1.26
Weighted-average shares outstanding:


Basic
  
 
30,433,641


30,285,684


31,799,313


31,651,295
 
Diluted
  
 
30,433,641


30,285,684


31,799,313


31,651,295
 
 
7
1

Table of Contents
Reclassifications in the financial
statements
Certain reclassifications have been made to the 2020 and 2019 consolidated financial statements to conform the 2021 presentation. These reclassifications did not have a significant impact to the consolidated financial statements presented.
Advertising
The Company expenses advertising costs as incurred. The Company does not incur significant advertising costs. Adverting expense was $0.1 million for each of the years ended December 31, 2021, 2020 and 2019.
Stock-Based Compensation
The Company has several stock-based compensation plans, which are more fully described in Note 14, Stock-Based Compensation, to the consolidated financial statements. Stock-based compensation to employees, is generally measured on the grant date based on the grant-date fair value of the awards. These costs are recognized as an expense following straight-line attribution method over the requisite service period. The Company accounts for forfeitures as they occur. The Company used the Black-Scholes option pricing model to measure the fair value of its stock options under the 2014 Equity Incentive Plan.
Compensation expense for stock options granted to nonemployees is calculated using the Black-Scholes option pricing model and is recognized in expense over the service period. The Black-Scholes option pricing model requires the use of complex assumptions, which determine the fair value of stock-based awards. Prior to the business combination, these assumptions included:


Risk -free interest rate. The risk-free interest rate is based on the U.S. Treasury yield curve in effect at the time of grant for zero coupon U.S. Treasury notes with maturities approximately equal to the expected term of the stock-based awards;


Expected term. The expected term represents the period that the stock-based awards are expected to be outstanding. The Company uses the simplified calculation of expected term, which reflects the weighted-average of
time-to-vesting;


Expected dividend. The expected dividend is assumed to be zero as the Company has never paid dividends and has no current plans to pay any dividends on its common stock; and


Expected volatility. The expected volatility is derived from an average of the historical volatilities of the common stock of the Company and several other entities with characteristics similar to those of the Company, such as the size and operational and economic similarities to the Company’s principal business operations.
If any of the assumptions used in the Black-Scholes model changed, stock-based compensation for future options may differ materially compared to that associated with previous grants.
Defined Contribution Plans
The Company sponsors defined contribution plans (the “Plans”) that cover our domestic and international employees following the completion of an eligibility period. Under the Plans, participating employees may defer a portion of their pretax earnings up to the limits provided by local statutory requirements. The Company makes matching contributions, subject to limits of the base compensation that a participant contributes to the Plan. The Company’s matching contributions vest over up to a maximum of four years from the participant’s date of hire. The Company records its portion of matching contributions as an expense within selling, general and administrative. The Company contributed in aggregate $0.4 million, $0.5 million, and $0.5 million, for the fiscal years 2021, 2020 and 2019, respectively.
Comprehensive Income (Loss) and Accumulated Other Comprehensive Loss
The Company has included the consolidated statements of operations and comprehensive loss in the accompanying consolidated financial statements, which include the effects of the translation of currency for foreign operations. No amounts have been reclassified out of Accumulated Other Comprehensive Loss for the years ended December 31, 2021, 2020 and 2019.
Emerging G
rowth Company
Section 102(b)(1) of the JOBS Act exempts emerging growth companies from being required to comply with new or revised financial accounting standards until private companies are required to comply with the new or revised financial accounting standards. The Company qualifies as an “Emerging Growth Company” and has elected to use the extended transition period for complying with new or revised accounting standards under Section 102(b)(1) of the JOBS Act. This election allows the Company to adopt new or revised standards at the same time as private companies.
 
7
2

Table of Contents
Recently Adopted A
ccounting
Pronouncement
In December 2019, the FASB issued Accounting Standards Update (“ASU”) 2019-12,
Income Taxes: Simplifying the Accounting for Income Taxes
. ASU 2019-12 simplifies the accounting for income taxes by removing certain exceptions to the general principles in Topic 740. The amendments also improve consistent application of and simplify GAAP for other areas of Topic 740 by clarifying and amending existing guidance. ASU 2019-12 is effective for public business entities for fiscal years, and interim periods within those fiscal years, beginning after December 15, 2020. The Company adopted this standard as of January 1, 2021, and depending on the amendment, adoption was applied on a retrospective, modified retrospective, or prospective basis. The adoption of the standard did not have a material impact on the Company’s consolidated financial statements and related disclosures.
In August 2018, the FASB issued ASU 2018-15,
Customer’s Accounting for Implementation Costs Incurred in a Cloud Computing Arrangement That Is a Service Contract
, which requires a customer in a hosting arrangement that is a service contract to apply the guidance on internal-use software to determine which implementation costs to recognize as an asset and which costs to expense. Costs to develop or obtain internal-use software that cannot be capitalized under Subtopic 350-40,
Internal-Use
Software
, such as training costs and certain data conversion costs, also cannot be capitalized for a hosting arrangement that is a service contract. The amendments require a customer in a hosting arrangement that is a service contract to determine whether an implementation activity relates to the preliminary project stage, the application development stage, or the post-implementation stage. Costs for implementation activities in the application development stage will be capitalized depending on the nature of the costs, while costs incurred during the preliminary project and post-implementation stages will be expensed immediately. The ASU is effective for the Company for annual reporting periods beginning after December 15, 2020, and interim periods within annual periods beginning after December 15, 2021. Early adoption is permitted, including adoption in any interim period, for all entities. The Company adopted this standard as of January 1, 2021. The adoption of the standard did not have a material impact on the Company’s consolidated financial statements and related disclosures.
Recently Issued Accounting Pronouncements
In August 2020, the FASB issued ASU 2020-06,
Debt—Debt with Conversion and Other Options (Subtopic
470-20)
and Derivatives and Hedging—Contracts in Entity’s Own Equity
(Subtopic
815-40)
(“ASU 2020-06”) to simplify accounting for certain financial instruments. ASU 2020-06 eliminates the current models that require separation of beneficial conversion and cash conversion features from convertible instruments and simplifies the derivative scope exception guidance pertaining to equity classification of contracts in an entity’s own equity. The new standard also introduces additional disclosures for convertible debt and freestanding instruments that are indexed to and settled in an entity’s own equity. ASU 2020-06 amends the diluted earnings per share guidance, including the requirement to use the if-converted method for all convertible instruments. ASU 2020-06 is effective for fiscal years, and interim periods within those fiscal years, beginning after December 15, 2023. Early adoption is permitted, for fiscal years (including interim periods) beginning after December 15, 2020. The Company expects to early adopt 2020-06 on January 1, 2022 using a modified retrospective approach. Upon adoption, we currently expect to recognize a decrease in additional paid in capital of approximately $11.6 million, as well as a decrease to deferred tax liabilities of approximately $3.8 million, which will be offset by an increase to retained earnings of approximately $0.3 million as well as approximately $15.5 million increase to long-term debt. The increase to long-term debt does
not
represent an increase in debt owed by the Company. It simply reflects the reversal of the equity component which was previously netted against long-term debt. Refer to “Note 9 – Long-Term Debt and Other Borrowings, net”, to the consolidated financial statements for further detail.
In February 2016, the FASB issued ASU 2016-02,
Leases
, to increase transparency and comparability among organizations by recognizing lease assets and lease liabilities on the balance sheet and disclosing key information about leasing arrangements. In July 2018, ASU 2018-10,
Codification Improvements to ASC
2016-02,
Leases
, was issued to provide more detailed guidance and additional clarification for implementing ASU 2016-02. Furthermore, in July 2018, the FASB issued ASU 2018-11,
Leases: Targeted Improvements
, which provides an optional transition method in addition to the existing modified retrospective transition method by allowing a cumulative effect adjustment to the opening balance of retained earnings in the period of adoption. Furthermore, on June 3, 2020, the FASB deferred by one year the effective date of the new leases standard for private companies, private not-for-profits and public not-for-profits that have not yet issued (or made available for issuance) financial statements reflecting the new standard. Additionally, in March 2020, ASU 2020-03,
Codification Improvements to Financial Instruments, Leases
, was issued to provide more detailed guidance and additional clarification for implementing ASU 2016-02. Furthermore, in June 2020, ASU 2020-05,
Revenue from Contracts with Customers and Leases
, was issued to defer effective dates of adoption of the new leasing standard beginning after December 15, 2021, and interim periods within fiscal years beginning after December 15, 2022. These new leasing standards (collectively “ASC 842” or “the new standard”) are effective for the Company beginning after December 15, 2021, and interim periods within fiscal years beginning after December 15, 2022, with early adoption permitted.
The new standard is effective for the Company on January 1, 2022. A modified retrospective transition approach is required, applying the new standard to all leases existing at the date of initial application. We expect to adopt the new standard on January 1, 2022 and use the effective date as our date of initial application. Consequently, financial information will not be updated, and the disclosures required under the new standard will not be provided for dates and periods before January 1, 2022.
 
73

Table of Contents
The new standard provides
a n
umber of optional practical expedients in transition. We expect to elect the ‘package of practical expedients’, which permits us not to reassess under the new standard our prior conclusions about lease identification, lease classification and initial direct costs. We expect that this standard will have a material effect on our financial statements. While we continue to assess all of the effects of adoption, we currently believe the most significant effects relate to (1) the recognition of new Right of Use (“ROU”) assets and lease liabilities on our balance sheet for our real estate, computer hardware and vehicle leases and (2) providing significant new disclosures about our leasing activities. We do not expect a significant change in our leasing activities between now and adoption.
The new standard also provides practical expedients for an entity’s ongoing accounting. We currently expect to elect the short-term lease recognition exemption for all leases that qualify. This means, for those leases that qualify, we will not recognize ROU assets or lease liabilities, and this includes not recognizing ROU assets or lease liabilities for existing short-term leases of those assets in transition. We also currently expect to elect the practical expedient to not separate lease and
non-lease
components for all of our leases.
Upon adoption, we currently expect to recognize additional operating lease liabilities ranging from $9.1 to $10.1 million, with corresponding ROU assets of the same amount based on the present value of the remaining minimum rental payments under current leasing standards for existing operating leases.
In June 2016, the FASB issued ASU 2016-13,
Financial Instruments - Credit Losses: Measurement of Credit Losses on Financial Instruments
, which requires the use of a new current expected credit loss (“CECL”) model in estimating allowances for doubtful accounts with respect to accounts receivable and notes receivable. Receivables from revenue transactions, or trade receivables, are recognized when the corresponding revenue is recognized under ASC 606,
Revenue from Contracts with Customers
. The CECL model requires that the Company estimate its lifetime expected credit loss with respect to these receivables and record allowances when deducted from the balance of the receivables, which represent the estimated net amounts expected to be collected. Given the generally short-term nature of trade receivables, the Company does not expect to apply a discounted cash flow methodology. However, the Company will consider whether historical loss rates are consistent with expectations of forward-looking estimates for its trade receivables. In November 2018, the FASB issued ASU 2018-19, Cod
ification Improvements to Topic 326, Financial Instruments—Credit Losses
to clarify that operating lease receivables recorded by lessors are explicitly excluded from the scope of ASU 2016-13. This ASU (collectively “ASC 326”) is effective for fiscal years beginning after December 15, 2023, and interim periods within those fiscal years. The Company is still evaluating the impact of the adoption of this ASU.
In March 2020, the FASB issued ASU 2020-04,
Reference Rate Reform: Facilitation of the Effects of Reference Rate Reform on Financial Reporting
, to provide guidance on easing the potential burden in accounting for reference rate reform on financial reporting. ASU 2020-04 is effective from March 12, 2020 and may be applied prospectively through December 31, 2022. The Company is still evaluating the impact of the adoption of this ASU.
In March 2020, the FASB issued ASU 2020-03,
Codification Improvements to Financial Instruments
, which clarifies specific issues raised by stakeholders. Specifically, the ASU:


Clarifies that all entities are required to provide the fair value option disclosures in ASC 825,
Financial Instruments
.


Clarifies that the portfolio exception in ASC 820,
Fair Value Measurement
, applies to nonfinancial items accounted for as derivatives under ASC 815,
Derivatives and Hedging
.


Clarifies that for purposes of measuring expected credit losses on a net investment in a lease in accordance with ASC 326,
Financial Instruments - Credit Losses
, the lease term determined in accordance with ASC 842,
Leases
, should be used as the contractual term.


Clarifies that when an entity regains control of financial assets sold, it should recognize an allowance for credit losses in accordance with ASC 326.


Aligns the disclosure requirements for debt securities in ASC 320,
Investments - Debt Securities
, with the corresponding requirements for depository and lending institutions in ASC 942,
Financial Services - Depository and Lending
.
The amendments in the ASU have various effective dates and transition requirements, some depending on whether an entity has previously adopted ASU 2016-13 about measurement of expected credit losses. The Company will adopt the guidance in ASU 2020-03 as it adopts the related ASU effected by these codification improvements.
In May 2021, the FASB issued ASU 2021-04,
Issuer’s Accounting for Certain Modifications or Exchanges of Freestanding Equity-Classified Written Call Options
,
which provides guidance on modifications or exchanges of a freestanding equity-classified written call option that is not within the scope of another Topic. An entity should treat a
 
74

Table of Contents
modification of the terms or conditions or an exchange of a freestanding equity-classified written call option that remains equity classified after modification or exchange as an exchange of the original instrument for a new instrument, and provides further guidance on measuring the effect of a modification or an exchange of a freestanding equity-classified written call option that remains equity classified after modification or exchange. ASU 2021-04 also provides guidance on the recognition of the effect of a modification or an exchange of a freestanding equity-classified written call option that remains equity classified after modification or exchange on the basis of the substance of the transaction, in the same manner as if cash had been paid as consideration. The amendments are effective for all entities for fiscal years beginning after December 15, 2021, including interim
periods
within those fiscal years. Early adoption is permitted. The Company is evaluating the impact of the adoption of this
standard.
NOTE 3 – REVENUE RECOGNITION
Contract Balances
Deferred revenue as of December 31
, 2021
and 2020
, was $6.9 million, and $7.8 million, respectively, and primarily relates to revenue that is recognized over time for connectivity monthly recurring charges, the changes in balance of which are related to the satisfaction or partial satisfaction of these contracts. The balance also contains a deferral for goods that are in-transit at period end for which control transfers to the customer upon delivery. All of the December 31
, 2020
, balance was recognized as revenue during the period ended December 31
, 2021
.
Disaggregated Revenue Information
The Company views the following disaggregated disclosures as useful to understand the composition of revenue recognized during the respective reporting periods:


Year ended December 31,
 
(in ‘000)
  
2021
 
  
2020
 
  
2019
 
Connectivity*
  
$
164,392
 
  
$
152,996
 
  
$
147,927
 
Hardware Sales
  
 
54,898


29,601


8,767
 
Hardware Sales - bill-and-hold
  
 
5,357


11,314


960
 
Deployment services, professional services, and other
  
 
23,570


19,849


11,498


Total
  
$
248,217
 
  
$
213,760
 
  
$
169,152
 
 
*
Includes connectivity-related revenues from IoT Connectivity and IoT Solutions
Significant Customer
The Company has one customer, a large multinational medical device and
health car
e company representing 21% and 16% and of the Company’s total revenue for the years ending December 31, 2021 and 2020, respectively. No individual customer had revenue greater than 10% of the Company’s total revenue for the year ended December 31, 2019.
The Company has one
customer representing 30% and 22% of the Company’s total accounts receivable as of December 31
, 2021
and 2020
, respectively. The Company believes it is not exposed to significant risk due to the financial strength of this customer and their historical trend
of on-time payment.
NOTE 4 – REVERSE RECAPITALIZATION
On September 30, 2021, pre-combination KORE and CTAC consummated the merger contemplated by the merger agreement (see Note 1 – Nature of Operations).
Immediately following the Business Combination, there were 71,810,419 shares of common stock with a par value of $0.0001. Additionally, there were outstanding warrants to purchase 8,911,744 shares of common stock.
The Business Combination was accounted for as a reverse recapitalization in accordance with GAAP as pre-combination KORE was determined to be the accounting acquirer. Under this method of accounting, while CTAC was the legal acquirer, it has been treated as the “acquired” company for financial reporting purposes. Accordingly, the Business Combination was treated as the equivalent of pre-combination KORE issuing stock for the net assets of CTAC, accompanied by a recapitalization. The net assets of CTAC were stated at historical cost, with no
goodwill or other intangible assets recorded. Operations prior to the Business Combination are those of pre-combination KORE. Reported shares and earnings per share available to holders of the Company’s common stock, prior to the Business Combination, have been retroactively restated to reflect the exchange ratio established in the Business Combination (approximately one
pre-combination KORE share to 139.15 of the Company’s shares).
 
7
5

Table of Contents
The most significant change in the post-combination Company’s reported financial position and results was an increase in cash, net of transactions costs paid at close, of $63.2 million including: $225.0 million in gross proceeds from the private placements (the “PIPE”), $20.0 million in proceeds from CTAC after redemptions, $95.1 million in proceeds from the Backstop Notes (see Note 9)
, and payments of $229.9 million to KORE’s preferred shareholders. Additionally, on the Closing Date, the Company repaid the Senior Secured Revolving Credit Facility with UBS of $25 million. The Company also repaid the outstanding related party loans due to Interfusion B.V and T-Fone B.V. of $1.6 million.
Refer to “Note 9 – Long-Term Debt and Other Borrowings, net” and “Note 17 – Related Party Transactions”, to the consolidated financial statements.
The Company incurred $24.2 million in transaction costs relating to the Business Combination on the Closing Date, of which $24.1 million has been recorded against additional paid-in capital in the consolidated balance sheet as of December 31
, 2021
and the remaining amount of $0.1 million was recognized as selling, general and administrative expenses in the consolidated statement of operations for the year ended December 31
, 2021
.
Upon closing of the Business Combination, the shareholders of CTAC, including CTAC founders, were issued 10,356,593 shares of common stock of the Company. In connection with the closing, holders of 22,240,970 shares of common stock of CTAC were redeemed at a price per share of $10.00. In connection with the Closing, 22,500,000 shares of the Company were issued to PIPE investors at a price per share of $10.00.
The number of shares of Class A common stock issued immediately following the consummation of the Business Combination were:


Shares
 
  
Percentage
 
Pre-combination
KORE shareholders
  
 
38,767,500


54.0
Public stockholders
  
 
10,356,593


14.4
Private offering and merger financing
  
 
22,686,326


31.6


Total
  
 
71,810,419


100.0


7
6

Table of Contents
NOTE 5 – BUSINESS COMBINATION
Integron LLC
On November 22, 2019, the Company acquired 100% of the outstanding share capital of lntegron LLC, a provider of specialized managed services and device solutions with a focus in connected health and life sciences for customers in the United States and Europe. This acquisition further enhances the strategic position of the Company as the global leader in enabling powerful IoT solutions for the largest global organizations.
The acquisition was accounted for using the acquisition method of accounting, and assets and liabilities were recognized at their fair value as of the date of acquisition. The transaction was funded by amendment to the existing credit facility between the Company and UBS Bank (UBS) via a term loan in the amount of $35.0 million, and the issuance of the equivalent of 573,016 shares of the Company’s common stock with a fair value of $7.0 million.
Refer to “Note 9 – Long-Term Debt and Other Borrowings, net”, to the consolidated financial statements.
Transaction costs for legal, consulting, accounting, and other related costs incurred in connection with the acquisition of lntegron LLC were $0.7 million for the year ended December 31, 2019.
The following table summarizes the purchase price allocation including the consideration paid for lntegron LLC, the recognized amounts of assets acquired, and liabilities assumed on November 22, 2019:
 
(in ‘000)
  
Amount
 
Cash paid to sellers
  
$
37,500
 
Common stock issued to sellers
  
 
7,000


Total consideration
  
$
44,500
 
Cash
  
 
12
 
Accounts receivable
  
 
7,776
 
Inventories
  
 
489
 
Prepaid expenses and other receivables
  
 
341
 
Property and equipment
  
 
458
 
Identifiable intangible assets
  
 
32,000
 
Deferred tax liabilities
  
 
(1,285
Accounts payable and accrued liabilities
  
 
(1,818


Net identifiable assets acquired
  
 
37,973


Goodwill (excess of consideration transferred over net identifiable assets acquired)
  
$
6,527


The consolidated statements of operations and comprehensive loss reflect the operations of the combined entity, beginning on the acquisition date, November 22, 2019. Goodwill arises largely from the growth potential that exists and efficiencies that will be realized under the Company’s new strategic objectives.
The total consideration for the acquisition was $44.5 million, including $37.5 million in cash and $7.0 million in equity. The fair value of the equity consideration represented the issuance of 573,016 common shares of the Company’s stock to Integron’s former shareholders, in the amount of approximately $12 per share. The fair value of accounts receivable, other assets, accounts payable and accrued liabilities approximates the carrying amount of those assets and liabilities, at the acquisition date.
Identifiable intangible assets acquired by the Company include customer relationships, trademark, and current technology. The customer relationships, trademark, and current technology are amortized on a straight-line basis over their estimated useful lives of 5 to 13 years. The fair values and useful lives of the identified intangible assets were primarily determined by using several significant unobservable inputs such as forecasted cash flows, discount rate, attrition rates, and royalty rates.
The goodwill attributable to the Integron Acquisition is deductible for tax purposes.
The Company recorded a measurement period adjustment resulting from a working capital shortfall settled with the sellers through escrowed consideration being returned to the Company in May 2020. The adjustment is recognized as a reduction of goodwill in the amount of $0.4 million. There were no income effects that would have been recognized in previous periods if the adjustment to provisional amounts were recognized as of the date of acquisition.
 
7
7

Table of Contents
Unaudited pro forma information
Had the acquisition of Integron been completed on January 1
, 2019
, net revenue would be $207.0 million and the net loss would be approximately $15.9 million for the year ended December 31
, 2019
. This unaudited pro forma financial information presented is not necessarily indicative of what the operating results actually would have been if the acquisition had taken place on January 1
, 2019
, nor is it indicative of future operating results. The pro forma amounts include the historical operating results of the Company prior to the acquisition, with adjustments factually supportable and directly attributable to the acquisition, primarily related to transaction costs, the amortization of intangible assets, and interest expense. Acquisition-related costs of $0.7 million for the year ended December 31
, 2019
are non-recurring pro forma adjustments.
NOTE 6 – PROPERTY AND EQUIPMENT
Major classes of property and equipment consist of t
he
following:
 
(in ‘000)
  
December 31,
2021
 
  
December 31,
2020
 
Computer hardware
  
$
15,747
 
  
$
13,634
 
Computer software
  
 
9,023


8,211
 
Furniture and fixtures
  
 
2,242


2,284
 
Networking equipment
  
 
8,089


8,151
 
Leasehold improvements
  
 
2,793


2,803


Total property and equipment
  
 
37,894


35,083
 
Less: accumulated depreciation
  
 
(25,654
  
 
(21,374


Property and equipment (net)
  
$
12,240
 
  
$
13,709


Depreciation expense for the years ended December 31
, 2021, 2020 and 2019, was $3.7 million, $4.5 million, and $4.7 million, respectively.
NOTE 7 – GOODWILL AND OTHER INTANGIBLE ASSETS
The Company’s goodwill balance consists of the following:
 
(in ‘000)
  
Amount
 
December 31, 2019
  
$
382,247
 
Measurement period adjustment
Integron
  
 
(366
Currency translation
  
 
868


December 31, 2020
  
$
382,749


Currency translation
  
 
(787


December 31, 2021
  
$
381,962


7
8

Table of Contents
The Company’s other intangible assets consist of the following:
 
(in ‘000)
  
Carrying Gross
Amount
 
  
Accumulated
Amortization
 
  
Net Carrying Value
 
Customer relationships
  
$
306,732
 
  
$
(168,679
  
$
138,053
 
Technology
  
 
45,983


(37,529
  
 
8,454
 
Carrier contracts
  
 
65,700


(40,488
  
 
25,212
 
Trademarks
  
 
15,733


(9,221
  
 
6,512
 
Internally developed computer software
  
 
59,906


(34,663
  
 
25,243


Total as of December 31, 2021
  
$
494,054
 
  
$
(290,580
  
$
203,474


(in ‘000)
  
Carrying Gross
Amount
 
  
Accumulated
Amortization
 
  
Net Carrying Value
 
Customer relationships
  
$
307,356
 
  
$
(143,230
  
$
164,126
 
Technology
  
 
46,229


(33,394
  
 
12,835
 
Carrier contracts
  
 
65,700


(33,918
  
 
31,782
 
Trademarks
  
 
15,828


(7,608
  
 
8,220
 
Internally developed computer software
  
 
45,148


(21,908
  
 
23,240


Total as of December 31, 2020
  
$
480,261
 
  
$
(240,058
  
$
240,203


Amortization
 
expense for the years ended December 31
, 2021
, 2020
and 2019
was $46.7 million, $48.0 million and $43.4
 million, respectively.
The following table shows the weighted average remaining useful lives per intangible asset category as of December 31, 2021.


Years
 
Customer relationships
  
 
5.8
 
Technology
  
 
3.1
 
Carrier contracts
  
 
4.0
 
Trademarks
  
 
5.1
 
Internally developed computer software
  
 
4.0
 
The following table shows the estimated amortization expense for the next five years and thereafter as of December 31, 2021.


Amount
 
2022
  
$
46,788
 
2023
  
 
43,223
 
2024
  
 
39,132
 
2025
  
 
36,359
 
2026
  
 
22,350
 
Thereafter
  
 
15,622


Total
  
$
203,474


Impairment of Internally Developed Computer Software
During the year ended December 31, 2019, the Company recorded a $3.9 million impairment charge for internally developed and acquired computer software associated with the RACO Wireless, LLC acquisition in December 2014. The impairment was a direct result of technological advancements resulting in 2G and 3G networks being sunset and is recorded under intangible asset impairment loss in the consolidated statement of operations.
 
7
9

Table of Contents
NOTE 8 –ACCRUED LIABILITES
Accrued Liabilities
The Company’s accrued liabilities consist of the following:
 
(in ‘000)
  
December 31,
2021
 
  
December 31,
2020
 
Accrued payroll and related
  
$
13,103
 
  
$
10,657
 
Accrued cost of revenue
  
 
1,641


2,142
 
Accrued other expenses
  
 
5,198


3,845
 
Sales and other taxes payable
  
 
1,369


565


Total accrued liabilities
  
$
21,311
 
  
$
17,209


NOTE 9 –LONG-TERM DEBT AND OTHER BORROWINGS,
NET
The fair values of the Company’s outstanding borrowings approximate the carrying values. The following is a summary of long-term debt:
 
(in ‘000)
  
December 31,
2021
 
  
December 31,
2020
 
Term Loan
UBS
  
$
305,807
 
  
$
308,959
 
Term Loan
BNP Paribas


9
 
Notes under the Backstop Agreement
  
 
120,000


—  
 
Other Borrowings
 
 
173


—  


Total
  
 
425,980


308,968
 
Less
current portion
  
 
3,326


3,161
 
Less
equity component, net of accumulated amortization
  
 
15,517


Less—debt issuance cost, net of accumulated amortization of $6.1 million and $3.7 million, respectively
  
 
8,022


7,403


Total notes and debentures


399,115


298,404
 
Other Borrowings—Notes payable


Total Long-term debt and other borrowings
  
$
399,115
 
  
$
298,404


The following is the summary of future principal repayments on long-term debt:
 
(in ‘000)
  
Amount
 
2022
  
$
3,326
 
2023
  
 
3,153
 
2024
  
 
299,501
 
2025


2026


Thereafter
  
 
120,000


Total
  
$
425,980


Senior Secured Term Loan—UBS
On December 21, 2018, the Company entered into a credit agreement with UBS that consisted of a term loan of $280.0 million as well as a senior secured revolving credit facility with UBS (the “Senior Secured UBS Term Loan”, and together with the senior secured revolving credit facility, the “Credit Facilities”). The Senior Secured UBS Term Loan required quarterly principal and interest payments of LIBOR plus 5.5%. All remaining principal and interest payments are due on December 21, 2024.
On November 12, 2019, the Company amended the Senior Secured UBS Term Loan in order to raise an additional $35.0 million. Under the amended agreement, the maturity date of the term loan and interest rate remained unchanged.
 
80

Table of Contents
However, the quarterly principal repayment changed to $0.8
 million. The principal and quarterly interest are paid on the last business day of each quarter, except at maturity.
As a result of this debt modification, the Company incurred $1.5 million in debt issuance costs, which was capitalized and is being amortized over the remaining term of the loan along with the unamortized debt issuance costs of the original debt. For the year ended December 31, 2021, the Company recognized interest expense related to the contractual interest expense of $17.7 million and interest expense related to the amortization of the debt issuance costs of $2.0 million.
The term loan agreement limits cash dividends and other distributions from the Company’s subsidiaries to Kore Group Holdings Inc. and also restricts the Company’s ability to pay cash dividends to its shareholders. At December 31, 2021 and 2020, restricted net assets of the consolidated subsidiaries were $261.0 and $300.0 million.
The term loan agreement contains, among other things, financial covenants related to maximum total debt to adjusted EBITDA ratio and a minimum total leverage ratio. The Company was in compliance with these covenants for the years ended December 31, 2021, 2020 and 2019. The credit agreement is substantially secured by all the Company’s assets.
The Company’s principal outstanding balances on the Senior Secured UBS Term Loan were $305.8 million and $309.0 million as of December 31, 2021 and 2020, respectively.
Senior Secured Revolving Credit Facility – UBS
On December 21, 2018, the Company entered into a $30.0 million senior secured revolving credit facility with UBS (the “Senior Secured Revolving Credit Facility”, and together with the Senior Secured UBS Term Loan, the “Credit Facilities”).
Borrowings under the Senior Secured Revolving Credit Facility bear interest at a floating rate which can be, at the Company’s option, either (1) a LIBOR rate for a specified interest period plus an applicable margin of up to 5.50% or (2) a base rate plus an applicable margin of up to 4.5%. After the Closing Date, the applicable margins for LIBOR rate and base rate borrowings are each subject to a reduction to 5.25% and 4.25%, respectively, if the Company maintains a total leverage ratio of less than or equal to 5.00:1.00. The LIBOR rate applicable to the Senior Secured Revolving Credit Facility is subject to a “floor” of 0.0%. Additionally, the Company is required to pay a commitment fee of up to 0.50% per annum of the unused balance. 

The obligations
 
of the Company and the obligations of the guarantors under the Credit Facilities are secured by first priority pledges of and security interests in (i) substantially all of the existing and future equity interests of KORE Wireless Group, Inc. and each of its subsidiaries organized in the U.S., as well as 65
% of the existing and future equity interests of certain first-tier foreign subsidiaries held by the borrower or the guarantors under the Credit Facilities and (ii) substantially all of the KORE Wireless Group, Inc.’s and each guarantor’s tangible and intangible assets, in each case subject to certain exceptions and thresholds.
As of December 31, 2021 and 2020, no outstanding amounts were drawn on the Senior Secured Revolving Credit Facility.
Term Loan—BNP Paribas
The loan matured in January 2021 and bore interest at 2.15% per annum with fixed payments of $7,740, which were payable monthly. On January 2, 2021, the Company extinguished the term loan outstanding with BNP Paribas by making the final fixed monthly payment.
Bank Overdraft Facility – BNP Paribas Fortis N.V.
On October 8, 2018, a Belgium subsidiary of the Company entered into a €250,000 bank overdraft facility with BNP Paribas Fortis, (the “Bank Overdraft Facility”). Borrowings under the Bank Overdraft Facility have an indefinite term. Borrowings under the Bank Overdraft Facility bear interest at a floating rate which is a base rate plus an applicable margin of up to 2.0%. The base fee amounts to 9.40% as of December 31, 2021 and is variable. Any overages are charged against a percentage of 6% on a yearly basis. There is no commitment fee payable for the unused balance of the Bank Overdraft Facility.
As of December 30, 2021, and December 31, 2020, the Company had €0 drawn on the Bank Overdraft Facility.
 
8
1

Table of Contents
Backstop Agreement
On September 30
, 2021
, KORE Wireless Group Inc. issued to affiliates of Fortress Credit Corp. (“Fortress”) $95.1 million aggregate principal amount of senior unsecured exchangeable notes due September 30
, 2028
(“Backstop Notes”) pursuant to an indenture (the “Indenture”), dated September 30
, 2021
, by and among KORE Group Holdings, Inc., KORE Wireless Group Inc. and Wilmington Trust, National Association, as trustee. The Backstop Notes were issued at par, bearing interest at the rate of 5.50% per annum, and a maturity of seven years. The Backstop Notes are guaranteed by the Company and are exchangeable into common stock of the Company at $12.50 per share (“the Base Exchange Rate”) at any time at the option of Fortress. The Company may redeem the Notes for cash, force an exchange into shares of its common stock at $16.25 per share or settle with a combination of cash and an exchange. At the Base Exchange Rate, the Backstop Notes are exchangeable into 7.6 million shares of common stock. The Company paid a one
-time commitment fee of $1.5 million in exchange for the issuance of the Backstop Notes. The Base Exchange Rate may be adjusted for certain dilutive events or change in control events as defined by the Indenture (the “Adjusted Exchange Rate”). Additionally, if after the 2
-year anniversary of the issuance of the Backstop Notes the Company’s shares are trading at a defined premium to the Base Exchange Rate or applicable Adjusted Exchange Rate, the Company may redeem the Backstop Notes for cash, force an exchange into shares of its common stock at an amount per share based on a time-value make whole table, or settle with a combination of cash and an exchange (the “Company Option”). Since the Company may use the Company Option to potentially settle all or part of the Backstop Notes for the cash equivalent of the fair value of the common stock for which the notes may be exchanged, a portion of the proceeds of the Backstop Notes have been allocated to equity, based on the estimated fair value of Backstop Notes had they not contained the exchange features. The unamortized discount and issuance costs will be amortized through September 30
, 2028
. The effective interest rate of the liability component is 8.4%.
On October 28
, 2021
, KORE Wireless Group Inc. issued an additional $24.9 million aggregate principal amount of senior unsecured exchangeable notes due September 30, 2028
 
(“Additional Backstop Notes” and together with the Backstop Notes, the “Notes under the Backstop Agreement”), pursuant to the Indenture. The Additional Backstop Notes have identical terms to the Backstop Notes. The Additional Backstop Notes were purchased at par, plus accrued interest, with interest accruing on the Additional Backstop Notes as of September 30, 2021
. The Additional Backstop Notes are guaranteed by the Company and may be exchangeable into common stock of the Company at
$12.50
per share. The Company may redeem the Notes for cash, force an exchange into shares of its common stock at $16.25 per share or settle with a combination of cash and an exchange. At the Base Exchange Rate, the Additional Backstop Notes are exchangeable into 1.9 million shares of common stock. The Sponsor contributed 100,000 shares of common stock of the Company to LLC Merger Sub, which were transferred by LLC Merger Sub to Fortress, as a commitment fee, pursuant to the terms and upon the conditions set forth in the Commitment Letter. Since the Company may use the Company Option to potentially settle all or part of the Additional Backstop Notes for the cash equivalent of the fair value of the common stock for which the notes may be exchanged, a portion of the proceeds of the Additional Backstop Notes have been allocated to equity, based on the estimated fair value of Additional Backstop Notes had they not contained the exchange features. The unamortized discount and issuance costs will be amortized through September 30, 2028. The effective interest rate of the liability component is 8.4%.
As of December 31
, 2021
, unamortized debt issuance costs and unamortized equity component costs were $2.5 and $15.5 million, respectively. The net carrying amount of the Notes under the Backstop Agreement is $102.0 million. For the year ended December 31, 2021, the interest cost related to the contractual interest coupon was approximately $1.6 million. For the year ended December 31, 2021, the interest cost related to the amortization of debt issuance costs related to the liability component was approximately $0.5 million.
The Backstop Agreement contains a customary
six-month
lock up following the closing, which prohibits Fortress from hedging the Notes under the Backstop Agreement by short selling the Company’s common stock or hedging the notes via the Company’s warrants or options.
The Indenture contains, among other things, financial covenants related to maximum total debt to adjusted EBITDA ratio. The Company was in compliance with these covenants for the year ended December 31
, 2021. 
As of December 31
, 2021
, the value of the 9.6 million shares underlying the Backstop Notes and the Additional Backstop Notes is less than the fair value of the Notes under the Backstop Agreement. The Company’s principal outstanding balances on the Notes under the Backstop Agreement were $120.0
 million and $0.0 million as of December 31, 2021 and 2020, respectively.
 
8
2

Table of Contents
NOTE 10 – INCOME TAXES
Income (loss) before provision (benefit) for income taxes from continuing operations for the years ended December 31, 2021, 2020 and 2019 consisted of the following:


For the Years Ended December 31,


2021
 
  
2020
 
  
2019


(in thousands)


United States
  
$
(13,326
  
$
(25,283
  
$
(27,728
Foreign
  
 
(20,821
  
 
(15,236
  
 
(8,656


Total loss before income taxes
  
$
(34,147
  
$
(40,519
  
$
(36,384


The components of the provision (benefit)
fo
r income taxes from continuing operations consisted of the
followi
ng:


For the Years Ended December 31,


2021
 
  
2020
 
  
2019
 
Current:
  
(in thousands)


Federal
  
$
—  
 
  
$


$
(1,136
State
  
 
420


546


(44
Foreign
  
 
(243
  
 
505


(270


Total current provision (benefit)
  
 
177


1,051


(1,450


Deferred:


Federal
  
 
(6,213
  
 
(7,120
  
 
(8,626
State
  
 
(784
  
 
2,285


(2,117
Foreign
  
 
(2,874
  
 
(1,534
  
 
(748


Total deferred benefit
  
 
(9,871
  
 
(6,369
  
 
(11,491


Total benefit
  
$
(9,694
  
$
(5,318
  
$
(12,941


The reconciliation between income taxes computed at the U.S. statutory income tax rate to our provision for income taxes for the years ended December 31, 2021, 2020 and 2019 are as
follows:


For the Years Ended December 31,


2021
 
 
2020
 
 
2019


(in thousands)


Benefit for income taxes at 21% rate
  
$
(7,171
  
 
21.0
 
$
(8,509
  
 
21.0
 
$
(7,641
  
 
21.0
State taxes, net of federal benefit
  
 
(1,227
  
 
3.5
 
 
(947
  
 
2.3
 
 
(2,161
  
 
6.0
Change in valuation allowance
  
 
975


-2.9
 
 
1,016


-2.5


0.0
Rate change
  
 
775


-2.3
 
 
2,856


-7.0


0.0
Credits
  
 
(602
  
 
1.8
 
 
(811
  
 
2.0
 
 
(541
  
 
1.5
Permanent differences and other
  
 
47


-0.1
 
 
307


-0.8
 
 
(41
  
 
0.1
Revaluation of warrants
  
 
(1,106
  
 
3.2
 
 
1,572


-3.9
 
 
(49
  
 
0.1
Uncertain tax positions
  
 
9


0.0
 
 
226


-0.6
 
 
(984
  
 
2.7
Foreign withholding tax
  
 
116


-0.3
 
 
420


-1.0


0.0
Foreign rate differential
  
 
(1,573
  
 
4.6
 
 
(1,448
  
 
3.6
 
 
(1,524
  
 
4.2
Executive compensation expense
  
 
1,517


-4.4


0.0


0.0
Transaction related expense
  
 
(1,454
  
 
4.3


0.0


0.0


Benefit for income taxes
  
$
(9,694
  
 
28.4
 
$
(5,318
  
 
13.1
 
$
(12,941
  
 
35.6


8
3

Table of Contents
Significant components of the Company’s deferred tax assets (liabilities) as of December 31, 2021 and 2020 are as follows:


As of December 31,


2021
 
  
2020


(in thousands)
 
Deferred tax assets:


Net operating loss carry-forward
  
$
11,081
 
  
$
10,604
 
Credit carry-forward
  
 
2,802


2,468
 
Interest expense limitation carry-forward
  
 
10,997


7,811
 
Non-deductible
reserves
  
 
374


520
 
Accruals and other temporary differences
  
 
1,046


1,047
 
Stock compensation


698
 
Property and equipment
  
 
1,018


1,089


Gross deferred tax assets
  
 
27,318


24,237
 
Less Valuation allowance
  
 
(7,731
  
 
(7,164


Total deferred tax assets (after valuation allowance)
  
 
19,587


17,073
 
Deferred tax liabilities:


Property and equipment
  
 
(4,151
  
 
(4,089
Intangible assets
  
 
(40,754
  
 
(49,461
Goodwill
  
 
(7,432
  
 
(6,241
Debt discount
  
 
(3,972
  
 
—  


Total deferred tax liabilities
  
 
(56,309
  
 
(59,791


Net deferred tax liabilities
  
$
(36,722
)
 
  
$
(42,718
)


The valuation allowance increased by $0.6 million during 2021, primarily due to an increase in U.S. state tax attributes deemed not realizable. In determining the need for a valuation allowance, the Company has given consideration to its worldwide cumulative loss position when assessing the weight of the sources of taxable income that can be used to support the realization of deferred tax assets. The Company has assessed, on a jurisdictional basis, the available means of recovering deferred tax assets, including the ability to carry-back net operating losses, the existence of reversing temporary differences, the availability of tax planning strategies and available sources of future taxable income. The Company has also considered the ability to implement certain strategies that would, if necessary, be implemented to accelerate taxable income and use expiring deferred tax assets. The Company believes it is able to support the deferred tax assets recognized as of the end of the year based on all of the available evidence.
As of December 31, 2021, the Company has U.S. federal and state tax net operating loss carryforwards of approximately $3.0 million and $39.7 million respectively, which may be available to offset future income tax liabilities and expire at various dates beginning in 2032 through 2041. Additionally, the Company has U.S. federal and state tax net operating loss carryforwards of approximately $1.2 million and $13.8 million respectively, which carryforward indefinitely. Additionally, the Company has generated $33.8 million of foreign operating loss carryforwards which expire at various dates.
As of December 31, 2021, the Company has U.S. federal and state research and development tax credit carryforwards of $1.8 million and $0.1 million respectively which expire beginning in 2035 through 2041. Additionally, the Company has $0.9 million of foreign research and development tax credit carryforwards.
Due to provisions of the Tax Cuts and Jobs Act of 2017, the Company has a carryforward of U.S. disallowed interest expense of $44.7 million, which has an indefinite carryforward period.
 
8
4

Table of Contents
Utilization of the NOL carryforwards may be subject to limitation under Section 382 of the Internal Revenue Code of 1986 due to ownership change limitations that have occurred previously or that could occur in the future. These ownership changes may limit the amount of NOL and tax credit carryforwards that can be utilized annually to offset future taxable income and tax, respectively. There could be additional ownership changes in the future, which may result in additional limitations on the utilization of the NOL and tax credit carryforwards.
For taxable years beginning after January 1, 2018, taxpayers are subjected to the global intangible low-taxed income provisions, or GILTI provisions. The GILTI provisions require the Company to currently recognize in U.S. taxable income a deemed dividend inclusion of foreign subsidiary earnings in excess of an allowable return on the foreign subsidiary’s tangible assets. The ability to benefit from a deduction and foreign tax credits against a portion of the GILTI income may be limited under the GILTI rules as a result of the utilization of net operating losses, foreign sourced income, and other potential limitations within the foreign tax credit calculation. For the years ended December 31, 2021 and 2020, the Company did not record an income tax charge related to GILTI. The Company has made an accounting policy election, as allowed by the SEC and FASB, to recognize the impacts of GILTI within the period incurred. Accordingly, no U.S. deferred taxes are provided on GILTI inclusions of future foreign subsidiary earnings.

As of December 31, 2021, the Company has not provided U.S. taxes on the undistributed earnings of its foreign subsidiaries that it considers indefinitely reinvested. This indefinite reinvestment determination is based on the future operational and capital requirements of the Company’s domestic and foreign operations. The Company expects that the cash held by its foreign subsidiaries of $8.6
 million as of December 31, 2021 will continue to be used for its foreign operations and, therefore, does not anticipate repatriating these funds.
The Company conducts business globally and, as a result, its subsidiaries file income tax returns in U.S. federal and state jurisdictions and various foreign jurisdictions. In the normal course of business, the Company may be subject to examination by taxing authorities throughout the world, including such major jurisdictions as Australia, Canada, Malta, the Netherlands, the United Kingdom, and the United States. Since the Company is in a loss carry-forward position, the Company is generally subject to U.S. federal and state income tax examinations by tax authorities for all years for which a loss carry-forward is utilized. As of December 31, 2021, the Company is not under income tax examination in any
jurisdiction
.
During the ordinary course of business, there are many transactions and calculations for which the ultimate tax determination is uncertain. The Company establishes reserves for
tax-related
uncertainties based on estimates of whether, and the extent to which, additional taxes will be due. These reserves are established when the Company believes that certain positions might be challenged despite its belief that its tax return positions are fully supportable. The Company adjusts these reserves in light of changing facts and circumstances, such as the outcome of tax examinations.
The following table presents a reconciliation of the total amounts of unrecognized tax benefits, excluding interest and penalties, included on the consolidated balance
sheets
.


For the Year
s
 Ended December 31,


2021
 
  
2020


(in thousands)
 
Unrecognized tax benefits at the beginning of the year
  
$
3,867
 
  
$
3,658
 
Additions for tax positions of current year
  
 
—  


—  
 
Additions for tax positions of prior years


209
 
Reductions for tax positions of prior years
  
 
—  


—  
 
Expirations statutes of limitation
  
 
—  


—  


Unrecognized tax benefits at the end of the year
  
$
3,867
 
  
$
3,867
 
If the unrecognized tax benefit balance as of December 31, 2021 were recognized, it would decrease the Company’s effective tax rate. The Company does not anticipate any material changes to its unrecognized tax benefits within the next 12 months.    
The Company recognizes interest and penalties accrued related to unrecognized tax benefits as income tax expense. During the years ended December 31, 2021 and 2020 the Company recognized $9 thousand
 
and $17 thousand
 
in interest and penalties, respectively. The Company had $26 thousand
 
and $17 thousand
 
of interest and penalties accrued at December 31, 2021 and 2020, respectively.     
 
85

Table of Contents
The CARES Act was enacted on March 27, 2020. The
CARE
S Act is an emergency economic stimulus package that includes spending and tax cuts to strengthen the United States economy and fund a nationwide effort to curtail the effect of COVID-19. The CARES Act provides sweeping tax changes in response to the COVID-19 pandemic. The CARES Act allowed the Company to defer the payment of the employer portion of its FICA taxes to 2021 and 2022; deduct additional US interest expense for 2019 and 2020; accelerate a refund of alternative minimum tax (“AMT”) credits; and increase its permitted level of 2019 federal net operating loss carry-forward.
NOTE 11 – COMMITMENTS AND CONTINGENCIES
Operating Leases
The Company leases various office spaces under non-cancellable operating leases expiring through 2029. Rent expense for years ended December 31, 2021, 2020 and 2019 was $2.7 million, $2.5 million, and $2.3 million, respectively.
The future minimum lease payments under operating leases as of December 31, 2021 for the next five years is as follows:
 
(in ‘000)
  
Amount
 
2022
  
$
2,924
 
2023
  
 
1,904
 
2024
  
 
1,495
 
2025
  
 
1,170
 
2026
  
 
958
 
Thereafter
  
 
3,412


Total
  
$
11,863


Capital Leases
The Company has capital lease obligations in the Netherlands for hardware and software leases.
The future minimum lease payments under capital leases as of December 31, 2021 for the next five years is as follows:
 
(in ‘000)
  
Amount
 
2022
  
$
207
 
2023
  
 
143
 
2024
  
 
119
 
2025
  
 
26
 
2026


Total minimum lease payments
  
$
495
 
Interest expense
  
 
(40


Total
  
$
455


Off-Balance-Sheet
Credit Exposures
The Company has standby letters of credit and bank guarantees of $0.4
 million
as of December 31, 2021 and 2020, respectively. These contingent liabilities are secured by highly liquid instruments included in restricted cash.
 
8
6

Table of Contents
Purchase Obligations
The Company has vendor commitments primarily relating to carrier and open purchase obligations that the Company incurs in the ordinary course of business. As of December 31, 2021, the purchase commitments were as follows:
 
(in ‘000)
  
Amount
 
2022
  
$
21,144
 
2023
  
 
9,446
 
2024
  
 
1,245
 
2025
  
 
1,245
 
2026


Thereafter


Total
  
$
33,080


Legal Proceedings
From time to time, the Company is involved in litigation arising out of the ordinary course of our business. There are no material legal proceedings, other than ordinary routine litigation incidental to the business, to which the Company or any of the Company’s subsidiaries are a party or of which any of the Company or the Company’s subsidiaries’ property is subject.
NOTE 12 – PREPAID AND OTHER RECEIVAB
LE
S
Prepaid Expenses and Other Receivables
The Company’s prepaid expenses and other receivables
consist
of
the
following:
 
(in ‘000)
  
December 31,
2021
 
  
December 31,
2020
 
Prepaid deposits
  
$
1,030
 
  
$
1,734
 
Prepaid expenses
  
 
6,418


3,695
 
Other receivables


Total Prepaid expenses and other receivables
  
$
7,448
 
  
$
5,429


NOTE 13 – TEMPORARY EQUITY AND STOCKHOLDERS’ EQUITY
The Company operates subject to the terms and conditions of the Amended and Restated Certificate of Incorporation (the “Certificate of Incorporation”) dated September 30, 2021.
Common Stock
As of December 31, 2021, the Company authorized up to 350,000,000 shares of capital stock, consisting of 315,000,000 shares of common stock and 35,000,000 shares of preferred stock. As of December 31, 2021, 72,027,743 shares of common stock and zero shares of preferred stock were issued and outstanding.
Series A Preferred Stock
The Board authorized up to 7,765,229 Series A preferred shares. As of December 31
, 2021
and 2020
, there were zero and 7,756,158 Series A preferred shares issued and outstanding, respectively. The shares were issued at a discount of 2%. Series A preferred shareholders are entitled to receive a cumulative preferred dividend at the rate of thirteen percent (13%) per year on the sum of the par value plus unpaid preferred dividends through the date of such distribution on a pari passu basis with Series A-1
and Series B shareholders and in preference to all other shareholders. The Company had the option to redeem the Series A preferred shares for par value plus unpaid preferred dividends. Series A preferred shareholders had an option to put the shares back to the Company for par value plus unpaid preferred dividends on or after April 11
, 2027
. The Company determined that the put option is a redemption event not solely within the control of the Company. Therefore, the Series A preferred stock is classified outside of permanent equity (i.e., temporary equity) and presented at its redemption value. Upon closing of the Business Combination, all Series A preferred shares were settled with a redemption value of $85.2 million in cash. The Company no longer had shares of Series A Preferred Stock authorized, issued or outstanding as of December 31
, 2021
. The terms and rights of the Series A Preferred Stock described previously represent the terms and rights prior to the closing of the Business Combination.
Series
A-1
Preferred Stock
The Board authorized up to 10,480,538 Series A-1
preferred shares. As of December 31
, 2021 and 2020
, there were zero and 7,862,107 Series A-1
preferred shares issued and outstanding, respectively. The shares were issued at a discount of 2%. Series A-1
preferred shareholders are entitled to receive a cumulative preferred dividend at the rate of
 
87

Table of Contents
thirteen-point seven five percent (13.75%) per year on the sum of the par value plus unpaid preferred dividends through the date of such distribution on a pari passu basis with Series A and Series B shareholders and in preference to all other shareholders. The Company had the option to redeem the Series A-1
Preferred shares for par value plus unpaid preferred dividends subject to a current redemption premium of 1%. Series A-1
preferred shareholders had an option to put the shares back to the Company for par value plus unpaid preferred dividends on or after April 11
, 2027
. The Company determined that the put option is a redemption event not solely within the control of the Company. Therefore, the Series A-1
Preferred Stock is classified outside of permanent equity (i.e., temporary equity) and presented at its redemption value. Upon closing of the Business Combination, all Series A-1
preferred shares were settled with a redemption value of $86.9 million. Certain Series A-1
preferred shareholders elected to received shares of common stock of the Company in lieu of cash. The Company no longer had shares of Series A-1
Preferred Stock authorized, issued or outstanding as of December 31
, 2021
. The terms and rights of the Series
A-1
Preferred Stock described previously represent the terms and rights prior to the closing of the Business Combination.
Series B Preferred Stock
The Board authorized up to 9,090,975 Series B preferred shares. As of December 31, 2021 and 2020, there were zero and 9,090,975 Series B preferred shares issued and outstanding, respectively. Series B preferred shareholders are entitled to receive a cumulative preferred dividend at the rate of ten percent (10%) per year on the sum of the unreturned par value plus unpaid preferred dividends through the date of such distribution on a pari passu basis with Series A and Series A-1 shareholders and in preference to all other shareholders. On or after October 11, 2018, the Company has the option to redeem the Series B Preferred shares for par value plus unpaid preferred dividends. Because the controlling shareholder is the majority holder of Series B preferred shares, the Company redemption option functions as a holder put option. Accordingly, the Company determined that the option could result in a redemption that is not solely within the control of the Company. Therefore, the Series B Preferred stock is classified outside of permanent equity (i.e., temporary equity) and presented at its redemption value each period. Upon closing of the Business Combination, all Series B preferred shares were settled with a redemption value of $97.8 million. Certain Series B preferred shareholders elected to received shares of common stock of the Company in lieu of cash. The Company no longer had shares of Series B Preferred Stock authorized, issued or outstanding as of December 31, 2021. The terms and rights of the Series B Preferred Stock described previously represent the terms and rights prior to the closing of the Business Combination.
A summary of the accumulated but unpaid dividends for the Series A, Series
A-1
and Series B preferred shares as of December 31, 2021 and 2020 is as follows:
 
Amount (in ‘000)
  
Series A
 
  
Series A-1
 
  
Series B
 
Accumulated and unpaid, December 31, 2019
  
$
25,610
 
  
$
8,794
 
  
$
25,338
 
Accumulated
  
 
9,202


9,814


8,572
 
Distributed


Accumulated and unpaid, December 31, 2020
  
$
34,812
 
  
$
18,608
 
  
$
33,910
 
Accumulated
  
 
7,656


8,241


6,925
 
Distributed
  
 
(42,468
  
 
(26,849
  
 
(40,835


Accumulated and unpaid, December 31, 2021
  
$


$


$


The redemption value of Series A, Series A-1
and Series B preferred stock is equal
to
the par value of $1,000 per share plus the above accumulated unpaid dividends and any applicable redemption premium.
Series C Convertible Preferred Stock
The Board authorized up to 6,872,894 Series C convertible preferred shares. As of December 31, 2021 and 2020, there were zero and 2,566,186 Series C convertible preferred shares issued and outstanding, respectively. Subordinate to the payment of dividends to Series A, Series A-1 and Series B preferred shareholders, the Series C shareholders are entitled to receive dividends equal to 1.5X initial investment in conjunction with common stock, then subject to a catch-up, followed by pro rata sharing thereafter. Series C convertible preferred shareholders have a de facto option to put the shares back to the Company for liquidation value. The Company determined that the option could result in a deemed liquidation that is not solely within the control of the Company. Therefore, the Series C convertible preferred stock is classified outside of permanent equity (i.e., temporary equity). 

Series C convertible preferred shares are convertible at any time, at the option of the holder, into common stock at a rate of 1 to 1 initially, subject to adjustments for dilution.
Upon closing of the Business Combination, 16,802 shares of Series C Convertible Preferred Stock (pre-combination) converted into 2,520,368 shares of common stock of the Company. The Company no
longer had Series C Convertible Preferred Stock authorized, issued or outstanding as of December 31
, 2021
. The terms and rights of the Series C Convertible Preferred Stock described previously represent the terms and rights prior to the closing of the Business Combination.
 
8
8

Table of Contents
NOTE 14 – STOCK BASED COMPENSATION

2014 Equity Incentive Plan
During 2020, the Company granted awards to certain employees and Board members of the Company. Under the 2014 Equity Incentive Plan (the “Plan”), the Board is authorized to grant stock options to eligible employees and directors of the Company. The fair value of the options was expensed on a straight-line basis over the requisite service period, which is generally the vesting period.
In connection with the Business Combination a modification in the existing terms of the options was introduced to add a contingent cash-settlement feature pursuant to which each option holder entered into an option cancellation agreement (“Cancellation Agreements”), whereby option holders agreed to surrender all options outstanding as of the closing of the Business Combination for cancellation effective immediately prior to the closing. In exchange for the cancellation of the vested and unvested options, option holders are entitled to the right to receive payment of Option Cash Consideration equal to $4,075,000 and Option Share Consideration of 432,500 common shares ($4,325,000 value) in the surviving entity less applicable withholding taxes and without interest, paid on the first payroll cycle following the closing of the Business Combination. Upon the closing of the Business Combination, the Company recorded all previously unrecorded expense from the original rewards to reflect the accelerated vesting of those awards and recorded compensation expense for any post-modification fair value in excess of pre-modification fair value. For the cash settled awards, as determined by a proportion of the settlement values of the awards, the Company recognized a liability equal to the amount of the cash settlement. Upon the closing of the Business Combination, the Company paid out Option Cash Consideration of $4,075,000 net of applicable withholding taxes and issued 200,426 shares as Option Share Consideration (432,500 common shares net of shares for applicable withholding taxes).
For the year ended December 31, 2020, the Company has determined its share-based payments to be a Level 3 fair value measurement. For the year ended December 31, 2020, the Company has used the Black-Scholes option pricing model with assumptions including a risk-free interest rate of 1.58%, an expected term (life) of options (in years) of 2, expected dividends of 0 and expected volatility of 86.3%.
The Company did not grant any awards during the year ended December 31, 2021.
The following is a summary of the Company’s stock options as of December 31, 2021 and the stock option activity from January 1, 2019 through December 31, 2021:


Number of Options
 
  
Weighted Average
Grant Date Fair
Value per Option
(Amount)
 
  
Weighted
Average Exercise
Price (Amount)
 
  
Weighted Average
Remaining Contractual
Term (Years)
 
Balance, December 31, 2018
  
 
414,434
 
 
$
15.80
 
 
$

141.53


9.3
 
Granted
  
 
52,083


15.91


141.53


Exercised
  
 
—  


—  


—  


Forfeited
  
 
(67,366
 
 
15.80


141.53


Expired
  
 
—  


—  


—  


Balance, December 31, 2019
  
 
399,151
 
 
$
15.82


141.53


8.4
 
Granted
  
 
64,064


13.50


141.53


Exercised
  
 
—  


—  


—  


Forfeited
  
 
(30,715
 
 
15.80


141.53


Expired
  
 
—  


—  


—  


Balance, December 31, 2020
  
 
432,500
 
 
$
15.45
 
 
$
141.53


7.7


Granted
  
 
—  


—  


—  


Exercised
  
 
—  


—  


—  


Forfeited
  
 
—  


—  


—  


Expired
  
 
—  


—  


—  


Cancelled
  
 
(432,500
 
 
(15.45
 
 
(141.53
 
 
(7.7


Balance, December 31, 2021


$


$


—  


The following is a summary of the Company’s
share
-
based
compensation expense as of December 31, 2021 and 2020:
 
(in ‘000)
  
December 31, 2021
 
  
December 31, 2020
 
Total Stock Compensation Expense
  
$
4,564
 
  
$
1,161
 
Unrecognized Compensation Cost


3,416
 
Remaining recognition period (in years)
  
 
—  


2.7
 
 
8
9

Table of Contents
The following is a summary of the Company’s exercisable stock options as of December 31, 2021 and 2020:


December 31, 2021
 
  
December 31, 2020
 
Range of Exercise Prices


$
80.87 -$202.18
 
Number


153,898
 
Weighted Average Remaining Contractual Term (in years)
  
 
—  


7.3
 
Weighted Average Exercise Price
  
$


$
141.53
 
2021 Long-Term Stock Incentive Plan
On September 29, 2021, the board of directors (the “Board”) approved the KORE Group Holdings, Inc. 2021 Long-Term Stock Incentive Plan (the “2021 Plan”) to promote the interests of the Company and its stockholders by (i) attracting and retaining employees and directors of, and consultants to, the Company and its subsidiaries; (ii) motivating such individuals by means of performance-related incentives to achieve longer-range performance goals; and (iii) enabling such individuals to participate in the long-term growth and financial success of the Company.
The 2021 Plan allows for the grant of share-based payment
awards
to employees, directors of the Board, and consultants to the Company. The 2021 Plan is administered by the Compensation Committee of the Board.
On December 8, 2021, the Compensation Committee of the Board approved the future grants of certain Restricted Stock Unit Awards, the effectiveness of which were contingent upon the filing and effectiveness of the Form S-8 Registration Statement of the common stock, which occurred on January 4, 2022. For further detail, refer to Note 18- Subsequent Events, to the consolidated financial statements.
NOTE 15 – WARRANTS ON COMMON STOCK
KORE Warrants
In connection with the sale of Series B preferred stock, pre-combination KORE issued warrants (“KORE Warrants”) for the purchase of common stock at an exercise price of $0.01 per warrant. As of December 31, 2021 and 2020, there were zero and 9,814 KORE Warrants issued and outstanding, respectively. Upon closing of the Business Combination, all KORE Warrants were exercised and converted into 1,365,612 shares of common stock.
The Company evaluated the KORE Warrants for liability or equity classification in accordance with the provisions of ASC 480, Distinguishing Liabilities from Equity, and ASC 815-40, Derivatives and Hedging. Based on the provisions governing the warrants in the applicable agreement, the Company determined that the KORE Warrants met the criteria and were required to be classified as a liability subject to the guidance in ASC 815-10 and 815-40 and should effectively be treated as outstanding common shares in both basic and diluted EPS calculations.
Public and Private Placement Warrant
As part of CTAC’s initial public offering (“IPO”) in 2020, CTAC issued warrants to third party investors, and each whole warrant entitles the holder to purchase one share of the Company’s common stock at an exercise price of $11.50 per share (the “Public Warrants”). Simultaneously with the closing of the IPO, CTAC completed the private sale of warrants (“Private Placement Warrants”), and each Private Placement Warrant allows the holder to purchase one share of the Company’s common stock at $11.50 per share. Subsequent to the Business Combination, 8,638,966 Public Warrants and 272,778 Private Placement Warrants remained outstanding as of December 31, 2021.
The Public Warrants may only be exercised for a whole number of common shares. The Public Warrants will become exercisable on the later of (a) 30 days after the completion of a Business Combination or (b) 12 months from the closing of the proposed public offering;
provided in each case that the Company has an effective registration statement under the Securities Act covering the common shares issuable upon exercise of the Public Warrants and a current prospectus relating to them is available (or the Company permits holders to exercise their Public Warrants on a cashless basis and such cashless exercise is exempt from registration under the Securities Act). The Company completed its public offering on September 30, 2021 and filed an effective registration statement (form S-1) under the Securities Act covering the common shares which was effective on December 20, 2021. The Company plans to make commercially reasonable efforts to maintain the effectiveness of such registration statement and a current prospectus relating to those common shares until the warrants expire or are redeemed, as specified in the warrant agreement provided that if the common shares are at the time of any exercise of a warrant not listed on a national securities exchange such that they satisfy 
 
90

Table of Contents
the definition of a “covered security” under Section 18(b)(1) of the Securities Act, the Company may, at its option, require holders of Public Warrants who exercise their warrants to do so on a “cashless basis” in accordance with Section 3(a)(9) of the Securities Act and, in the event the Company so elects, it will not be required to file or maintain in effect a registration statement. 
The Public Warrants will expire five years after the completion of the Business Combination or earlier upon redemption or liquidation.
The Private Placement Warrants and the common shares issuable upon exercise of the Private Placement Warrants will not be transferable, assignable or salable until 30 days after the completion of the Business Combination (except pursuant to limited exceptions to the Company’s officers and directors and other persons or entities affiliated with the initial purchasers of the Private Placement Warrants) and they will not be redeemable by the Company (except as described below under “Redemption of warrants for Class A ordinary shares when the price per common share equals or exceeds $10.00”) so long as they are held by the Sponsor or its permitted transferees. The Sponsor, or its permitted transferees, has the option to exercise the Private Placement Warrants on a cashless basis. If the Private Placement Warrants are held by holders other than the Sponsor or its permitted transferees, the Private Placement Warrants will be redeemable by the Company and exercisable by the holders on the same basis as the Public Warrant.
The Company evaluated the Public Warrants and Private Placement Warrants for liability or equity classification in accordance with the provisions of ASC 480,
Distinguishing Liabilities from Equity, and ASC
815-40,
 Derivatives and Hedging
. Based on the provisions governing the warrants in the applicable agreement, the Company determined that the Private Placement Warrants met the criteria and were required to be classified as a liability subject to the guidance in ASC 815-10 and 815-40 and should effectively be treated as outstanding common shares in both basic and diluted EPS calculations. As the surviving entity following the Business Combination has a single class of shares issued and outstanding, the Public Warrants are classified as equity, with the fair value of the Public Warrants as of the date of the Business Combination closed to additional paid-in capital.
Initial Measurement
The KORE Warrants were initially measured at fair value. The estimated fair value of the warrants prior to entering into an Agreement and Plan of Merger with CTAC on March 12, 2021, was determined to be a Level 3 fair value measurement. The fair value of each KORE Warrant was approximately the fair value per share of common stock. The aforementioned warrant liabilities related to KORE Warrants are not subject to qualified hedge accounting.
The Public and Private Placement Warrants were initially measured at fair value. The fair value of the Public Warrants as of September 30, 2021, based on the closing price of KORE.WS, was closed to additional
paid-in
capital and the fair value will not need to be remeasured in subsequent reporting periods. As the transfer of Private Placement Warrants to anyone outside of a small group of individuals who are permitted transferees would result in the Private Placement Warrants having substantially the same terms as the Public Warrants, the Company determined that the fair value of each Private Placement Warrant is equivalent to that of each Public Warrant, with an insignificant adjustment for short-term marketability restrictions. As such, the Private Placement Warrants are classified as Level 2.
As of December 31, 2021, the aggregate value of the Private Placement Warrants was $0.3 million based on the closing price of KORE.WS on that date of $1.05.

Subsequent Measurement
The KORE Warrants were converted to common stock through the Business Combination and are no longer outstanding. The Private Placement Warrants are measured at fair value on a recurring basis based on the closing price of KORE.WS on the relevant date. The Public Warrants are equity classified not requiring subsequent measurement.
The change in fair value of the warrant liability for the years ended December 31
, 2021
, 2020
and 2019
was $(5.3)
million, $7.5
 million and $0.2
 million, respectively.
NOTE 16
NET LOSS PER SHARE
The Company follows the two
-class method when computing net loss per common share when shares are issued that meet the definition of participating securities. The two
-class method requires income available to common shareholders for the period to be allocated between common and participating securities based upon their respective rights to receive dividends as if all income for the period had been distributed. The two
-class method also requires losses for the period to be allocated between common and participating securities based on their respective rights if the participating security contractually participates in losses. As holders of participating securities do not have a contractual obligation to fund losses, undistributed net losses are not allocated to Series A, Series A-1
, Series B and Series C preferred shares for
 
9
1

Table of Contents
purposes of the loss per share calculation. Earnings per share calculations for all periods
prior
to the Business Combination have been retrospectively restated to the equivalent number of shares reflecting the exchange ratio established in the merger agreement. Certain of the Company’s preferred shares have contractual rights that allow them to receive a premium upon conversion of the company’s preferred shares into the Company’s Common stock. For the year ended December 31, 2021, the Company incurred
 
$4,074
of premiums on conversion of the Company’s preferred shares into common shares. Refer to “Note 13—Temporary Equity and Stockholder’s Equity” to the consolidated financial statements for further detail regarding the contractual rights of the Company’s preferred shares. 
Presented in the table below is a reconciliation of the numerator and denominator for the basic and diluted earnings per share (“EPS”) calculations for the periods ended:
 
(in ‘000)
  
December 31, 2021
 
 
December 31, 2020
 
 
December 31, 2019
 
Numerator:


Net loss attributable to the Company
  
$
(24,453
 ) $
 
 
(35,201
 ) $
 
 
(23,443
Less cumulative earnings to preferred

shareholder
  
 
(22,822
 
 
(26,900
 
 
(21,647
Add premium on preferred conversion to
common shares
  
 
4,074


—  


—  


Net income (loss) attributable to common
stockholders
  
 
(43,201
 
 
(62,101
 
 
(45,090
Denominator:


Weighted average common shares and
warrants outstanding


Basic (in number)
  
 
41,933,050


31,650,173


31,169,435
 
Diluted (in number)
  
 
41,933,050


31,650,173


31,169,435
 
Net loss per unit attributable to common
stockholder


Basic
  
$
(1.03
)
 
$
(1.96
)
 
$
(1.45
Diluted
  
$
(1.03
)
 
$
(1.96
)
 
$
(1.45
The following securities were not included in
the
computation of diluted shares outstanding because the effect would be anti-dilutive:
 
For the years ended
(number of shares)
  
December 31,
2021
 
  
December 31,
2020
 
  
December 31,
2019
 
Series C Convertible Preferred Stock
  
 
2,566,186


2,566,186


2,566,186
 
Stock Options
  
 
432,500


432,500


399,151
 
Common stock issued under the Backstop Agreement
  
 
9,600,031


—  


—  
 
NOTE 17 – RELATED PARTY TRANSACTIONS
Leasing and Professional Services Agreement
KORE TM Data Brasil Processamento de Dados Ltda., a wholly owned subsidiary of the Company, maintains a lease and a professional services agreement with a company controlled by a key member of the subsidiary’s management team.
Aggregated related party transactions, which have been recorded at the exchange amount, representing the amount of consideration established and agreed by the related parties, was $0.2 million, $0.2 million, and $0.3 million for the years ended December 31, 2021, 2020 and 2019, respectively. The amount was recorded under general and administrative expenses in the consolidated statements of operations.
Due to Related Parties
Upon the closing of the Business Combination on September 30
, 2021
, the Company repaid its outstanding loans of $1.6 million due to Interfusion B.V and T-Fone B.V., companies related though common ownership resulting from the acquisition of Aspider in 2018
.
 
9
2

Table of Contents
The following is a summary of the amounts recorded under due to related parties in the consolidated balance sheets at December 31, 2021 and 2020:
 
(in ‘000)
  
December 31,
2021
 
  
December 31,
2020
 
Interfusion B.V.


985
 
T-Fone
B.V.


630
 
Interest was accrued quarterly, at a fixed rate of 2.5%. The Company accrued interest of $0.03 and $0.04 million for the years ended December 31, 2021 and 2020, respectively.
As of December 31, 2021, the Company has paid all related party transactions resulting from the Business Combination.
NOTE 18 – SUBSEQUENT EVENTS
The Company has completed an evaluation of all subsequent events through March 29, 2022 to ensure that these consolidated financial statements include appropriate disclosure of events both recognized in the consolidated financial statements and events which occurred but were not recognized in the consolidated financial statements. Except as described below, the Company has concluded that no subsequent event has occurred that requires disclosure.
Stock-Based Compensation
On January 4, 2022, the Company issued Restricted Stock Units (RSUs) pursuant to the 2021 Long-Term Stock Incentive Plan that include only service conditions, RSU’s that include only performance-based conditions and RSU’s that includes both service and performance-based conditions.
The Company issued approximately 3.1 million RSUs with only service conditions, up to approximately 0.8 million RSUs with both service and performance-based conditions and up to approximately 0.8 million RSUs with only performance-based conditions.
The maximum estimated fair value the Company expects to recognize related to RSU’s with only service conditions is $21.7 million, over the vesting term (the next four
years). The maximum estimated fair value the Company expects to recognize related to RSU’s that include performance-based conditions (including those that include service and performance-based conditions is approximately $11.6 million, respectively over the requisite service period of the RSUs.
Business
Acquisitions
On February 16
, 2022
, the Company acquired 100%
of the
outstanding s
hare capital of Business Mobility Partners, Inc. and Simon IoT LCC, collectively, the “Acquired Companies” which are industry-leading mobility service providers, to expand the Company’s services and solutions within the healthcare and life sciences industries (the “BMP Business Combination Agreement”).
The transaction was funded by available cash and the issuance of the Company’s shares. Estimated transaction costs for legal, consulting, accounting, and other related costs to be incurred in connection with the acquisition of the Acquired Companies are expected to be $1.7
 million.
The following table summarizes the preliminary allocation of the consideration transferred for the Acquired Companies, including the identified assets acquired and liabilities assumed as of the Acquisition Date. The purchase price allocation is preliminary and is subject to revision as additional information about the fair value of the assets acquired and liabilities assumed, including working capital, acquired intangibles and deferred income taxes, become available.
 
(in thousands)


Cash, including closing cash and working capital adjustments
  
$
47,336
 
Fair value of KORE common stock issued to sellers (4,212,246 shares)
  
 
23,294


Total consideration
  
$
70,630
 
Assets acquired:


Cash
  
 
1,996
 
Accounts receivable
  
 
3,115
 
Inventories
  
 
1,323
 
Prepaid expenses and other receivables
  
 
821
 
Property and equipment
  
 
201
 
Intangible assets
  
 
30,060
 
Total Assets acquired
 
 
37,516
 
Liabilities assumed:


Deferred tax liabilities
  
 
7,611
 
Accounts payable and accrued liabilities
  
 
2,607
 
Liabilities assumed
 
 
10,218


Net identifiable assets acquired
  
 
27,298


Goodwill (excess of consideration transferred over net identifiable assets acquired)
  
$
43,332


9
3

Table of Contents
Goodwill represents the future economic benefits that
we expect
to achieve as a result of the acquisition of the Acquired Companies. A portion of the goodwill resulting from the acquisition is deductible for tax purposes.
The BMP Business Combination Agreement contains customary indemnification terms. Under the BMP Business Combination Agreement, a portion of the cash purchase price, approximately $3.45 million paid at closing is being held in escrow, for a maximum of 18 months from the closing date, to guarantee performance of general representations and warranties regarding closing amounts and to indemnify the Company against any future claims.
As of the date of this filing, it was not practical for the Company to report the pro forma financial information under ASC 805 for the Acquired Companies due to the timing of the acquisition and the number of judgements involved in preparing the pro forma financial information, including estimating the useful lives of the Acquired Companies intangible assets and converting the Acquired Companies historical results from the cash basis of accounting to the accrual basis of accounting.
 
94

Table of Contents
Financial Statement Schedule
(in thousands USD, except share and per share amounts)
SCHEDULE I – PARENT ONLY FINANCIAL INFORMATION
The following presents condensed parent company only financial information of
KORE
Group Holdings, Inc.
Condensed Balance Sheet (in thousands USD)


December 31,
2021
 
 
December 31,
2020
 
Assets


Non-current
assets


Investment in subsidiaries
  
$
261,012
 
 
$
300,055


Total
non-current
assets
  
 
261,012


300,055


Total assets
  
$
261,012
 
 
$
300,055


Liabilities, temporary equity and stockholders’ equity


Long-term liabilities


Warrant liability
  
$
286
 
 
$
15,944


Total liabilities
  
 
286


15,944


Temporary equity


Series A Preferred Stock; par value $1,000 per share; none authorized, issued and outstanding at December 31, 2021; 7,765,229 shares authorized, and 7,756,158 shares issued and outstanding at December 31, 2020


77,562


Series A-1 Preferred Stock; par value $1,000 per share; none authorized, issued and outstanding at December 31, 2021; 10,480,538 shares authorized, 7,862,107 shares issued and outstanding at December 31, 2020


78,621


Series B Preferred Stock; par value $1,000 per share; none authorized, issued and outstanding at December 31, 2021; 9,090,975 shares authorized, 9,090,975 shares issued and outstanding at December 31, 2020


90,910


Series C Convertible Preferred Stock; par value $1,000 per share; none authorized, issued and outstanding at December 31, 2021; 6,872,894 shares authorized, 2,566,186 shares issued and outstanding at December 31, 2020


16,802


Total temporary equity


263,895


Stockholders’ equity


Common stock, voting; par value $0.0001 per share; 315,000,000 shares authorized, 72,027,743 shares issued and outstanding at December 31, 2021; 55,659,643 shares authorized, 30,281,520 shares issued and outstanding at December 31, 2020
  
 
7


3
 
Additional
paid-in
capital
  
 
401,688


135,616
 
Accumulated other comprehensive loss
  
 
(3,331
 
 
(1,677
Accumulated deficit
  
 
(137,638
 
 
(113,726


Total stockholders’ equity
  
 
260,726


20,216


Total liabilities, temporary equity and stockholders’ equity
  
$
261,012
 
 
$
300,055


95

Table of Contents
Condensed Statements of Loss and Comprehensive Loss (in thousands
USD)
 
For the years ended
  
December 31,
2021
 
 
December 31,
2020
 
 
December 31,
2019
 
Equity in net loss of
unconsolidated 
subsidiaries
  
$
(29,177
 
$
(27,716
 
$
(23,678
Change in fair value of warrant liability
  
 
(5,267
 
 
7,485


(235


Loss before income taxes
  
 
(23,910
 
 
(35,201
 
 
(23,443


Net loss
  
$
(23,910
 
$
(35,201
 
$
(23,443


Other comprehensive loss:


Foreign currency translation adjustment
  
 
(1,654
 
 
2,116


517


Comprehensive loss
  
$
(25,564
 
$
(33,085
 
$
(22,926


96

Table of Contents
Condensed Statements of Cash Flows (in thousands USD)
 
For the years ended
  
December 31,
2021
 
 
December 31,
2020
 
 
December 31,
2019
 
Cash flows from operating activities


Net loss
  
$
(23,910
 
$
(35,201
 
$
(23,443
Adjustments to reconcile net loss to net cash provided by operating activities


—  


—  
 
Equity in net loss of unconsolidated subsidiaries
  
 
29,177


27,716


23,678
 
Change in fair value of warrant liability
  
 
(5,267
 
 
7,485


(235


Cash provided by operating activities
  
$


$


$


Cash flows from investing activities


Distribution from subsidiary
  
 
5,947


200


80


Cash provided by investing activities
  
$
5,947
 
 
$
200
 
 
$
80
 
Cash flows from financing activities


Repurchase of common stock


(200
 
 
(80
Issuance of common stock, net of transaction costs
  
 
223,968


—  


—  
 
Settlement of preferred stock
  
 
(229,915
 
 
—  


—  


Cash used in financing activities
  
$
(5,947
 
$
(200
 
$
(80
)
Effect of exchange rate change on cash and cash equivalents


Change in cash and cash equivalents and restricted cash


Cash and cash equivalents and restricted cash, beginning of
 
year


Cash and cash equivalents and restricted cash, end of year
  
$


$


$


Non-cash
investing and financing activities:


Equity issued for acquisition of Integron, LLC
  
$


$


$
7,000


Share-based payment awards issued to employees of subsidiaries
  
$
1,839
 
 
$
1,161
 
 
$
1,682


97

Table of Contents
 
(i)
Basis of presentation and business combination
On March 12, 2021, Maple Holdings Inc. (“Maple” or “pre-combination KORE”) entered into a definitive merger agreement (the “Business Combination”) with Cerberus Telecom Acquisition Corp. (NYSE: CTAC) (“CTAC”). On September 29, 2021, CTAC held a special meeting, at which CTAC’s shareholders voted to approve the proposals outlined in the proxy statement filed by CTAC with the Securities Exchange Commission (the “SEC”) on August 13, 2021, including, among other things, the adoption of the Business Combination and approval of the other transactions contemplated by the merger agreement. On September 30, 2021 (the “Closing Date”), as contemplated by the merger agreement,
(i) CTAC merged with and into King LLC Merger Sub, LLC (“LLC Merger Sub”) (the “Pubco Merger”), with LLC Merger Sub being the surviving entity of the Pubco Merger and King Pubco, Inc. (“Pubco”) as parent of the surviving entity, (ii) immediately prior to the First Merger (as defined below), Cerberus Telecom Acquisition Holdings, LLC (the “Sponsor”) contributed 100% of
 
its equity interests in King Corp Merger Sub, Inc. (“Corp Merger Sub”) to Pubco (the “Corp Merger Sub Contribution”), as a result of which Corp Merger Sub became a wholly owned subsidiary of Pubco, (iii) following the Corp Merger Sub Contribution, Corp Merger Sub merged with and Maple into (the “First Merger”), with Maple being the surviving corporation of the First Merger, and (iv) immediately following the First Merger and as part of the same overall transaction as the First Merger, Maple merged with and into LLC Merger Sub (the “Second Merger” and, together with the First Merger, being collectively referred to as the “Mergers” and, together with the other transactions contemplated by the merger agreement, the “Transactions” and the closing of the Transactions, the Business Combination), with LLC Merger Sub being the surviving entity of the Second Merger and Pubco being the sole member of LLC Merger Sub. In connection with the Business Combination, Pubco changed its name to “KORE Group Holdings, Inc.” (the “Company”). The combined Company remained listed on the NYSE under the new ticker symbol “KORE.”
The Business Combination is accounted for as a reverse recapitalization as pre-combination KORE was determined to be the accounting acquirer and CTAC was treated as the “acquired” company for accounting purposes under FASB’s ASC Topic 805, Business Combination (“ASC 805”). Pre-combination KORE was determined to be the accounting acquirer based on the evaluation of the following facts and circumstances:


the equity holders of pre-combination KORE hold the majority (54%) of voting rights in the Company;


the senior management of
pre-combination
KORE became the senior management of the Company;


in comparison with CTAC,
pre-combination
KORE has significantly more revenues and total assets and a larger net loss; and


the operations of pre-combination KORE comprise the ongoing operations of the Company, and the Company assumed pre-Combination KORE’s headquarters.
Accordingly, for accounting purposes, the financial statements of the Company represent a continuation of the financial statements of pre-combination KORE with the acquisition being treated as the equivalent of pre-combination KORE issuing stock for the net assets of CTAC, accompanied by a recapitalization. The net assets of CTAC were stated at historical cost, with no goodwill or other intangible assets recorded. Pre-combination KORE was deemed to be the predecessor and the consolidated assets and liabilities and results of operations prior to September 30, 2021 are those of pre-combination KORE.
In the condensed parent-company-only financial statements, the Company’s investment in subsidiaries is stated at cost plus equity in undistributed earnings of subsidiaries since the subsidiaries were originally acquired. The Company’s share of net loss of its subsidiaries is included in the condensed statements of loss and comprehensive loss using the equity method of accounting. These condensed parent-company-only financial statements should be read in connection with the consolidated financial statements and notes thereto of KORE Group Holdings, Inc. and subsidiaries.
As of December 31, 2021, the Company has no purchase commitment, capital commitment and operating lease commitments. The Company is the guarantor of indebtedness for certain of its subsidiaries.
 

(ii)
Restricted Net Assets
Schedule
 
I of Rule 5
-04
of Regulation S-X requires the condensed financial information of a registrant to be filed when the restricted net assets of the registrant’s subsidiaries exceed 25
 percent of the registrant’s consolidated net assets as of the end of the most recently completed fiscal year. For purposes of this test, restricted net assets of the consolidated subsidiaries means the amount of the registrant’s proportionate share of net assets of the consolidated subsidiaries (after intercompany eliminations) which as of the end of the most recent fiscal year may not be transferred to the parent company by subsidiaries in the form of loans, advances or cash dividends without the consent of a third party (e.g., lender, regulatory agency, foreign government).
 
9
8

Table of Contents
The condensed parent company financial statements have been prepared in accordance with Rule 12
-04
, Schedule I of Regulation
S-
X as the restricted net assets of the Company’s subsidiaries exceed 25% of the Company’s consolidated net assets. The Company is a holding company that conducts substantially all its business operations through its subsidiaries. The Company’s ability to pay dividends on the Company’s preferred and common stock is limited by restrictions on the ability of the Company and its subsidiaries to pay dividends or make distributions under the terms of agreements governing the indebtedness of the Company’s subsidiaries. Subject to the full terms and conditions under the agreements governing its indebtedness, the Company and its subsidiaries may be permitted to make dividends and distributions under such agreements if there is no
event of default and certain
pro-forma
financial ratios (as defined by such agreements) are met.
 
99

Table of Contents
ITEM 9.
CHANGES IN AND DISAGREEMENTS WITH ACCOUNTANTS ON ACCOUNTING AND FINANCIAL DISCLOSURE
None.
 
ITEM 9A.
CONTROLS AND PROCEDURES
Evaluation of disclosure controls and procedures
Our management, with the participation of our Chief Executive Officer and our Chief Financial Officer, evaluated, as of the end of the period covered by this Annual Report on Form
10-K,
the effectiveness of our disclosure controls and procedures (as defined in Rules
13a-15(e)
and
15d-15(e)
under the Exchange Act). Disclosure controls and procedures are controls and other procedures that are designed to ensure that information required to be disclosed in our reports filed or submitted under the Exchange Act is recorded, processed, summarized and reported, within the time periods specified in the SEC’s rules and regulations. Disclosure controls and procedures include controls and procedures designed to ensure that information required to be disclosed in our reports filed under the Exchange Act is accumulated and communicated to management, including our Chief Executive Officer and our Chief Financial Officer, to allow timely decisions regarding required disclosure.
Based on the evaluation of our disclosure controls and procedures, our Chief Executive Officer and our Chief Financial Officer concluded that our disclosure controls and procedures were not effective as of December 31, 2021, due to the material weaknesses in our internal control over financial reporting described below. In light of this fact, our management has performed additional analyses, reconciliations, and other post-closing procedures and has concluded that, notwithstanding the material weaknesses in our internal control over financial reporting, the consolidated financial statements for the periods covered by and included in this Annual Report on Form
10-K
fairly present, in all material respects, our financial position, results of operations and cash flows for the periods presented in conformity with U.S. GAAP.
Management’s annual report on internal control over financial reporting
This Annual Report on Form
10-K
does not include a report of management’s assessment regarding our internal control over financial reporting (as defined in Rules
13a-15(f)
and
15d-15(f)
under the Exchange Act) or an attestation report of our independent registered accounting firm due to a transition period established by rules of the SEC for newly public companies. Additionally, our independent registered accounting firm will not be required to opine on the effectiveness of our internal control over financial reporting pursuant to Section 404 until we are no longer an “emerging growth company” as defined in the JOBS Act.
Management has determined that the Company continues to have material weaknesses in its internal control over financial reporting as follows:


Entity-Level Controls -
 Management did not maintain appropriately design entity-level controls impacting the (1) control environment, (2) risk assessment procedures, including those related to fraud, and (3) monitoring activities to prevent or detect material misstatements to the financial statements and assess whether the components of internal control were present and functioning. These deficiencies were primarily attributed to an insufficient number of qualified personnel and resources, improper segregation of duties, and lack of formalized policies, procedures, and related controls to support and provide proper oversight and accountability over the performance of controls.


Financial Close Process
 - Management did not design and maintain effective control activities over certain routine aspects of financial reporting. Specifically, management did not design and maintain effective controls over (i) the financial reporting process, including management review controls over key disclosures and financial statement support schedules, (ii) the monthly financial close process, including the review of journal entries, account reconciliations, and analysis of recorded balances, and (iii) the completeness and accuracy of information used by control owners in the operation of certain controls.


Non-routine
and Complex Transactions
- Management did not design and maintain effective control activities over certain
non-routine
and/or complex aspects of financial reporting. Specifically, management did not design and maintain effective (i) controls over the identification, accounting, and review of
non-routine
and complex transactions, and (ii) management review controls over complex areas of accounting such as revenue, income taxes, and complex financial instruments, at an appropriate level of precision to detect a material misstatement and sufficient appropriate evidence was not maintained to support the execution and evaluation of the controls performed, including the review of the completeness and accuracy of the source data utilized and the appropriateness of assumptions used by the control owner.


Procure to pay –
Management did not design and maintain effective controls over the procure to pay cycle. Specifically, management did not implement requirements over the approval of purchase orders and subsequent general ledger account coding to ensure payments are properly and timely approved, paid and recorded in the general ledger
.
 
100

Table of Contents
 
 
Information Technology General Controls –
Management did not design and maintain effective general controls over information systems that support the financial reporting process. Specifically, management did not design and maintain effective (i) program change management and program development controls for financial systems, including master databases, relevant to our financial reporting, (ii) logical user access controls to ensure appropriate segregation of duties and adequate restrictions of users, including those with privileged access, and (iii) controls related to critical data interfaces, data backups, and restorations.
Remediation Plan
We have begun the process of, and we are focused on, designing and implementing effective internal control measures to improve our internal control over financial reporting and remediate the material weaknesses. Our internal control remediation efforts include the following:


We hired additional qualified accounting resources and outside resources to segregate key functions within our financial and information technology processes supporting our internal controls over financial reporting and to provide appropriate oversight and accountability over the performance of our internal controls.


We are in the process of reassessing and formalizing the design of certain accounting and information technology policies relating to security and change management controls.


We engaged an outside firm to assist management with (i) reviewing our current processes, procedures, and systems and assessing the design of controls to identify opportunities to enhance the design of controls that would address relevant risks identified by management, and (ii) enhancing and implementing protocols to retain sufficient documentary evidence to support the operating effectiveness of such controls.


We plan to implement an application solution to enhance controls over inventory management and reporting.
In addition to implementing and refining the above activities, we expect to engage in additional remediation activities in fiscal year 2022, including:


Continuing to enhance and formalize our accounting, business operations, and information technology policies, procedures, and controls to achieve complete, accurate, and timely financial accounting, reporting and disclosures.


Continuing to hire additional qualified accounting resources and utilize outside resources, where necessary.


Completing the implementation of new financial processing systems to replace legacy systems and establish effective general controls over these systems to ensure that our automated process level controls and information produced and maintained in our IT systems is relevant and reliable.


Designing and implementing controls that address the completeness and accuracy of underlying data used in the performance of controls over accounting transactions and disclosures.


Developing monitoring controls and protocols that will allow us to timely assess the design and the operating effectiveness of controls over financial reporting and make necessary changes to the design of controls, if any.


Reviewing the existing procure to pay cycle and implementing design enhancements to make the process more efficient and effective.
While we believe that these efforts will improve our internal control over entity level controls, financial reporting including inventory, procure to pay process and ITGC’s, the design and implementation of our remediation is ongoing and will require validation and testing of the design and operating effectiveness of our internal controls over a sustained period of financial reporting cycles. The actions that we are taking are subject to ongoing senior management review. We will not be able to conclude whether the steps we are taking will fully remediate the material weakness in our internal control over financial reporting until we have completed our remediation efforts and subsequent evaluation of their effectiveness.
 
101

Table of Contents
Limitations on effectiveness of controls and procedures
The effectiveness of our disclosure controls and procedures and our internal control over financial reporting is subject to various inherent limitations, including cost limitations, judgments used in decision making, assumptions about the likelihood of future events, the soundness of our systems, the possibility of human error, and the risk of fraud. Moreover, projections of any evaluation of effectiveness to future periods are subject to the risk that controls may become inadequate because of changes in conditions and the risk that the degree of compliance with policies or procedures may deteriorate over time. Because of these limitations, there can be no assurance that any system of disclosure controls and procedures or internal control over financial reporting will be successful in preventing all errors or fraud or in making all material information known in a timely manner to the appropriate levels of management.
Changes in internal control over financial reporting
As part of our remediation plan discussed above, we continued formalizing documentation of policies and procedures and evaluating the implementation of new and existing controls during the quarter ended December 31, 2021. Such remediation actions were changes in our internal control over financial reporting identified in connection with the evaluation required by Rule
13a-15(d)
and
15d-15(d)
of the Exchange Act that occurred during the three months ended December 31, 2021 that have materially affected, or are reasonably likely to materially affect, our internal control over financial reporting.
 
ITEM 9B.
OTHER INFORMATION
None.
 
ITEM 9C.
DISCLOSURE REGARDING FOREIGN JURISDICTIONS THAT PREVENT INSPECTIONS.
Not applicable.
 
102

Table of Contents
PART III.
 
ITEM 10.
DIRECTORS, EXECUTIVE OFFICERS AND CORPORATE GOVERNANCE
Information appearing in our Proxy Statement to be filed by April 30, 2022 (the “Proxy Statement”) under the captions “2021 Directors, Executive Officers and Corporate Governance,” is incorporated by reference herein.
Code of Ethics
We have a code of ethics that applies to all of our executive officers, directors and employees, including our principal executive officer, principal financial officer, principal accounting officer or controller or persons performing similar functions. The code of ethics is available on our website, www.korewireless.com. We intend to make any legally required disclosures regarding amendments to, or waivers of, provisions of our code of ethics on its website rather than by filing a Current Report on Form
8-K.
Corporate Governance Guidelines
We have corporate governance guidelines in accordance with the corporate governance rules of the NYSE that serve as a flexible framework within which our board of directors and its committees operate. These guidelines cover a number of areas including board membership criteria and director qualifications, director responsibilities, board agenda, roles of the chairman of the board, chief executive officer and presiding director, meetings of independent directors, committee responsibilities and assignments, board member access to management and independent advisors, director communications with third parties, director compensation, director orientation and continuing education, evaluation of senior management and management succession planning. The corporate governance guidelines will be available on our website, www.korewireless.com.
 
ITEM 11.
EXECUTIVE COMPENSATION
Information appearing in our Proxy Statement to be filed by April 30, 2022 (the “Proxy Statement”) under the captions “2021 Director Compensation Table” and “Executive Compensation” is incorporated by reference herein.
 
ITEM 12.
SECURITY OWNERSHIP OF CERTAIN BENEFICIAL OWNERS AND MANAGEMENT AND RELATED STOCKHOLDER MATTERS
Information regarding security ownership of certain beneficial owners and management appearing in our Proxy Statement under the captions “Stock Ownership Information” and “Equity Compensation Plan Information” is incorporated by reference herein.
 
ITEM 13.
CERTAIN RELATIONSHIPS AND RELATED PERSON TRANSACTIONS, AND DIRECTOR INDEPENDENCE
Information regarding certain relationships and related transactions appearing in our Proxy Statement under the captions “Related Person Transactions” and “Director Independence” is incorporated by reference herein.
 
ITEM 14.
PRINCIPAL ACCOUNTANT FEES AND SERVICES
Information regarding principal accountant fees and services appearing in our Proxy Statement under the caption “Audit” is incorporated by reference herein.
 
103

Table of Contents
PART IV.
 
ITEM 15.
EXHIBITS AND FINANCIAL STATEMENT SCHEDULES
(a) Documents filed as part of this Report.
(a)(1) Index to financial statements and supplementary data filed as part of this Report.
Our consolidated financial statements are listed in the “Index to Consolidated Financial Statements” under Part II, Item 8 of this Annual Report on
Form 10-K.
(a)(2) Financial Statement Schedules.
All financial statement schedules have been omitted because they are not applicable, not material or the required information is shown in Part II, Item 8 of this Annual Report on
Form 10-K.
(a)(3) Exhibits.
The following is a list of exhibits filed as part of this Annual Report on Form
10-K.
 
Exhibit
Number
  
Description
  2.1
  
  2.2
  
  2.3
  
  3.1
  
  3.2
  
  4.1
  
  4.2
  
  4.3
  
  4.4
  
10.1
  
10.2
  
10.3
  
10.4
  
10.5
  
10.6
  
10.7
  
 
104

Table of Contents
10.8
  
10.9
  
10.10
  
10.11
  
21.1
  
23.1
  
31.1
  
31.2
  
32.1
  
32.2
  
 
ITEM 16.
FORM
10-K
SUMMARY
None.
 
105

Table of Contents
SIGNATURES
Pursuant to the requirements of Section 13 or 15(d) of the Securities Exchange Act of 1934, the Registrant has duly caused this Report to be signed on its behalf by the undersigned, thereunto duly authorized.
Date: March 29, 2022
 
KORE GROUP HOLDINGS, INC.
By:
 
/s/ Romil Bahl
Romil Bahl
President, Chief Executive Officer and Director
Pursuant to the requirements of the Securities Exchange Act of 1934, this Report has been signed below by the following persons on behalf of the Registrant in the capacities and on the dates indicated.
 
Signature
  
Title
 
Date


/s/ Romil Bahl
  
President, Chief Executive Officer and Director
 
March 29, 2022
Romil Bahl
  
(Principal Executive Officer)
 
/s/ Paul Holtz
  
EVP, Chief Financial Officer and Treasurer
 
March 29, 2022
Paul Holtz
  
(Principal Financial Officer and Principal Accounting Officer)
 
/s/ Cheemin
Bo-Linn
  
Director
 
March 29, 2022
Cheemin
Bo-Linn
  
 
/s/ Timothy Donahue
  
Director
 
March 29, 2022
Timothy Donahue
  
 
/s/ H. Paulett Eberhart
  
Director
 
March 29, 2022
H. Paulett Eberhart
  
 
/s/ James Geisler
  
Director
 
March 29, 2022
James Geisler
  
 
/s/ Robert P. MacInnis
  
Director
 
March 29, 2022
Robert P. MacInnis
  
 
/s/ Mark Neporent
  
Director
 
March 29, 2022
Mark Neporent
  
 
/s/ Michael K. Palmer
  
Director
 
March 29, 2022
Michael K. Palmer
  
 
/s/ Tomer
Yosef-Or
  
Director
 
March 29, 2022
Tomer
Yosef-Or


106