Exhibit 99.1

Business Update January 2022
Exhibit 99.1

Business Update January 2022
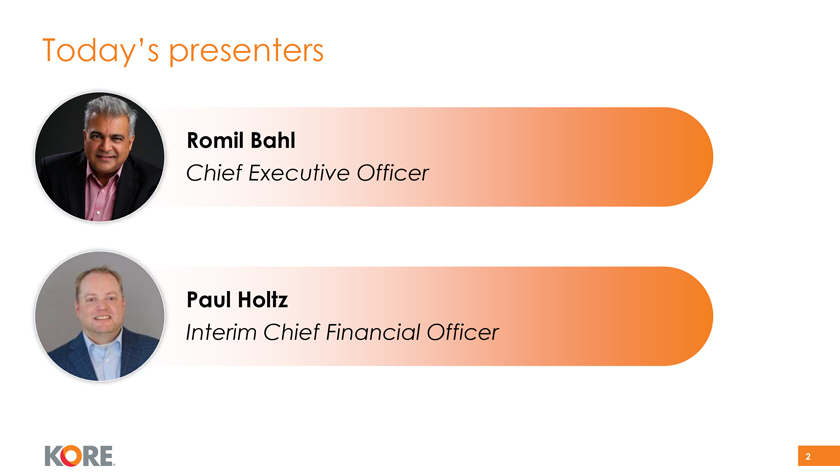
Today’s presenters Romil Bahl Chief Executive Officer Paul Holtz Interim Chief Financial Officer 2

Agenda 1. Business overview 2. Key credit highlights 3. Financial update 3

Business Overview
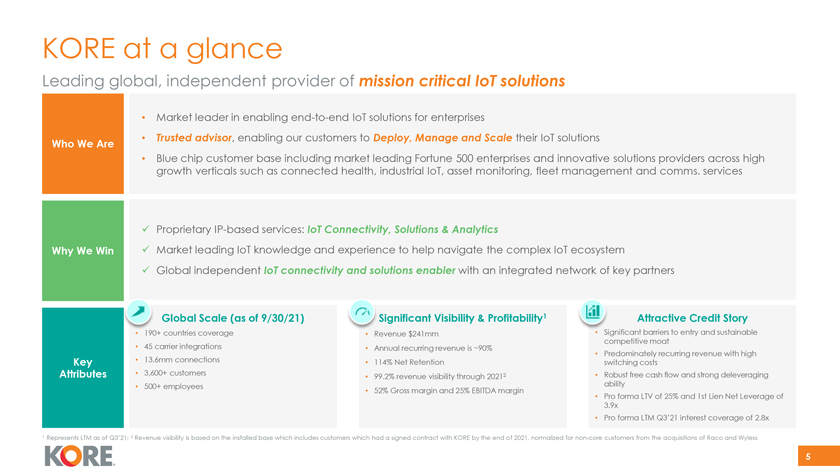
KORE at a glance Leading global, independent provider of mission critical IoT solutions • Market leader in enabling end-to-end IoT solutions for enterprises • Trusted advisor, enabling our customers to Deploy, Manage and Scale their IoT solutions Who We Are • Blue chip customer base including market leading Fortune 500 enterprises and innovative solutions providers across high growth verticals such as connected health, industrial IoT, asset monitoring, fleet management and comms. services  Proprietary IP-based services: IoT Connectivity, Solutions & Analytics Why We Win Market leading IoT knowledge and experience to help navigate the complex IoT ecosystem  Global independent IoT connectivity and solutions enabler with an integrated network of key partners Global Scale (as of 9/30/21) Significant Visibility & Profitability1 Attractive Credit Story • 190+ countries coverage • Revenue $241mm • Significant barriers to entry and sustainable competitive moat • 45 carrier integrations • Annual recurring revenue is ~90% revenue with • Predominately recurring high Key • 13.6mm connections • 114% Net Retention switching costs Attributes • 3,600+ customers 99.2% revenue through 20212 • Robust free cash flow and strong deleveraging • visibility ability • 500+ employees • 52% Gross margin and 25% EBITDA margin • Pro forma LTV of 25% and 1st Lien Net Leverage of 3.9x • Pro forma LTM Q3’21 interest coverage of 2.8x 1 Represents LTM as of Q3’21; 2 Revenue visibility is based on the installed base which includes customers which had a signed contract with KORE by the end of 2021, normalized for non-core customers from the acquisitions of Raco and Wyless 5
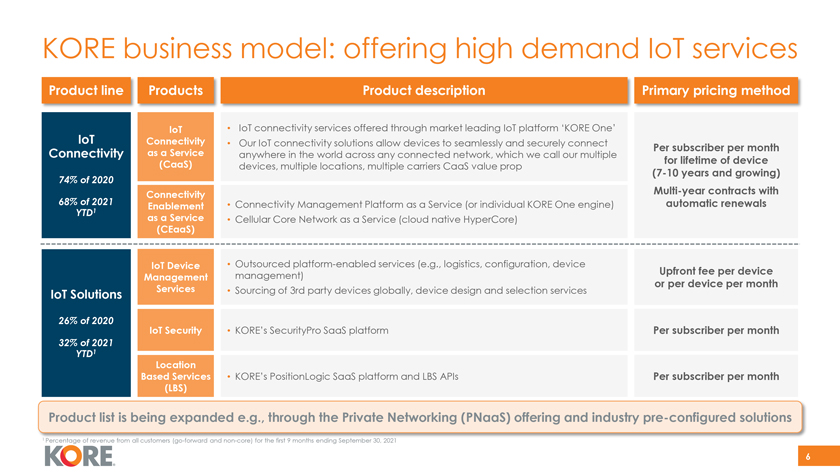
KORE business model: offering high demand IoT services Product line Products Product description Primary pricing method IoT IoT • IoT connectivity services offered through market leading IoT platform ‘KORE One’ Connectivity • Our IoT connectivity solutions allow devices to seamlessly and securely connect Per subscriber per month Connectivity as a Service anywhere in the world across any connected network, which we call our multiple (CaaS) for lifetime of device devices, multiple locations, multiple carriers CaaS value prop (7-10 years and growing) 74% of 2020 Connectivity Multi-year contracts with 68% of 2021 Enablement • Connectivity Management Platform as a Service (or individual KORE One engine) automatic renewals YTD1 as a Service • Cellular Core Network as a Service (cloud native HyperCore) (CEaaS) IoT Device • Outsourced platform-enabled services (e.g., logistics, configuration, device management) Upfront fee per device Management or per device per month IoT Solutions Services • Sourcing of 3rd party devices globally, device design and selection services 26% of 2020 Security SecurityPro SaaS platform IoT • KORE’s Per subscriber per month 32% of 2021 YTD1 Location Based Services • KORE’s PositionLogic SaaS platform and LBS APIs Per subscriber per month (LBS) Product list is being expanded e.g., through the Private Networking (PNaaS) offering and industry pre-configured solutions 1 Percentage of revenue from all customers (go-forward and non-core) for the first 9 months ending September 30, 2021 6
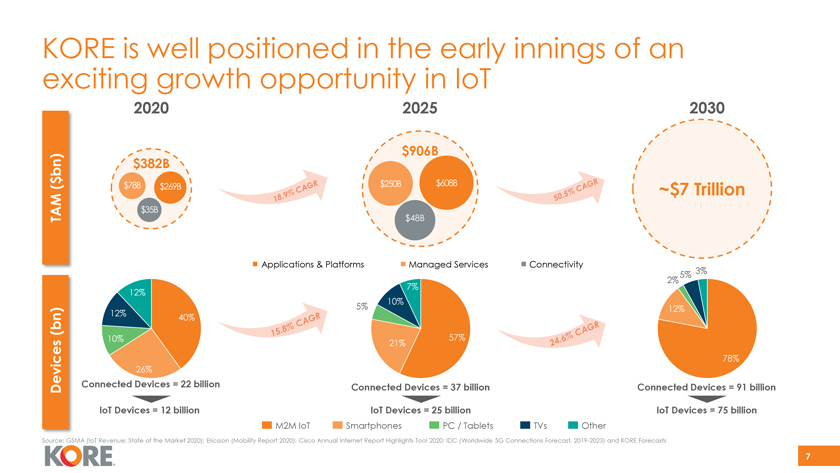
KORE is well positioned in the early innings of an exciting growth opportunity in IoT 2020 2025 2030 $906B bn) $382B ( $ $78B $250B $608B $269B ~$7 Trillion TAM $35B $48B Applications & Platforms Managed Services Connectivity 5% 3% 2% 7% 12% 10% 5% 12% 12% (bn) 40% 10% 21% 57% 78% 26% Devices Connected Devices = 22 billion Connected Devices = 37 billion Connected Devices = 91 billion IoT Devices = 12 billion IoT Devices = 25 billion IoT Devices = 75 billion M2M IoT Smartphones PC / Tablets TVs Other Source: GSMA (IoT Revenue: State of the Market 2020); Ericsson (Mobility Report 2020); Cisco Annual Internet Report Highlights Tool 2020; IDC (Worldwide 5G Connections Forecast, 2019-2023) and KORE Forecasts 7
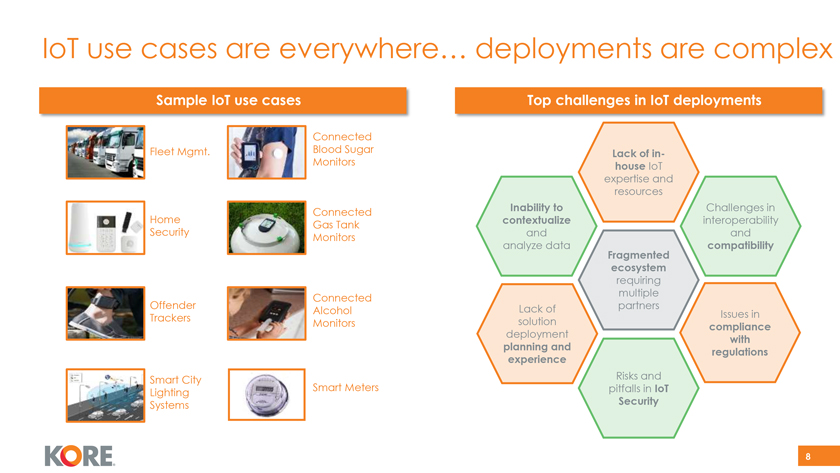
IoT use cases are everywhere… deployments are complex • Sample IoT use cases • Top challenges in IoT deployments Connected Fleet Mgmt. Blood Sugar Lack of in-Monitors house IoT expertise and resources Connected Inability to Challenges in Home contextualize interoperability Gas Tank Security and and Monitors analyze data compatibility Fragmented ecosystem requiring Connected multiple Offender Lack of partners Alcohol Issues in Trackers solution Monitors compliance deployment with planning and regulations experience Smart City Risks and Smart Meters pitfalls in IoT Lighting Systems Security 8
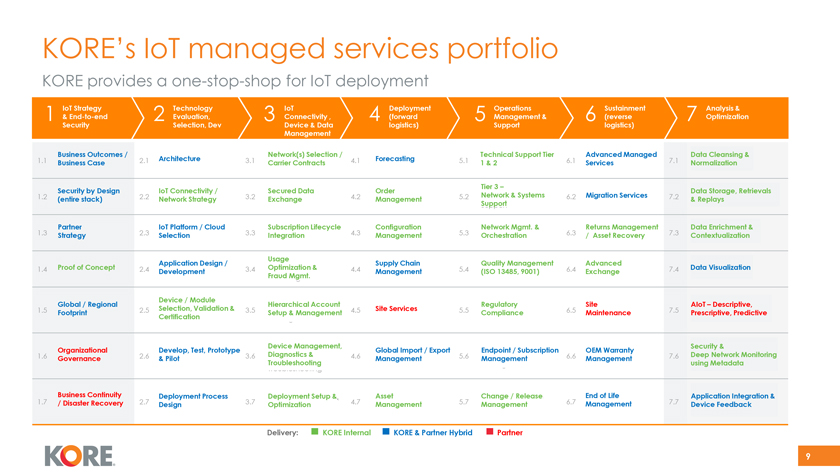
KORE’s IoT managed services portfolio KORE provides a one-stop-shop for IoT deployment IoT Strategy Technology IoT Deployment Operations Sustainment Analysis & 1 & End-to-end 2 Evaluation, 3 Connectivity , 4 (forward 5 Management & 6 (reverse 7 Optimization Security Selection, Dev Device & Data logistics) Support logistics) Management Business Outcomes / Network(s) Selection / Technical Support Tier Advanced Managed Data Cleansing & 1.1 2.1 Architecture 3.1 4.1 Forecasting 5.1 6.1 7.1 Business Case Carrier Contracts 1 & 2 Services Normalization Tier 3 – Security by Design IoT Connectivity / Secured Data Order Data Storage, Retrievals 1.2 2.2 3.2 4.2 5.2 Network & Systems 6.2 Migration Services 7.2 (entire stack) Network Strategy Exchange Management & Replays Support Partner IoT Platform / Cloud Subscription Lifecycle Configuration Network Mgmt. & Returns Management Data Enrichment & 1.3 Strategy 2.3 Selection 3.3 Integration 4.3 Management 5.3 Orchestration 6.3 / Asset Recovery 7.3 Contextualization Usage Application Design / Supply Chain Quality Management Advanced 1.4 Proof of Concept 2.4 3.4 Optimization & 4.4 5.4 6.4 7.4 Data Visualization Development Management (ISO 13485, 9001) Exchange Fraud Mgmt. Device / Module Global / Regional Hierarchical Account Regulatory Site AIoT – Descriptive, 1.5 2.5 Selection, Validation & 3.5 4.5 Site Services 5.5 6.5 7.5 Footprint Setup & Management Compliance Maintenance Prescriptive, Predictive Certification Device Management, Security & Organizational Develop, Test, Prototype Global Import / Export Endpoint / Subscription OEM Warranty 1.6 2.6 3.6 Diagnostics & 4.6 5.6 6.6 7.6 Deep Network Monitoring Governance & Pilot Management Management Management Troubleshooting using Metadata 1.7 Business Continuity 2.7 Deployment Process 3.7 Deployment Setup & 4.7 Asset 5.7 Change / Release 6.7 End of Life 7.7 Application Integration & / Disaster Recovery Design Optimization Management Management Management Device Feedback Delivery: KORE Internal KORE & Partner Hybrid Partner 9
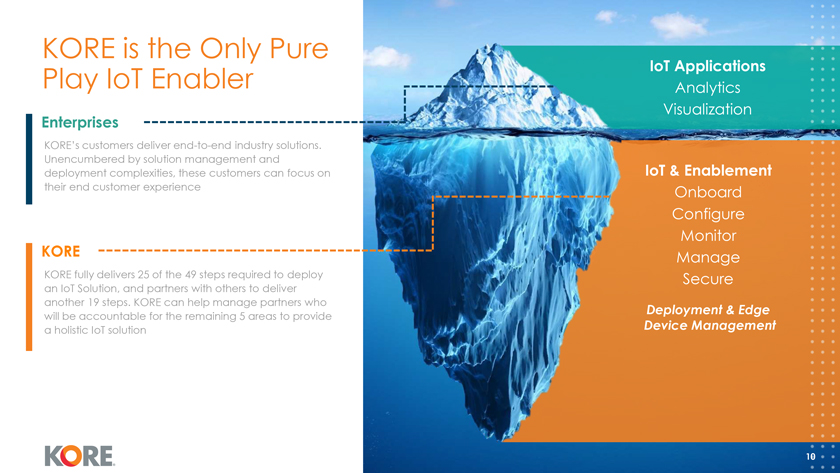
KORE is the Only Pure Play IoT Enabler IoT Applications Analytics Visualization Enterprises KORE’s customers deliver end-to-end industry solutions. Unencumbered by solution management and deployment complexities, these customers can focus on IoT & Enablement their end customer experience Onboard Configure Monitor KORE Manage KORE fully delivers 25 of the 49 steps required to deploy Secure an IoT Solution, and partners with others to deliver another 19 steps. KORE can help manage partners who Deployment & Edge will be accountable for the remaining 5 areas to provide a holistic IoT solution Device Management 10
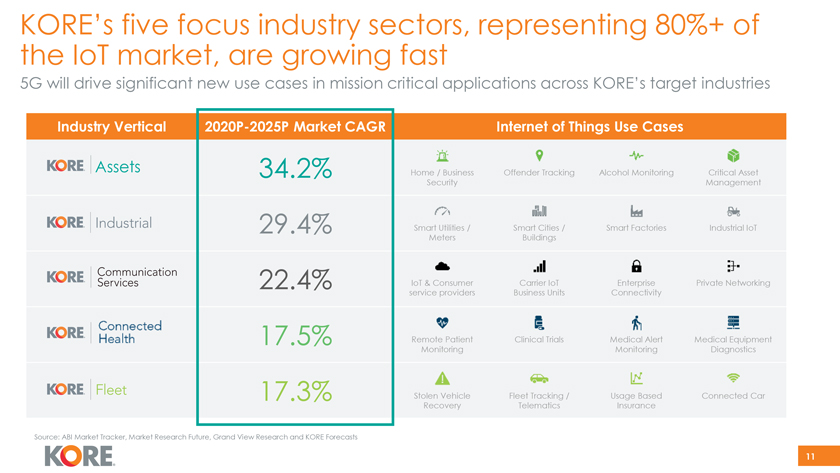
KORE’s five focus industry sectors, representing 80%+ of the IoT market, are growing fast 5G will drive significant new use cases in mission critical applications across KORE’s target industries Industry Vertical 2020P-2025P Market CAGR Internet of Things Use Cases Assets 34.2% Home / Business Offender Tracking Alcohol Monitoring Critical Asset Security Management 29.4% Smart Utilities / Smart Cities / Smart Factories Industrial IoT Meters Buildings 22.4% IoT & Consumer Carrier IoT Enterprise Private Networking service providers Business Units Connectivity 17.5% Remote Patient Clinical Trials Medical Alert Medical Equipment Monitoring Monitoring Diagnostics 17.3% Stolen Vehicle Fleet Tracking / Usage Based Connected Car Recovery Telematics Insurance Source: ABI Market Tracker, Market Research Future, Grand View Research and KORE Forecasts 11
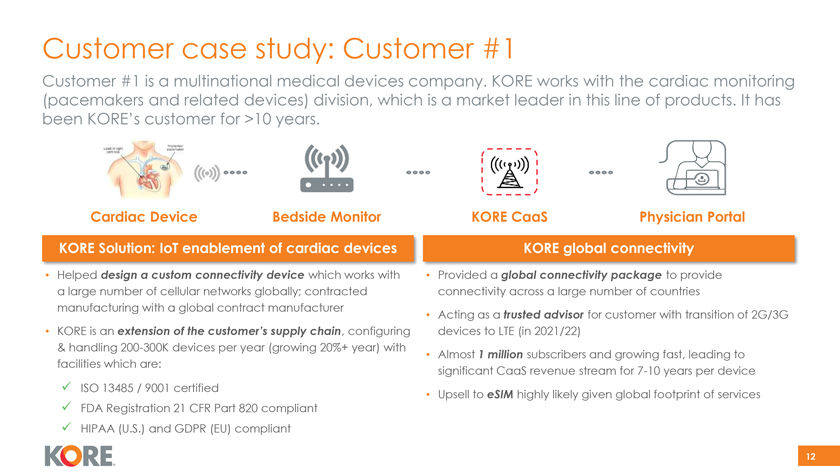
Customer case study: Customer #1 Customer #1 is a multinational medical devices company. KORE works with the cardiac monitoring (pacemakers and related devices) division, which is a market leader in this line of products. It has been KORE’s customer for >10 years. Cardiac Device Bedside Monitor KORE CaaS Physician Portal KORE Solution: IoT enablement of cardiac devices KORE global connectivity • Helped design a custom connectivity device which works with • Provided a global connectivity package to provide a large number of cellular networks globally; contracted connectivity across a large number of countries manufacturing with a global contract manufacturer • Acting as a trusted advisor for customer with transition of 2G/3G • KORE is an extension of the customer’s supply chain, configuring devices to LTE (in 2021/22) & handling 200-300K devices per year (growing 20%+ year) with • Almost 1 million subscribers and growing fast, leading to facilities which are: significant CaaS revenue stream for 7-10 years per device  ISO 13485 / 9001 certified • Upsell to eSIM highly likely given global footprint of services FDA Registration 21 CFR Part 820 compliant HIPAA (U.S.) and GDPR (EU) compliant 12
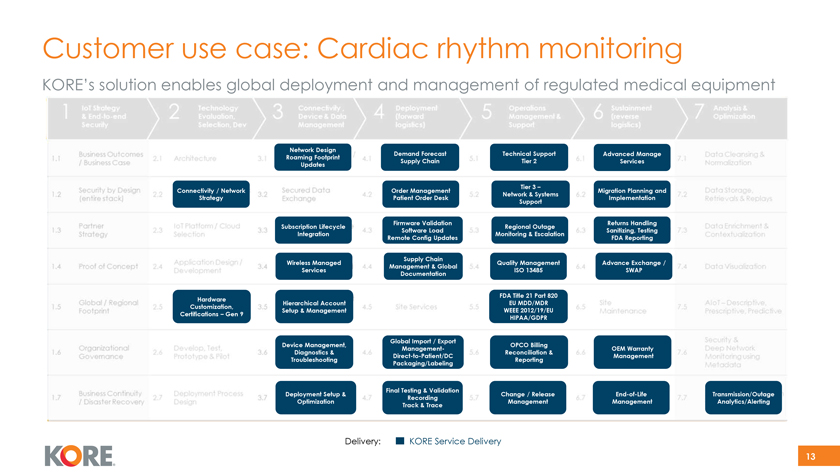
Customer use case: Cardiac rhythm monitoring KORE’s solution enables global deployment and management of regulated medical equipment Network Design Demand Forecast Technical Support Advanced Manage Roaming Footprint Supply Chain Tier 2 Services Updates Tier 3 – Connectivity / Network Order Management Migration Planning and Network & Systems Strategy Patient Order Desk Implementation Support Firmware Validation Returns Handling Subscription Lifecycle Regional Outage Software Load Sanitizing, Testing Integration Monitoring & Escalation Remote Config Updates FDA Reporting Supply Chain Wireless Managed Quality Management Advance Exchange / Management & Global Services ISO 13485 SWAP Documentation FDA Title 21 Part 820 Hardware Hierarchical Account EU MDD/MDR Customization, Setup & Management WEEE 2012/19/EU Certifications – Gen 9 HIPAA/GDPR Global Import / Export Device Management, OPCO Billing Management- OEM Warranty Diagnostics & Reconciliation & Direct-to-Patient/DC Management Troubleshooting Reporting Packaging/Labeling Final Testing & Validation Deployment Setup & Change / Release End-of-Life Transmission/Outage Recording Optimization Management Management Analytics/Alerting Track & Trace Delivery: KORE Service Delivery 13
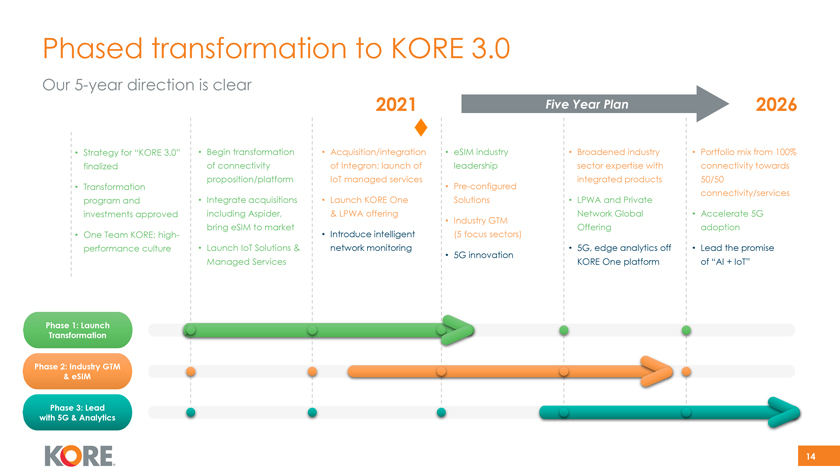
Phased transformation to KORE 3.0 Our 5-year direction is clear Five Year Plan 2021 Five Year Plan 2026 • Strategy for “KORE 3.0” • Begin transformation • Acquisition/integration • eSIM industry • Broadened industry • Portfolio mix from 100% finalized of connectivity of Integron; launch of leadership sector expertise with connectivity towards proposition/platform IoT managed services integrated products 50/50 • Transformation • Pre-configured connectivity/services program and • Integrate acquisitions • Launch KORE One Solutions • LPWA and Private investments approved including Aspider, & LPWA offering Network Global • Accelerate 5G • Industry GTM bring eSIM to market Offering adoption • One Team KORE; high- • Introduce intelligent (5 focus sectors) performance culture • Launch IoT Solutions & network monitoring • 5G, edge analytics off • Lead the promise • 5G innovation Managed Services KORE One platform of “AI + IoT” Phase 1: Launch Transformation Phase 2: Industry GTM & eSIM Phase 3: Lead with 5G & Analytics 14
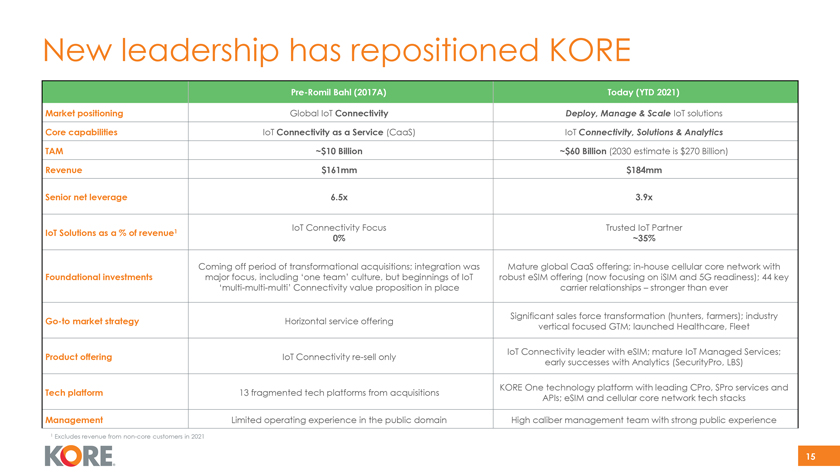
New leadership has repositioned KORE Pre-Romil Bahl (2017A) Today (YTD 2021) Market positioning Global IoT Connectivity Deploy, Manage & Scale IoT solutions Core capabilities IoT Connectivity as a Service (CaaS) IoT Connectivity, Solutions & Analytics TAM ~$10 Billion ~$60 Billion (2030 estimate is $270 Billion) Revenue $161mm $184mm Senior net leverage 6.5x 3.9x 1 IoT Connectivity Focus Trusted IoT Partner IoT Solutions as a % of revenue 0% ~35% Coming off period of transformational acquisitions; integration was Mature global CaaS offering; in-house cellular core network with Foundational investments major focus, including ‘one team’ culture, but beginnings of IoT robust eSIM offering (now focusing on iSIM and 5G readiness); 44 key ‘multi-multi-multi’ Connectivity value proposition in place carrier relationships – stronger than ever Significant sales force transformation (hunters, farmers); industry Go-to market strategy Horizontal service offering vertical focused GTM; launched Healthcare, Fleet IoT Connectivity leader with eSIM; mature IoT Managed Services; Product offering IoT Connectivity re-sell only early successes with Analytics (SecurityPro, LBS) KORE One technology platform with leading CPro, SPro services and Tech platform 13 fragmented tech platforms from acquisitions APIs; eSIM and cellular core network tech stacks Management Limited operating experience in the public domain High caliber management team with strong public experience 1 Excludes revenue from non-core customers in 2021 15

Key Credit Highlights
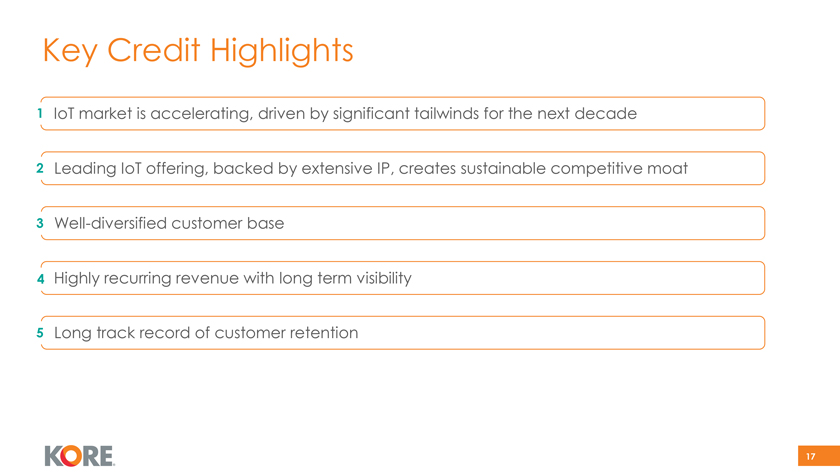
Key Credit Highlights 1 IoT market is accelerating, driven by significant tailwinds for the next decade 2 Leading IoT offering, backed by extensive IP, creates sustainable competitive moat 3 Well-diversified customer base 4 Highly recurring revenue with long term visibility 5 Long track record of customer retention 17
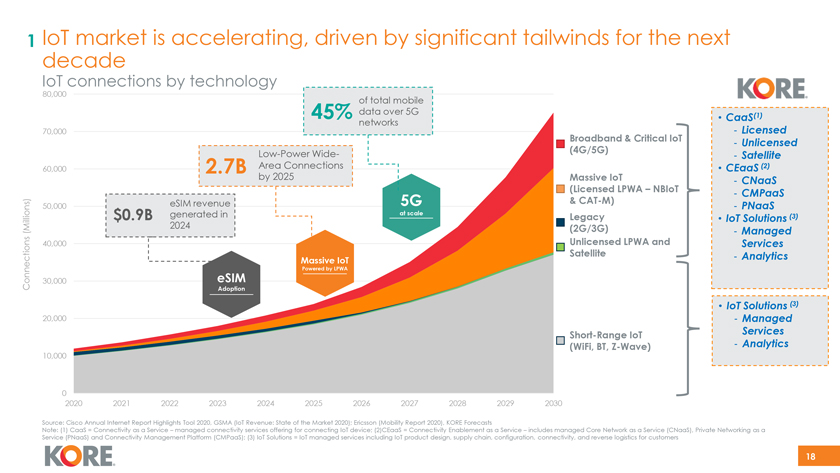
1 IoT market is accelerating, driven by significant tailwinds for the next decade IoT connections by technology 80,000 of total mobile 45% data over 5G (1) • CaaS networks - 70,000 Licensed Broadband & Critical IoT Unlicensed - Low-Power Wide- (4G/5G) - Satellite 60,000 2.7B Area Connections • CEaaS (2) by 2025 Massive IoT - CNaaS (Licensed LPWA – NBIoT CMPaaS -eSIM revenue 5G & CAT-M) 50,000 at scale - PNaaS $0.9B generated in Legacy • IoT Solutions (3) Millions) 2024 (2G/3G) ( - Managed 40,000 Unlicensed LPWA and Services Satellite - Analytics Massive IoT Powered by LPWA Connections 30,000 eSIM Adoption • IoT Solutions (3) 20,000 - Managed Short-Range IoT Services (WiFi, BT, Z-Wave) - Analytics 10,000 0 2020 2021 2022 2023 2024 2025 2026 2027 2028 2029 2030 Source: Cisco Annual Internet Report Highlights Tool 2020, GSMA (IoT Revenue: State of the Market 2020); Ericsson (Mobility Report 2020), KORE Forecasts Note: (1) CaaS = Connectivity as a Service – managed connectivity services offering for connecting IoT device; (2)CEaaS = Connectivity Enablement as a Service – includes managed Core Network as a Service (CNaaS), Private Networking as a Service (PNaaS) and Connectivity Management Platform (CMPaaS); (3) IoT Solutions = IoT managed services including IoT product design, supply chain, configuration, connectivity, and reverse logistics for customers 18
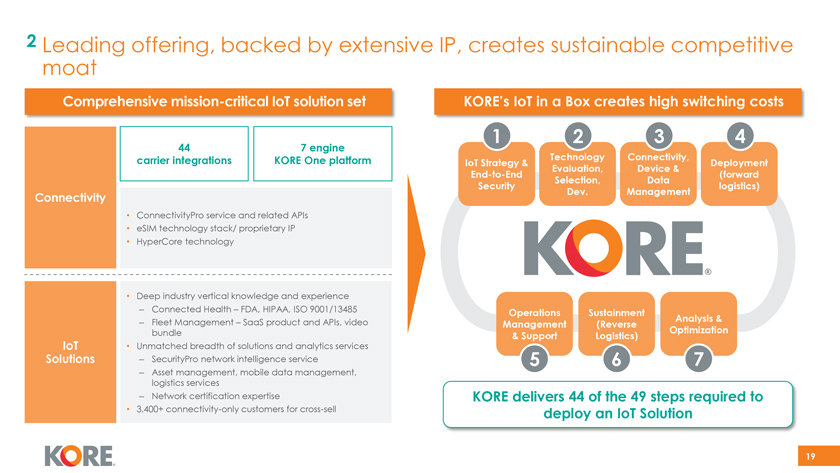
2 Leading offering, backed by extensive IP, creates sustainable competitive moat • Comprehensive mission-critical IoT solution set • KORE’s IoT in a Box creates high switching costs 1 2 3 4 44 7 engine carrier integrations KORE One platform Technology Connectivity, IoT Strategy & Deployment Evaluation, Device & End-to-End (forward Selection, Data Security logistics) Connectivity Dev. Management • ConnectivityPro service and related APIs • eSIM technology stack/ proprietary IP • HyperCore technology • Deep industry vertical knowledge and experience – Connected Health – FDA, HIPAA, ISO 9001/13485 Operations Sustainment Analysis & – Fleet Management – SaaS product and APIs, video Management (Reverse bundle Optimization & Support Logistics) IoT • Unmatched breadth of solutions and analytics services Solutions – SecurityPro network intelligence service 5 6 7 – Asset management, mobile data management, logistics services – Network certification expertise KORE delivers 44 of the 49 steps required to • 3,400+ connectivity-only customers for cross-sell deploy an IoT Solution 19
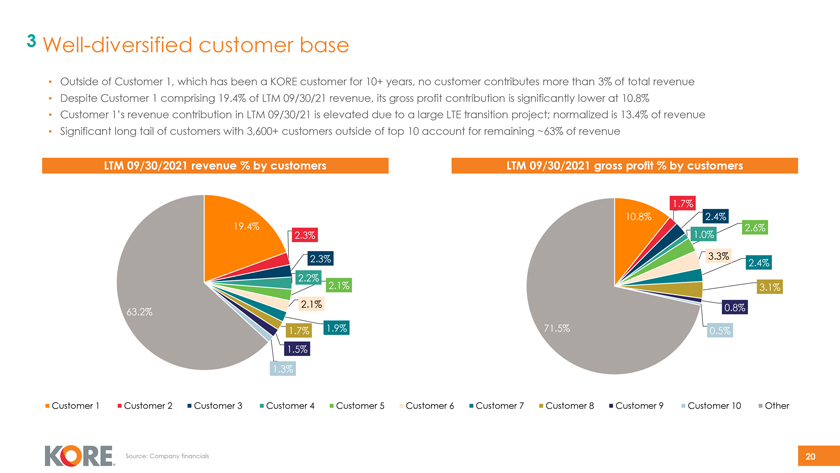
3 Well-diversified customer base • Outside of Customer 1, which has been a KORE customer for 10+ years, no customer contributes more than 3% of total revenue • Despite Customer 1 comprising 19.4% of LTM 09/30/21 revenue, its gross profit contribution is significantly lower at 10.8% • Customer 1’s revenue contribution in LTM 09/30/21 is elevated due to a large LTE transition project; normalized is 13.4% of revenue • Significant long tail of customers with 3,600+ customers outside of top 10 account for remaining ~63% of revenue LTM 09/30/2021 revenue % by customers LTM 09/30/2021 gross profit % by customers 1.7% 19.4% 10.8% 2.4% 2.6% 2.3% 1.0% 2.3% 3.3% 2.4% 2.2% 2.1% 3.1% 2.1% 0.8% 63.2% 1.7% 1.9% 71.5% 0.5% 1.5% 1.3% Customer 1 Customer 2 Customer 3 Customer 4 Customer 5 Customer 6 Customer 7 Customer 8 Customer 9 Customer 10 Other Source: Company financials 20
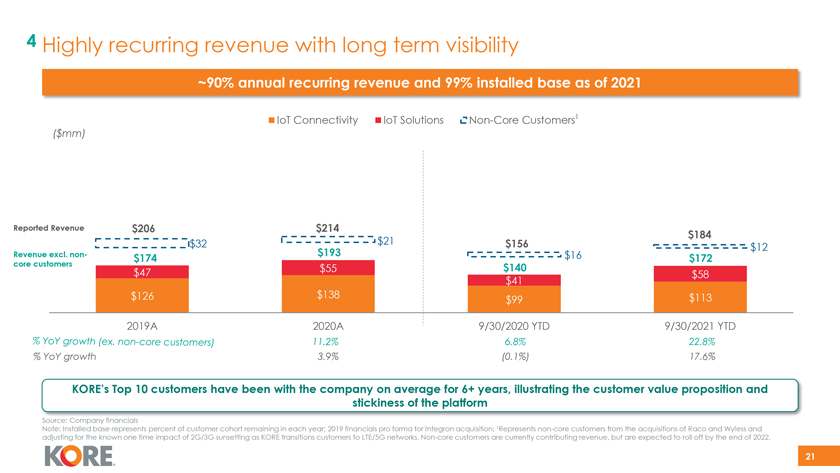
4 Highly recurring revenue with long term visibility ~90% annual recurring revenue and 99% installed base as of 2021 IoT Connectivity IoT Solutions Non-Core Customers1 ($mm) Reported Revenue $206 $214 $184 $32 $21 $156 $12 Revenue excl. non- $193 $16 $174 $172 core customers $55 $140 $47 $58 $41 $126 $138 $113 $99 2019A 2020A 9/30/2020 YTD 9/30/2021 YTD % YoY growth 3.9% (0.1%) 17.6% KORE’s Top 10 customers have been with the company on average for 6+ years, illustrating the customer value proposition and stickiness of the platform Source: Company financials Note: Installed base represents percent of customer cohort remaining in each year; 2019 financials pro forma for Integron acquisition; 1Represents non-core customers from the acquisitions of Raco and Wyless and adjusting for the known one time impact of 2G/3G sunsetting as KORE transitions customers to LTE/5G networks. Non-core customers are currently contributing revenue, but are expected to roll off by the end of 2022. 21
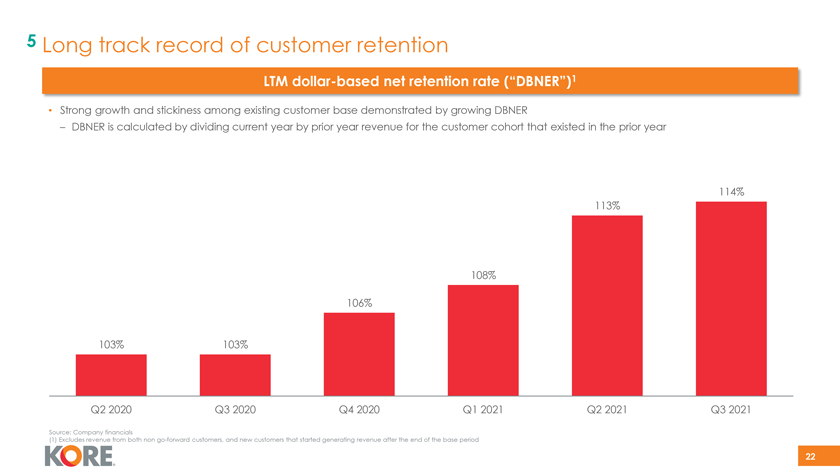
5 Long track record of customer retention LTM dollar-based net retention rate (“DBNER”)1 • Strong growth and stickiness among existing customer base demonstrated by growing DBNER – DBNER is calculated by dividing current year by prior year revenue for the customer cohort that existed in the prior year 114% 113% 108% 106% 103% 103% Q2 2020 Q3 2020 Q4 2020 Q1 2021 Q2 2021 Q3 2021 Source: Company financials (1) Excludes revenue from both non go-forward customers, and new customers that started generating revenue after the end of the base period 22

Financial update
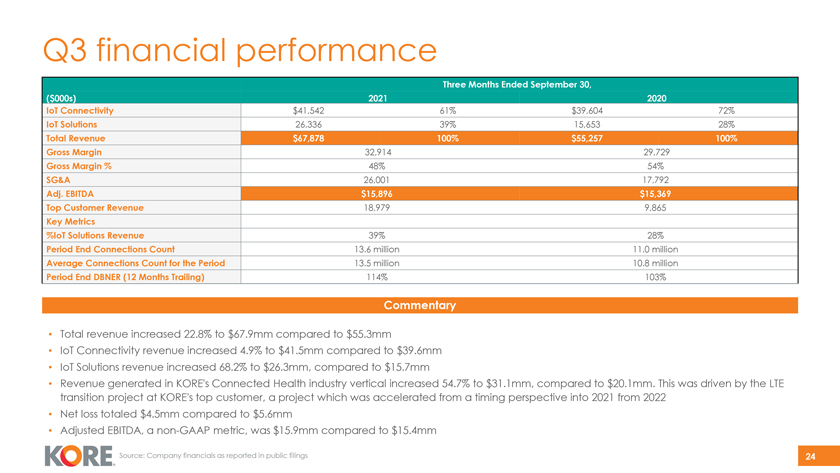
Q3 financial performance Three Months Ended September 30, ($000s) 2021 2020 IoT Connectivity $41,542 61% $39,604 72% IoT Solutions 26,336 39% 15,653 28% Total Revenue $67,878 100% $55,257 100% Gross Margin 32,914 29,729 Gross Margin % 48% 54% SG&A 26,001 17,792 Adj. EBITDA $15,896 $15,369 Top Customer Revenue 18,979 9,865 Key Metrics %IoT Solutions Revenue 39% 28% Period End Connections Count 13.6 million 11.0 million Average Connections Count for the Period 13.5 million 10.8 million Period End DBNER (12 Months Trailing) 114% 103% Commentary • Total revenue increased 22.8% to $67.9mm compared to $55.3mm • IoT Connectivity revenue increased 4.9% to $41.5mm compared to $39.6mm • IoT Solutions revenue increased 68.2% to $26.3mm, compared to $15.7mm • Revenue generated in KORE’s Connected Health industry vertical increased 54.7% to $31.1mm, compared to $20.1mm. This was driven by the LTE transition project at KORE’s top customer, a project which was accelerated from a timing perspective into 2021 from 2022 • Net loss totaled $4.5mm compared to $5.6mm • Adjusted EBITDA, a non-GAAP metric, was $15.9mm compared to $15.4mm Source: Company financials as reported in public filings 24
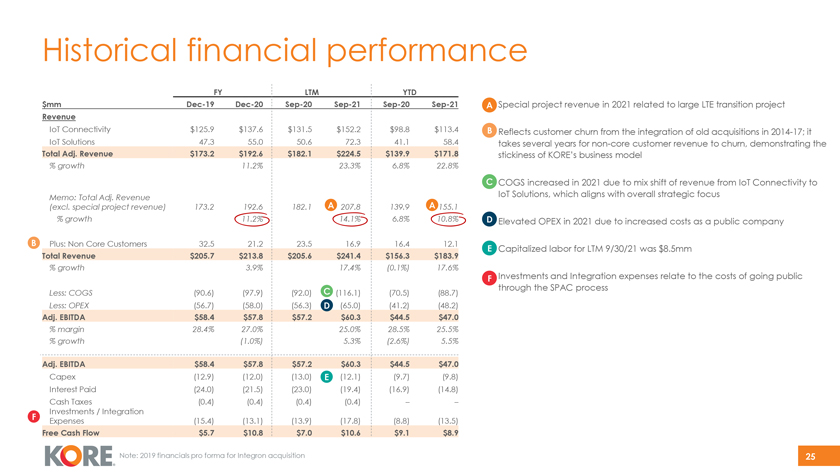
Historical financial performance FY LTM YTD $mm Dec-19 Dec-20 Sep-20 Sep-21 Sep-20 Sep-21 A • Special project revenue in 2021 related to large LTE transition project Revenue IoT Connectivity $125.9 $137.6 $131.5 $152.2 $98.8 $113.4 • B Reflects customer churn from the integration of old acquisitions in 2014-17; it IoT Solutions 47.3 55.0 50.6 72.3 41.1 58.4 takes several years for non-core customer revenue to churn, demonstrating the Total Adj. Revenue $173.2 $192.6 $182.1 $224.5 $139.9 $171.8 stickiness of KORE’s business model % growth 11.2% 23.3% 6.8% 22.8% C • COGS increased in 2021 due to mix shift of revenue from IoT Connectivity to Memo: Total Adj. Revenue IoT Solutions, which aligns with overall strategic focus (excl. special project revenue) 173.2 192.6 182.1 A 207.8 139.9 A 155.1 % growth 11.2% 14.1% 6.8% 10.8% D • Elevated OPEX in 2021 due to increased costs as a public company B Plus: Non Core Customers 32.5 21.2 23.5 16.9 16.4 12.1 • E Capitalized labor for LTM 9/30/21 was $8.5mm Total Revenue $205.7 $213.8 $205.6 $241.4 $156.3 $183.9 % growth 3.9% 17.4% (0.1%) 17.6% • F Investments and Integration expenses relate to the costs of going public C through the SPAC process Less: COGS (90.6) (97.9) (92.0) (116.1) (70.5) (88.7) Less: OPEX (56.7) (58.0) (56.3) D (65.0) (41.2) (48.2) Adj. EBITDA $58.4 $57.8 $57.2 $60.3 $44.5 $47.0 % margin 28.4% 27.0% 25.0% 28.5% 25.5% % growth (1.0%) 5.3% (2.6%) 5.5% Adj. EBITDA $58.4 $57.8 $57.2 $60.3 $44.5 $47.0 Capex (12.9) (12.0) (13.0) E (12.1) (9.7) (9.8) Interest Paid (24.0) (21.5) (23.0) (19.4) (16.9) (14.8) Cash Taxes (0.4) (0.4) (0.4) (0.4) – –Investments / Integration F Expenses (15.4) (13.1) (13.9) (17.8) (8.8) (13.5) Free Cash Flow $5.7 $10.8 $7.0 $10.6 $9.1 $8.9 Note: 2019 financials pro forma for Integron acquisition 25
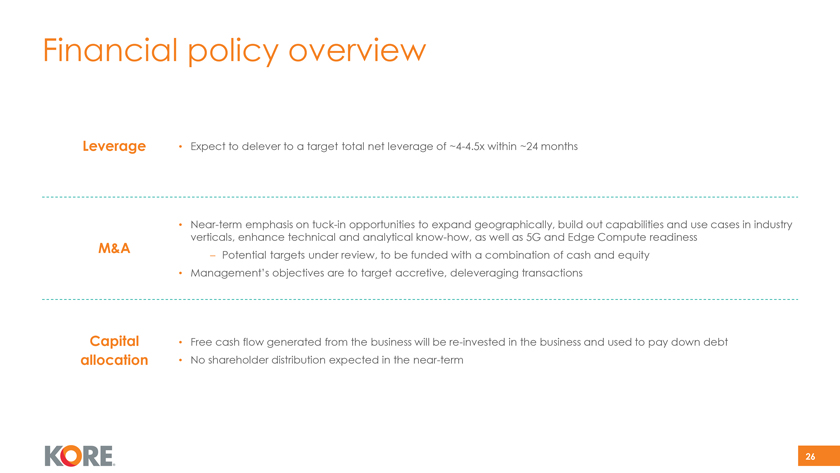
Financial policy overview Leverage • Expect to delever to a target total net leverage of ~4-4.5x within ~24 months • Near-term emphasis on tuck-in opportunities to expand geographically, build out capabilities and use cases in industry verticals, enhance technical and analytical know-how, as well as 5G and Edge Compute readiness M&A – Potential targets under review, to be funded with a combination of cash and equity • Management’s objectives are to target accretive, deleveraging transactions Capital • Free cash flow generated from the business will be re-invested in the business and used to pay down debt allocation • No shareholder distribution expected in the near-term 26

Appendix
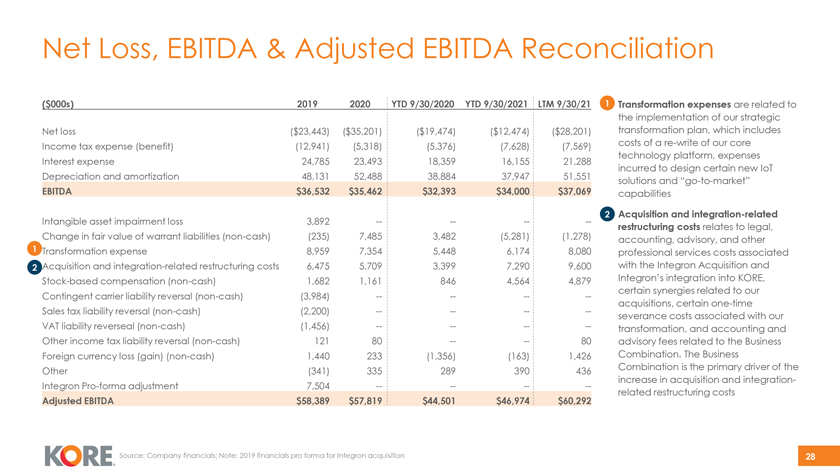
Net Loss, EBITDA & Adjusted EBITDA Reconciliation ($000s) 2019 2020 YTD 9/30/2020 YTD 9/30/2021 LTM 9/30/21 1 • Transformation expenses are related to the implementation of our strategic Net loss ($23,443) ($35,201) ($19,474) ($12,474) ($28,201) transformation plan, which includes Income tax expense (benefit) (12,941) (5,318) (5,376) (7,628) (7,569) costs of a re-write of our core technology platform, expenses Interest expense 24,785 23,493 18,359 16,155 21,288 incurred to design certain new IoT Depreciation and amortization 48,131 52,488 38,884 37,947 51,551 solutions and “go-to-market” EBITDA $36,532 $35,462 $32,393 $34,000 $37,069 capabilities 2 • Acquisition and integration-related Intangible asset impairment loss 3,892 -———- Change in fair value of warrant liabilities (non-cash) (235) 7,485 3,482 (5,281) (1,278) restructuring costs relates to legal, 1 accounting, advisory, and other Transformation expense 8,959 7,354 5,448 6,174 8,080 professional services costs associated 2 Acquisition and integration-related restructuring costs 6,475 5,709 3,399 7,290 9,600 with the Integron Acquisition and Stock-based compensation (non-cash) 1,682 1,161 846 4,564 4,879 Integron’s integration into KORE, certain synergies related to our Contingent carrier liability reversal (non-cash) (3,984) -———-acquisitions, certain one-time Sales tax liability reversal (non-cash) (2,200) -———- severance costs associated with our VAT liability reverseal (non-cash) (1,456) -———- transformation, and accounting and Other income tax liability reversal (non-cash) 121 80 -—- 80 advisory fees related to the Business Foreign currency loss (gain) (non-cash) 1,440 233 (1,356) (163) 1,426 Combination. The Business Other (341) 335 289 390 436 Combination is the primary driver of the increase in acquisition and integration- Integron Pro-forma adjustment 7,504 -———-related restructuring costs Adjusted EBITDA $58,389 $57,819 $44,501 $46,974 $60,292 Source: Company financials; Note: 2019 financials pro forma for Integron acquisition 28
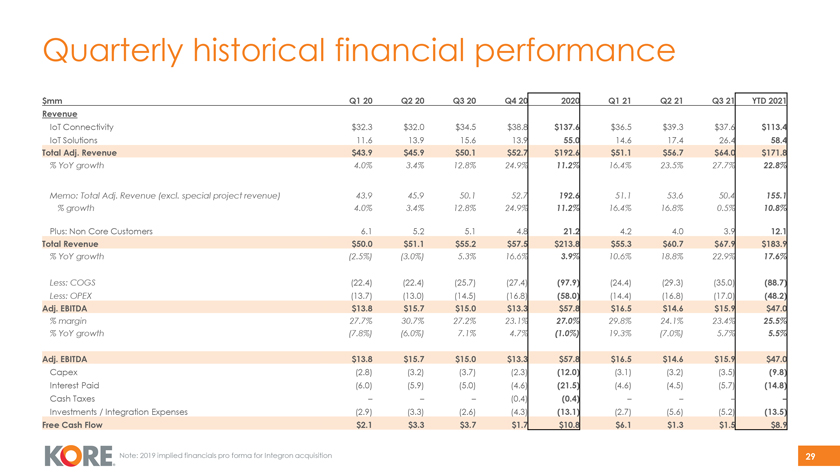
Quarterly historical financial performance $mm Q1 20 Q2 20 Q3 20 Q4 20 2020 Q1 21 Q2 21 Q3 21 YTD 2021 Revenue IoT Connectivity $32.3 $32.0 $34.5 $38.8 $137.6 $36.5 $39.3 $37.6 $113.4 IoT Solutions 11.6 13.9 15.6 13.9 55.0 14.6 17.4 26.4 58.4 Total Adj. Revenue $43.9 $45.9 $50.1 $52.7 $192.6 $51.1 $56.7 $64.0 $171.8 % YoY growth 4.0% 3.4% 12.8% 24.9% 11.2% 16.4% 23.5% 27.7% 22.8% Memo: Total Adj. Revenue (excl. special project revenue) 43.9 45.9 50.1 52.7 192.6 51.1 53.6 50.4 155.1 % growth 4.0% 3.4% 12.8% 24.9% 11.2% 16.4% 16.8% 0.5% 10.8% Plus: Non Core Customers 6.1 5.2 5.1 4.8 21.2 4.2 4.0 3.9 12.1 Total Revenue $50.0 $51.1 $55.2 $57.5 $213.8 $55.3 $60.7 $67.9 $183.9 % YoY growth (2.5%) (3.0%) 5.3% 16.6% 3.9% 10.6% 18.8% 22.9% 17.6% Less: COGS (22.4) (22.4) (25.7) (27.4) (97.9) (24.4) (29.3) (35.0) (88.7) Less: OPEX (13.7) (13.0) (14.5) (16.8) (58.0) (14.4) (16.8) (17.0) (48.2) Adj. EBITDA $13.8 $15.7 $15.0 $13.3 $57.8 $16.5 $14.6 $15.9 $47.0 % margin 27.7% 30.7% 27.2% 23.1% 27.0% 29.8% 24.1% 23.4% 25.5% % YoY growth (7.8%) (6.0%) 7.1% 4.7% (1.0%) 19.3% (7.0%) 5.7% 5.5% Adj. EBITDA $13.8 $15.7 $15.0 $13.3 $57.8 $16.5 $14.6 $15.9 $47.0 Capex (2.8) (3.2) (3.7) (2.3) (12.0) (3.1) (3.2) (3.5) (9.8) Interest Paid (6.0) (5.9) (5.0) (4.6) (21.5) (4.6) (4.5) (5.7) (14.8) Cash Taxes – – – (0.4) (0.4) – – – –Investments / Integration Expenses (2.9) (3.3) (2.6) (4.3) (13.1) (2.7) (5.6) (5.2) (13.5) Free Cash Flow $2.1 $3.3 $3.7 $1.7 $10.8 $6.1 $1.3 $1.5 $8.9 Note: 2019 implied financials pro forma for Integron acquisition 29
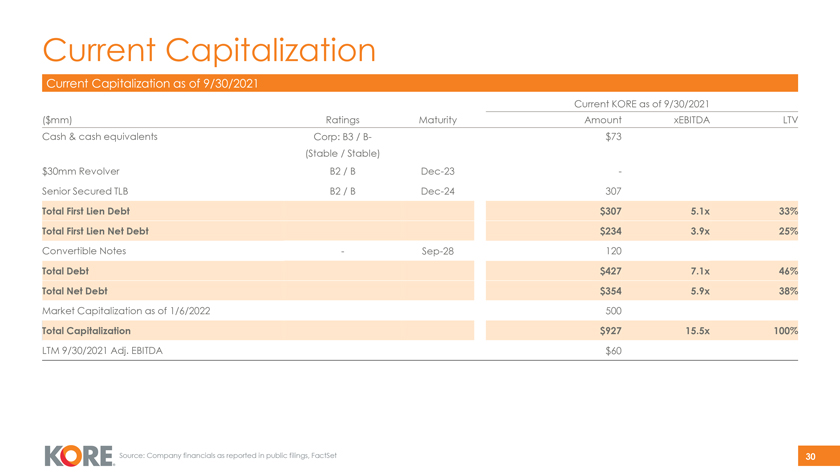
Current Capitalization Current Capitalization as of 9/30/2021 Current KORE as of 9/30/2021 ($mm) Ratings Maturity Amount xEBITDA LTV Cash & cash equivalents Corp: B3 / B- $73 (Stable / Stable) $30mm Revolver B2 / B Dec-23 -Senior Secured TLB B2 / B Dec-24 307 Total First Lien Debt $307 5.1x 33% Total First Lien Net Debt $234 3.9x 25% Convertible Notes—Sep-28 120 Total Debt $427 7.1x 46% Total Net Debt $354 5.9x 38% Market Capitalization as of 1/6/2022 500 Total Capitalization $927 15.5x 100% LTM 9/30/2021 Adj. EBITDA $60 Source: Company financials as reported in public filings, FactSet 30
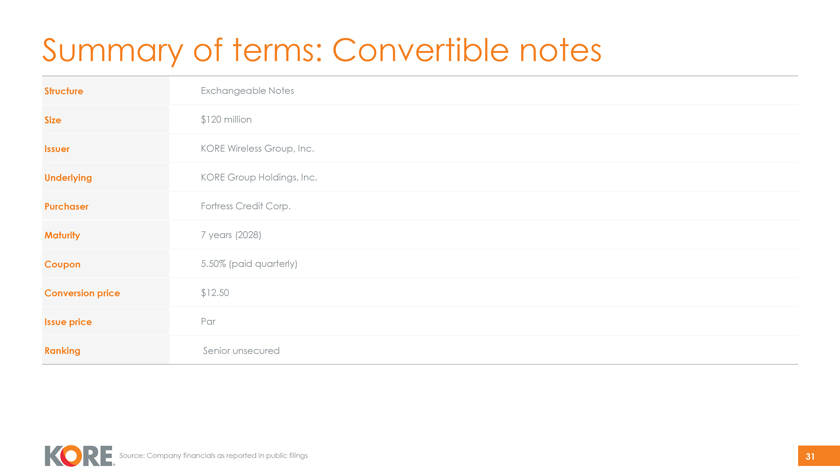
Summary of terms: Convertible notes Structure Exchangeable Notes Size $120 million Issuer KORE Wireless Group, Inc. Underlying KORE Group Holdings, Inc. Purchaser Fortress Credit Corp. Maturity 7 years (2028) Coupon 5.50% (paid quarterly) Conversion price $12.50 Issue price Par Ranking Senior unsecured Source: Company financials as reported in public filings 31
Disclaimers Forward-Looking Statements This presentation includes “forward-looking statements” within the meaning of the “safe harbor” provisions of the Private Securities Litigation Reform Act of 1995. KORE’s actual results may differ from their expectations, estimates and projections and consequently, you should not rely on these forward-looking statements as predictions of future events. Forward-looking statements generally are accompanied by words such as “believe,” “may,” “will,” “estimate,” “continue,” “anticipate,” “intend,” “expect,” “should,” “would,” “plan,” “predict,” “potential,” “seem,” “seek,” “future,” “outlook,” and similar expressions that predict or indicate future events or trends or that are not statements of historical matters. These statements are based on various assumptions and on the current expectations of KORE’s management. These forward-looking statements are provided for illustrative purposes only and are not intended to serve as and must not be relied on by any investor or other person as, a guarantee, an assurance, a prediction or a definitive statement of fact or probability. Actual events and circumstances are difficult or impossible to predict and will differ from assumptions. Many actual events and circumstances are beyond the control of KORE. These forward-looking statements are subject to a number of risks and uncertainties, including general economic, financial, legal, political and business conditions and changes in domestic and foreign markets; the potential effects of COVID-19; risks related to the rollout of KORE’s business and the timing of expected business milestones; changes in the assumptions underlying KORE’s expectations regarding its future business; the effects of competition on KORE’s future business; and the outcome of judicial proceedings to which KORE is, or may become a party. If the risks materialize or assumptions prove incorrect, actual results could differ materially from the results implied by these forward-looking statements. There may be additional risks that KORE presently does not know or that KORE currently believes are immaterial that could also cause actual results to differ materially from those contained in the forward-looking statements. In addition, forward-looking statements reflect KORE’s expectations, plans or forecasts of future events and views as of the date of this presentation. KORE anticipates that subsequent events and developments will cause these assessments to change. However, while KORE may elect to update these forward-looking statements at some point in the future, KORE specifically disclaims any obligation to do so. These forward-looking statements should not be relied upon as representing KORE’s assessments as of any date subsequent to the date of this press release. Accordingly, undue reliance should not be placed upon the forward-looking statements. Industry and Market Data In this presentation, we rely on and refer to information and statistics regarding market participants in the sectors in which KORE expects to compete and other industry data. We obtained this information and these statistics from a variety of publicly available sources, including reports by market research firms and other public company filings. No representation is made as to the reasonableness of the assumptions made within or the accuracy or completeness of any projections or modeling or any other information contained herein. Any data on past performance or modeling contained herein is not an indication as to future performance. Trademarks This presentation may contain trademarks, service marks, trade names and copyrights of other companies, which are the property of their respective owners. Solely for convenience, some of the trademarks, service marks, trade names and copyrights referred to in this presentation may be listed without the TM, SM, © or ® symbols, but KORE will assert, to the fullest extent under applicable law, the rights of the applicable owners, if any, to these trademarks, service marks, trade names and copyrights. Use of Projections This presentation also contains certain financial forecasts of KORE. KORE’s independent auditors have not studied, reviewed, compiled or performed any procedures with respect to the projections for the purpose of their inclusion in this presentation, and accordingly, neither of them has expressed an opinion or provided any other form of assurance with respect thereto for the purpose of this presentation. These projections are for illustrative purposes only and should not be relied upon as being necessarily indicative of future results. The assumptions and estimates underlying the prospective financial information are inherently uncertain and are subject to a wide variety of significant business, economic and competitive risks and uncertainties that could cause actual results to differ materially from those contained in the prospective financial information. Projections are inherently uncertain due to a number of factors outside of KORE’s control. Accordingly, there can be no assurance that the prospective results are indicative of future performance of KORE or that actual results will not differ materially from those presented in the prospective financial information. Inclusion of the prospective financial information in this presentation should not be regarded as a representation by any person that the results contained in the prospective financial information will be achieved. Use of Non-GAAP Financial Measures In addition to our results determined in accordance with GAAP, we believe the following non-GAAP measures are useful in evaluating our operational performance. We use the following non-GAAP financial information to evaluate our ongoing operations and for internal planning and forecasting purposes. We believe that non-GAAP financial information, when taken collectively, may be helpful to investors in assessing our operating performance. “EBITDA” is defined as net income (loss) before other non-operating expense or income, income tax expense or benefit, and depreciation and amortization. “Adjusted EBITDA” is defined as EBITDA adjusted for unusual and other significant items that management views as distorting the operating results from period to period. Such adjustments may include stock-based compensation, integration and acquisition-related charges, tangible and intangible asset impairment charges, certain contingent liability reversals, transformation, and foreign currency transaction gains and losses. EBITDA and Adjusted EBITDA are intended as supplemental measures of our performance that are neither required by, nor presented in accordance with, GAAP. We believe that the use of EBITDA and Adjusted EBITDA provides an additional tool for investors to use in evaluating ongoing operating results and trends and in comparing KORE’s financial measures with those of comparable companies, which may present similar non-GAAP financial measures to investors. However, you should be aware that when evaluating EBITDA and Adjusted EBITDA we may incur future expenses similar to those excluded when calculating these measures. In addition, our presentation of these measures should not be construed as an inference that our future results will be unaffected by unusual or non-recurring items. Our computation of Adjusted EBITDA may not be comparable to other similarly titled measures computed by other companies, because all companies may not calculate Adjusted EBITDA in the same fashion. Because of these limitations, EBITDA and Adjusted EBITDA should not be considered in isolation or as a substitute for performance measures calculated in accordance with GAAP. We compensate for these limitations by relying primarily on our GAAP results and using EBITDA and Adjusted EBITDA on a supplemental basis. You should review the reconciliation of net loss to EBITDA and Adjusted EBITDA below and not rely on any single financial measure to evaluate our business. 32