Project King Discussion Materials September 2025 Exhibit (c)(xiv)

New Sponsor Equity $49.1 7.9% Purchase of Equity $35.1 5.6% Rollover
Equity 44.5 7.1% Rollover Equity 44.5 7.1% New Debt 300.0 48.2% Repay Term Loan 181.3 29.1% Rollover Preferred Equity (1) 199.6 32.1% Repay Convertible Notes 120.0 19.3% Cash on Balance Sheet 29.6 4.8% Rollover Preferred
Equity (1) 199.6 32.1% Fees & Expenses 12.6 2.0% Cash to Balance Sheet 29.6 4.8% Total Sources $622.7 100.0% Total Uses $622.7 100.0% 2025E Senior Net Leverage(2) 4.3x Sources & Uses $ % of Total $ % of Total
Sources Uses Proposed Transaction Overview 2 Note: Balance sheet cash, term loan, convertible notes, and preferred equity reflect 2025E year-end balances. Includes the $150M strategic investment from Searchlight from November 15, 2023,
KORE’s $2.9M purchase of 5M shares from Twilio from December 13, 2023, and the total amount of the accrued interest due to Searchlight as of December 31, 2025. Assumes $62.7M of 2025E adjusted EBITDA per management forecast. Key
Assumptions Assumes a $4.00/share take-private (~72% premium to current share price and ~77% premium to LTM VWAP) Searchlight, Abry, Terence Jarman, Richard Burston, and Koch equity rollover (55.9% of shares); remaining 44.1% bought out with
new equity Assumes rollover of Searchlight preferred ($199.6M) Whitehorse term loan ($181.3M) and Fortress converts ($120.0M) taken out at par $300M of new debt at SOFR+650 bps; total funded leverage of 4.8x with $29.6M cash balance at
close Implied EV / Adj. EBITDA entry multiple of 8.8x (based on $62.7M of 2025E EBITDA); implied enterprise value of $550.9M
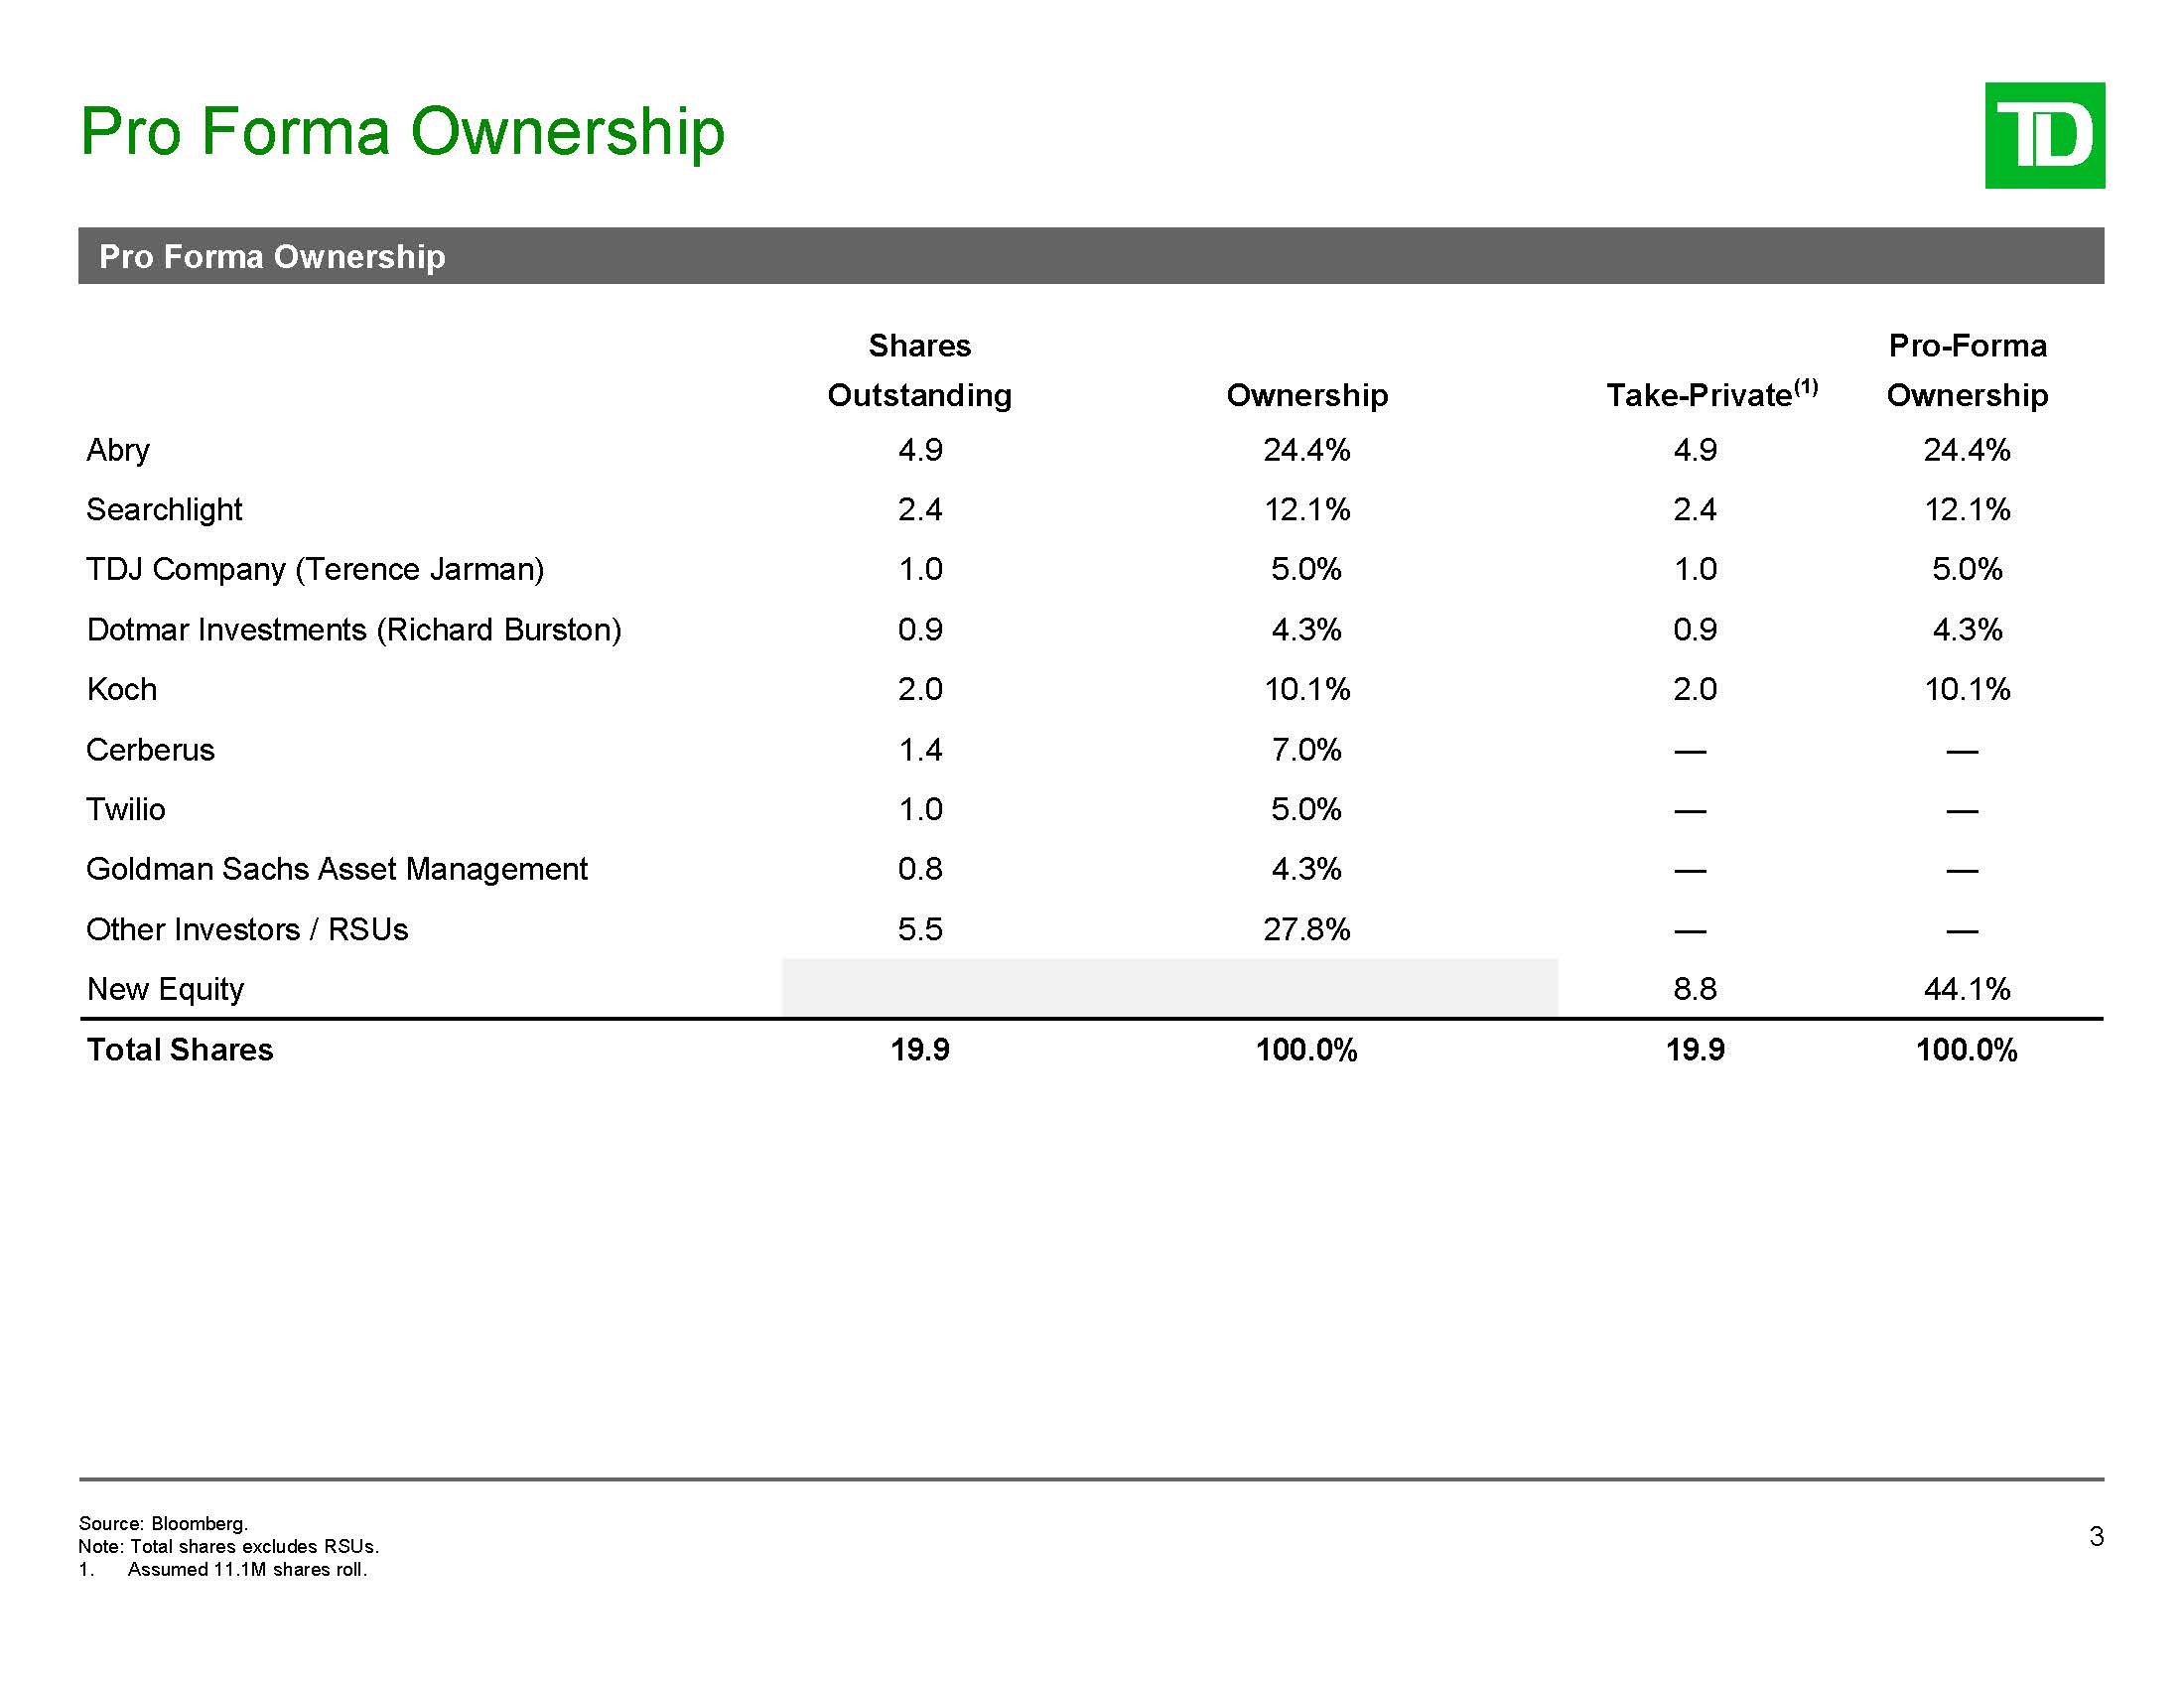
Pro Forma Ownership 3 Pro Forma Ownership Shares
Outstanding Ownership Take-Private(1) Pro-Forma Ownership Abry 4.9 24.4% 4.9 24.4% Searchlight 2.4 12.1% 2.4 12.1% TDJ Company (Terence Jarman) 1.0 5.0% 1.0 5.0% Dotmar Investments (Richard
Burston) 0.9 4.3% 0.9 4.3% Koch 2.0 10.1% 2.0 10.1% Cerberus 1.4 7.0% — — Twilio 1.0 5.0% — — Goldman Sachs Asset Management 0.8 4.3% — — Other Investors / RSUs 5.5 27.8% — — New Equity 8.8 44.1% Total
Shares 19.9 100.0% 19.9 100.0% Source: Bloomberg. Note: Total shares excludes RSUs. 1. Assumed 11.1M shares roll.
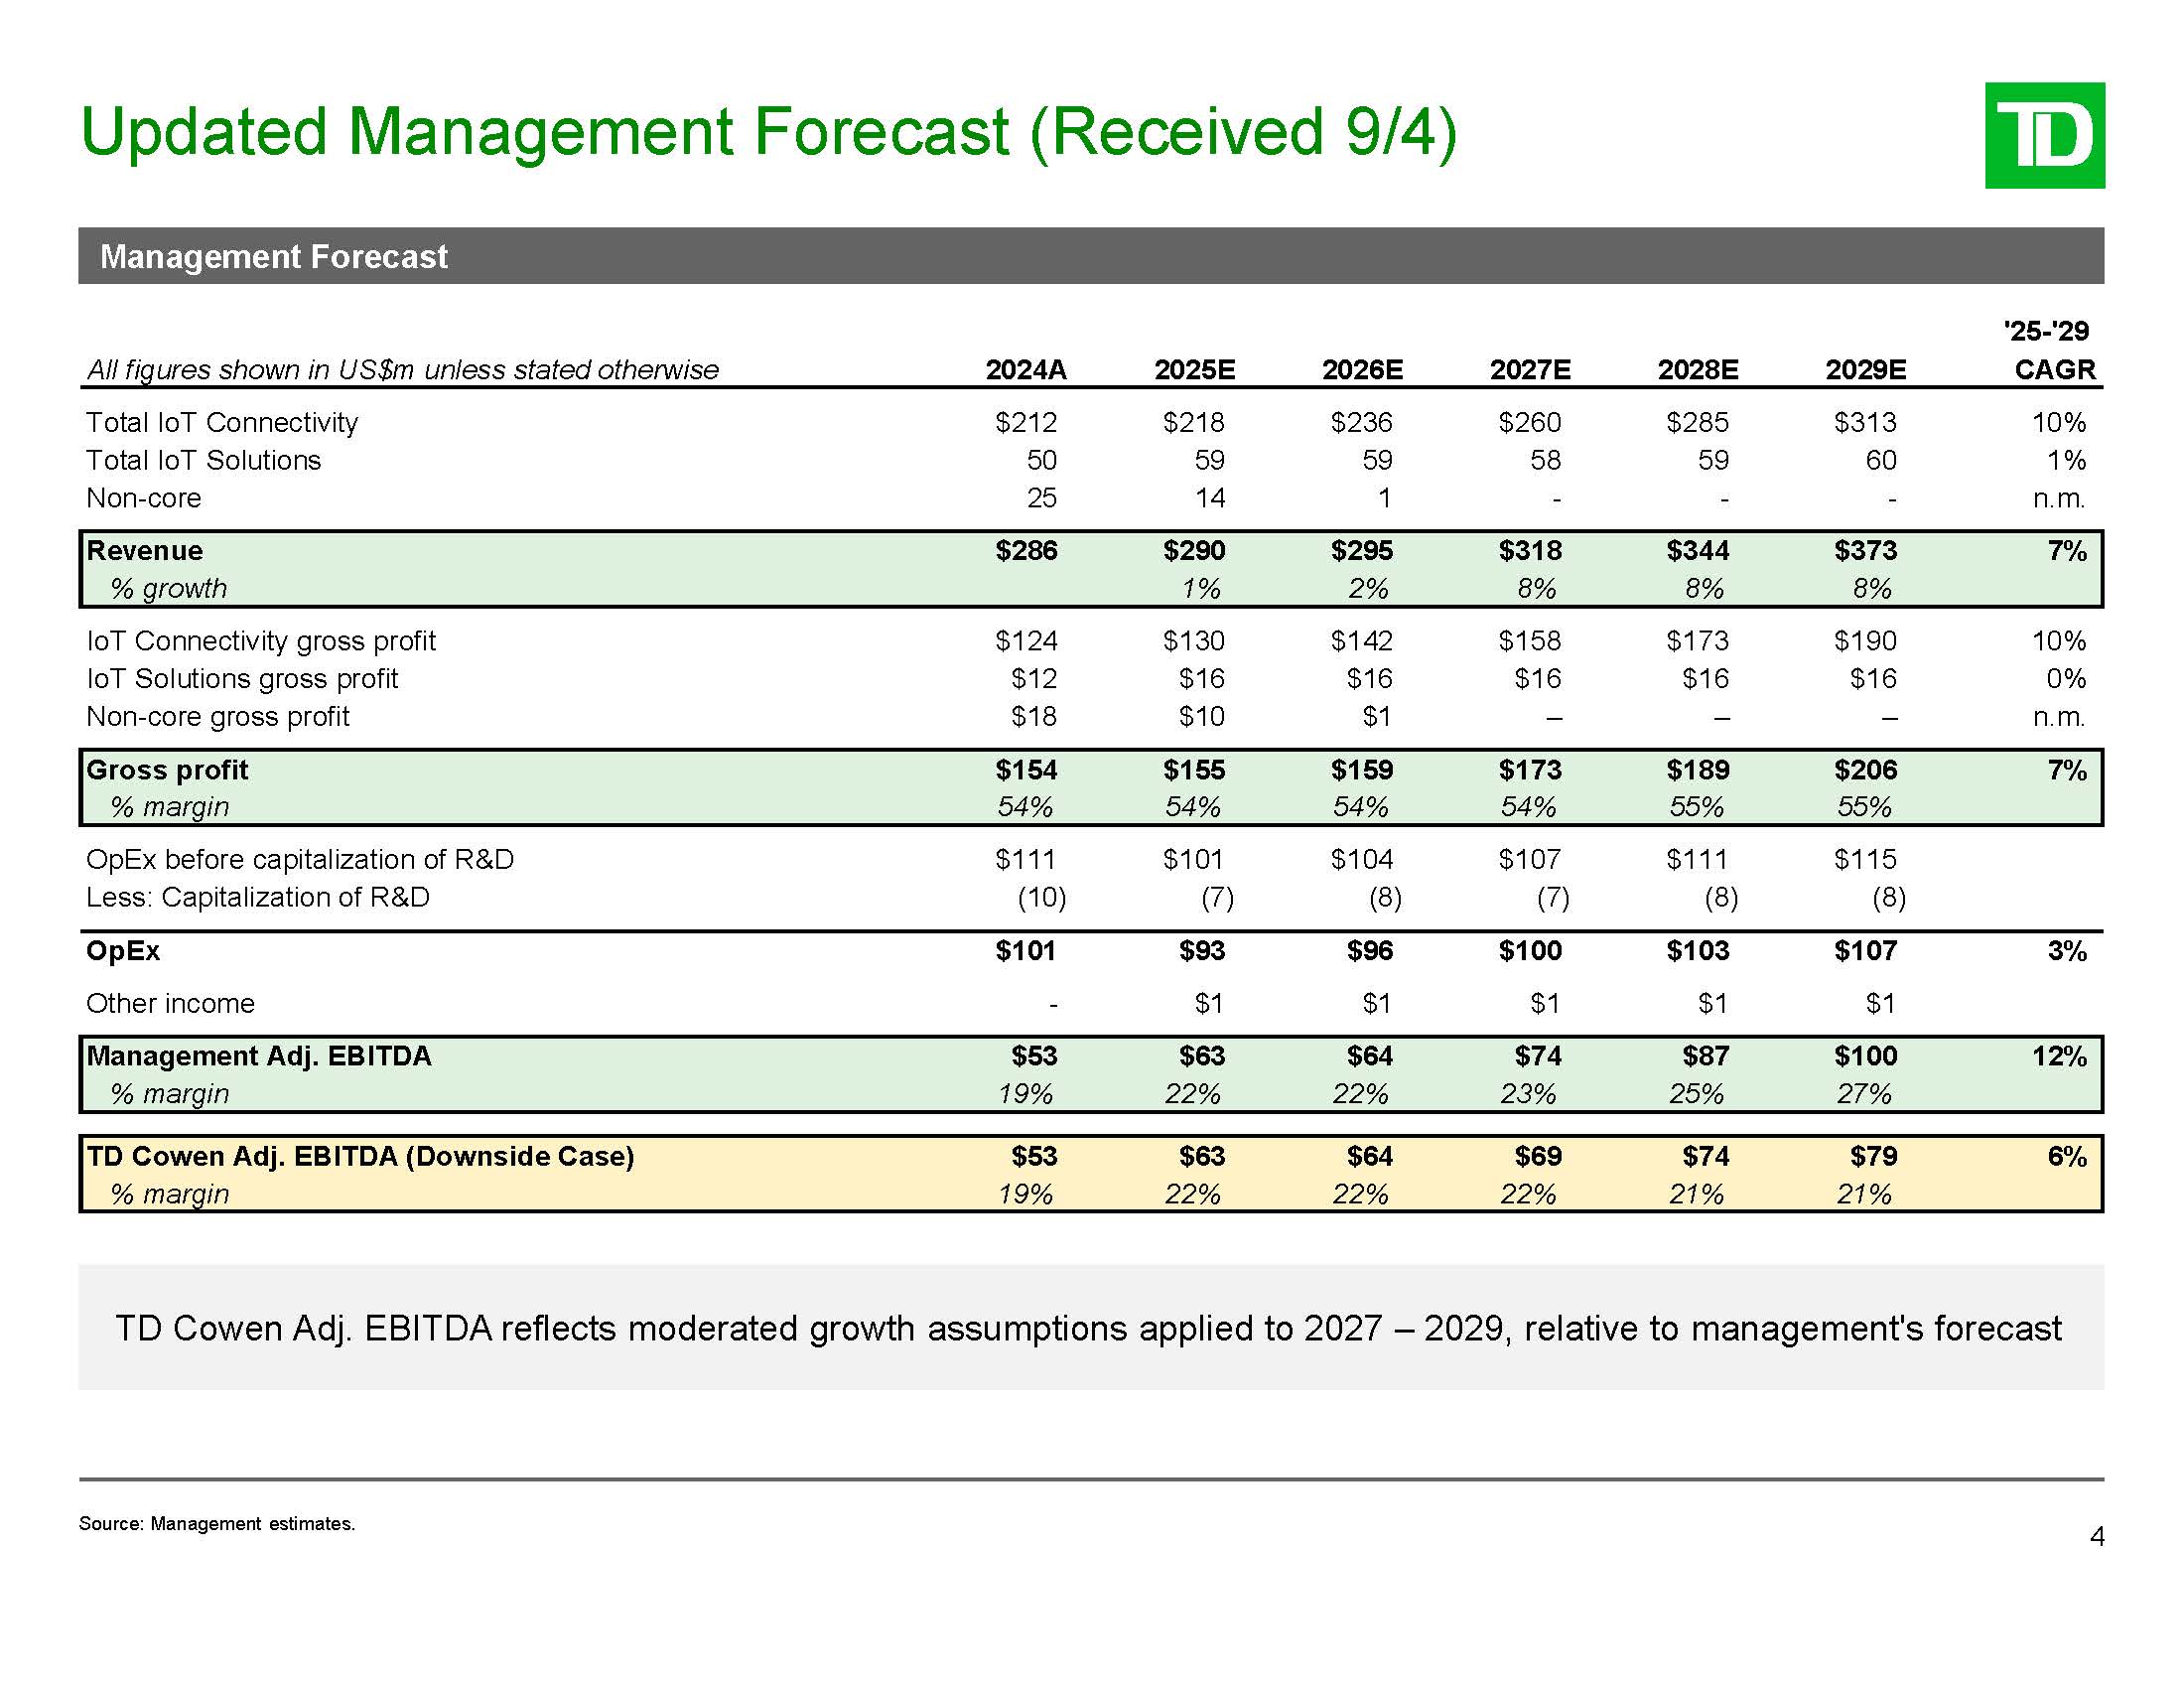
Updated Management Forecast (Received 9/4) 4 Management Forecast TD Cowen Adj.
EBITDA reflects moderated growth assumptions applied to 2027 – 2029, relative to management's forecast Total IoT Connectivity $212 $218 $236 $260 $285 $313 10% Total IoT Solutions 50 59 59 58 59 60 1% Non-core
25 14 1 - - - n.m. Revenue $286 $290 $295 $318 $344 $373 7% % growth 1% 2% 8% 8% 8% IoT Connectivity gross profit $124 $130 $142 $158 $173 $190 10% IoT Solutions gross profit $12 $16 $16 $16 $16 $16 0% Non-core
gross profit $18 $10 $1 – – – n.m. Gross profit $154 $155 $159 $173 $189 $206 7% % margin 54% 54% 54% 54% 55% 55% OpEx before capitalization of R&D $111 $101 $104 $107 $111 $115 Less: Capitalization of
R&D (10) (7) (8) (7) (8) (8) OpEx Other income $101 - $93 $1 $96 $1 $100 $1 $103 $1 $107 $1 3% Management Adj. EBITDA % margin $53 19% $63 22% $64 22% $74 23% $87 25% $100 27% 12% TD Cowen Adj. EBITDA
(Downside Case) $53 $63 $64 $69 $74 $79 6% % margin 19% 22% 22% 22% 21% 21% '25-'29 CAGR All figures shown in US$m unless stated otherwise 2024A 2025E 2026E 2027E 2028E 2029E Source: Management estimates.
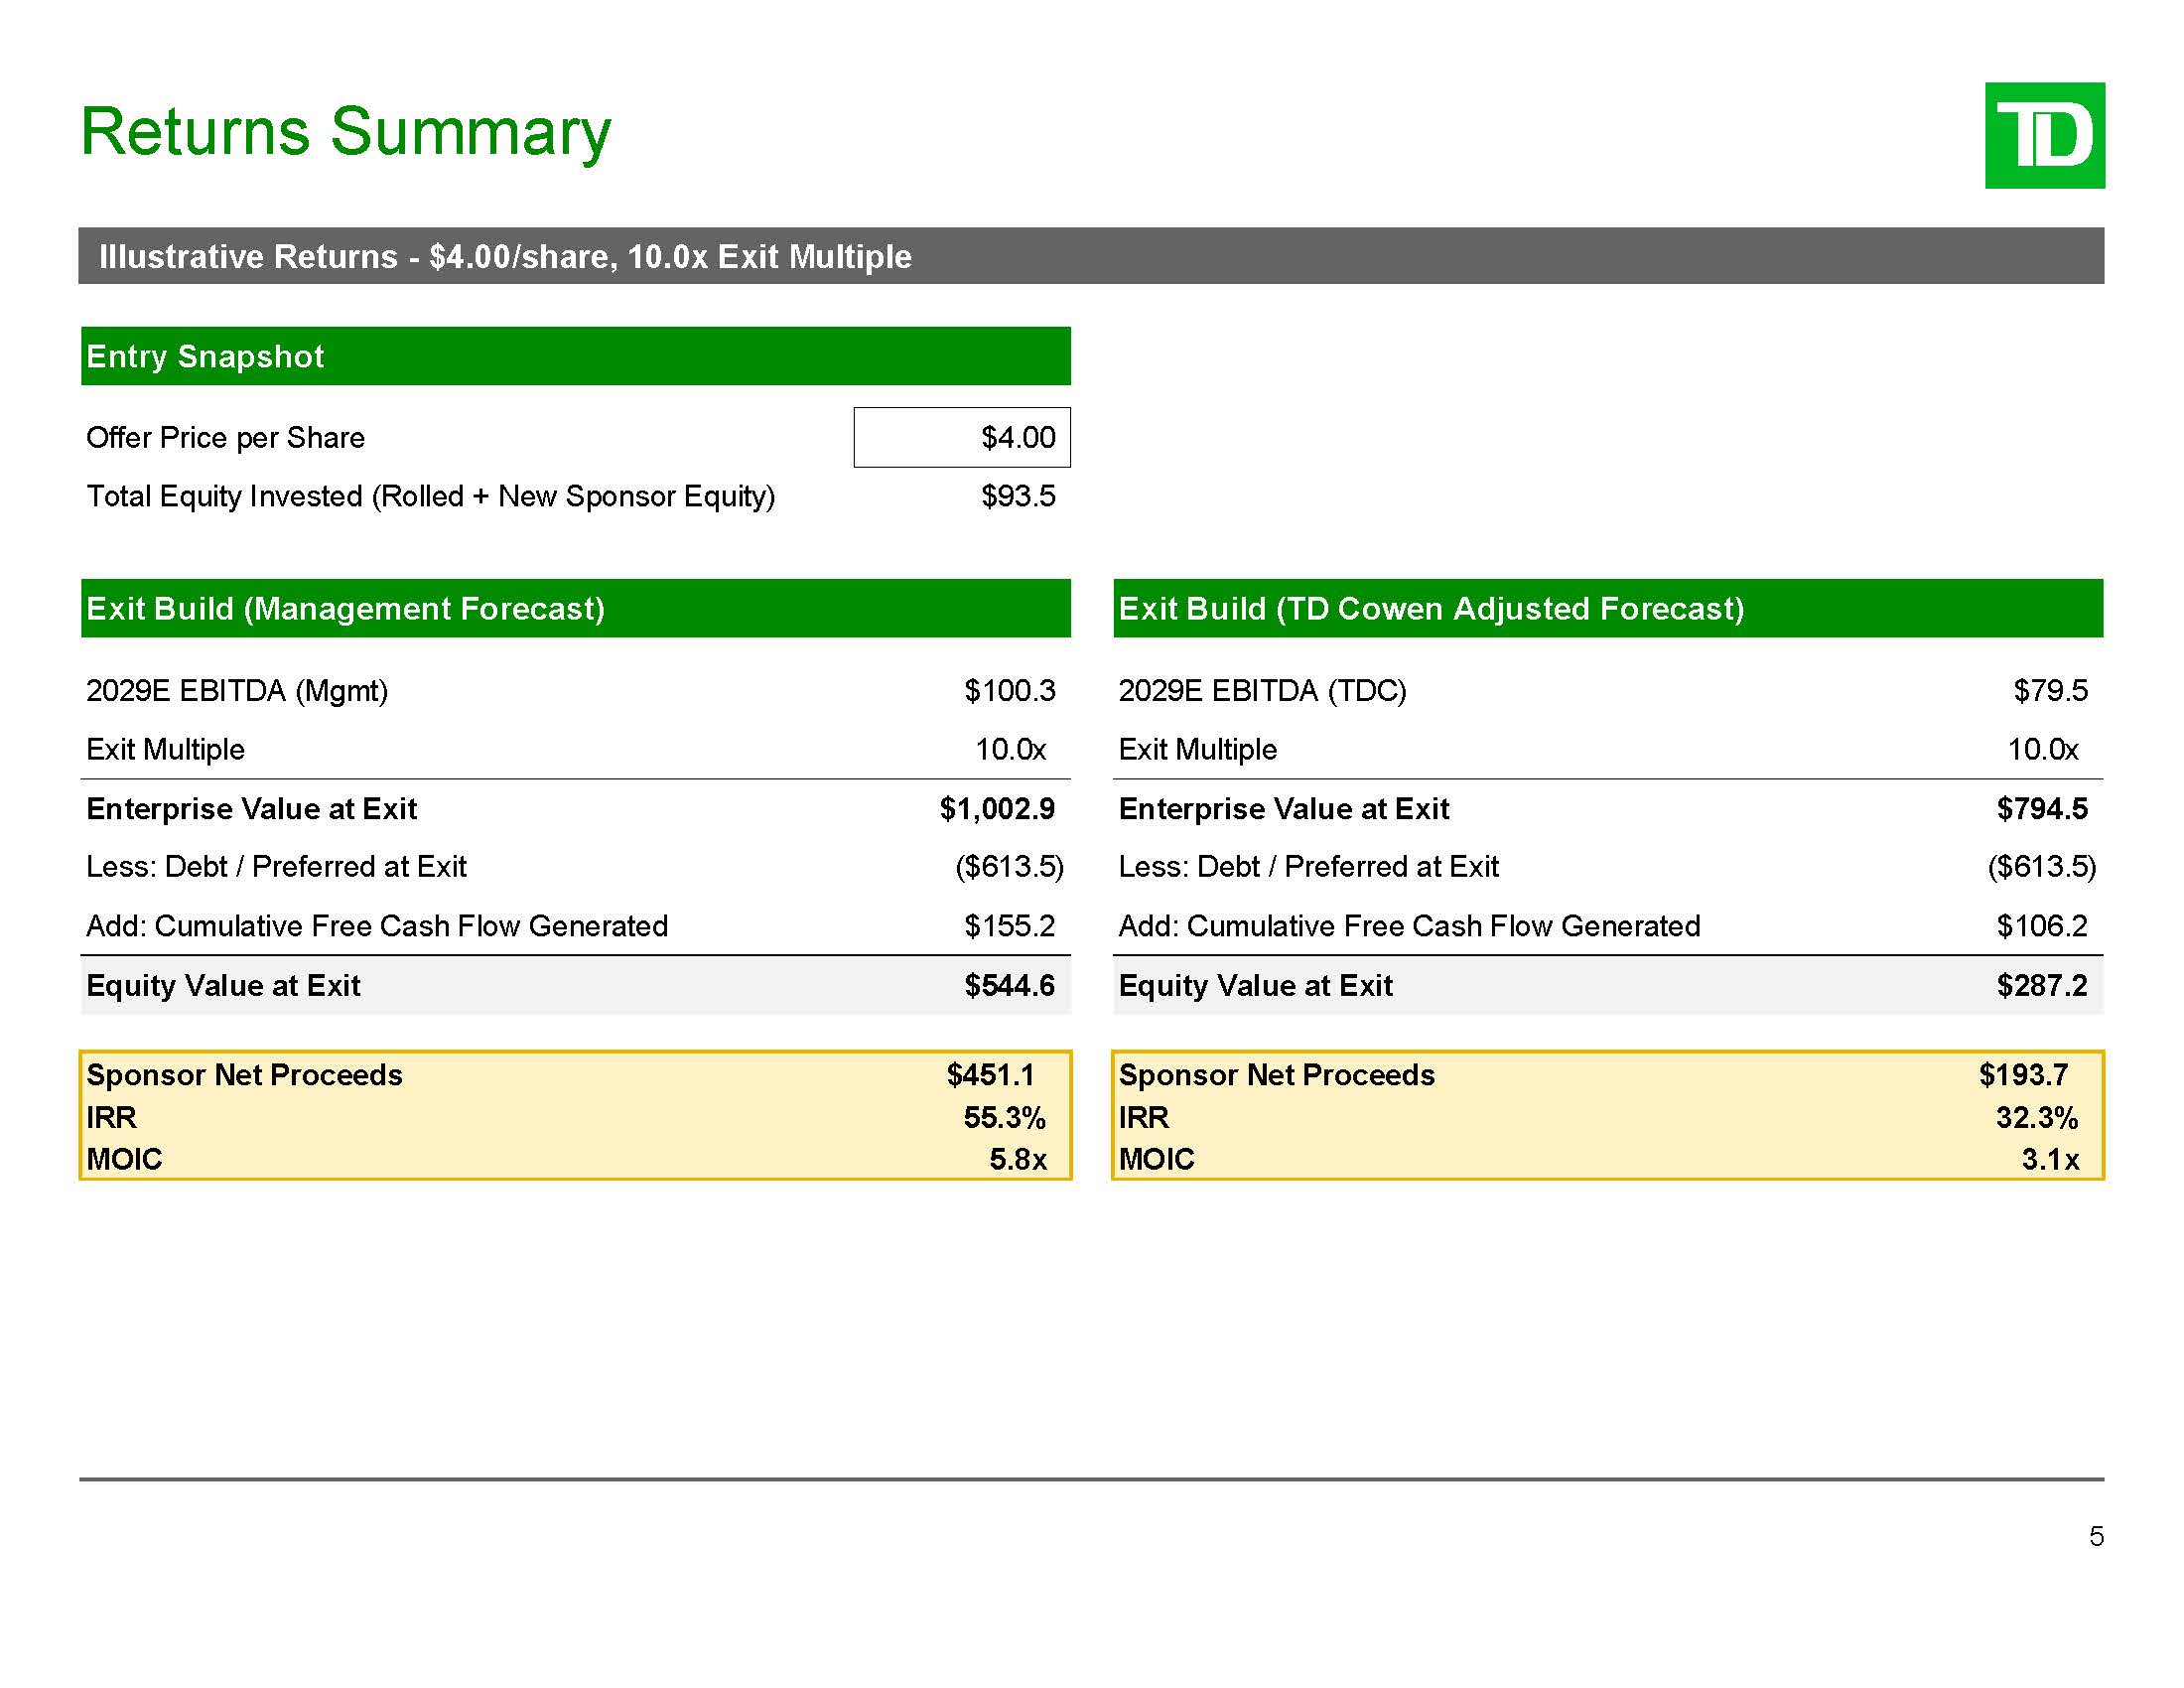
Returns Summary 5 Illustrative Returns - $4.00/share, 10.0x Exit Multiple Entry
Snapshot Offer Price per Share $4.00 Total Equity Invested (Rolled + New Sponsor Equity) $93.5 Exit Build (Management Forecast) Exit Build (TD Cowen Adjusted Forecast) 2029E EBITDA (Mgmt) $100.3 2029E EBITDA (TDC) $79.5 Exit
Multiple 10.0x Exit Multiple 10.0x Enterprise Value at Exit $1,002.9 Enterprise Value at Exit $794.5 Less: Debt / Preferred at Exit ($613.5) Less: Debt / Preferred at Exit ($613.5) Add: Cumulative Free Cash Flow
Generated $155.2 Add: Cumulative Free Cash Flow Generated $106.2 Equity Value at Exit $544.6 Equity Value at Exit $287.2 Sponsor Net Proceeds $451.1 Sponsor Net Proceeds $193.7 IRR 55.3% IRR 32.3% MOIC 5.8x MOIC 3.1x
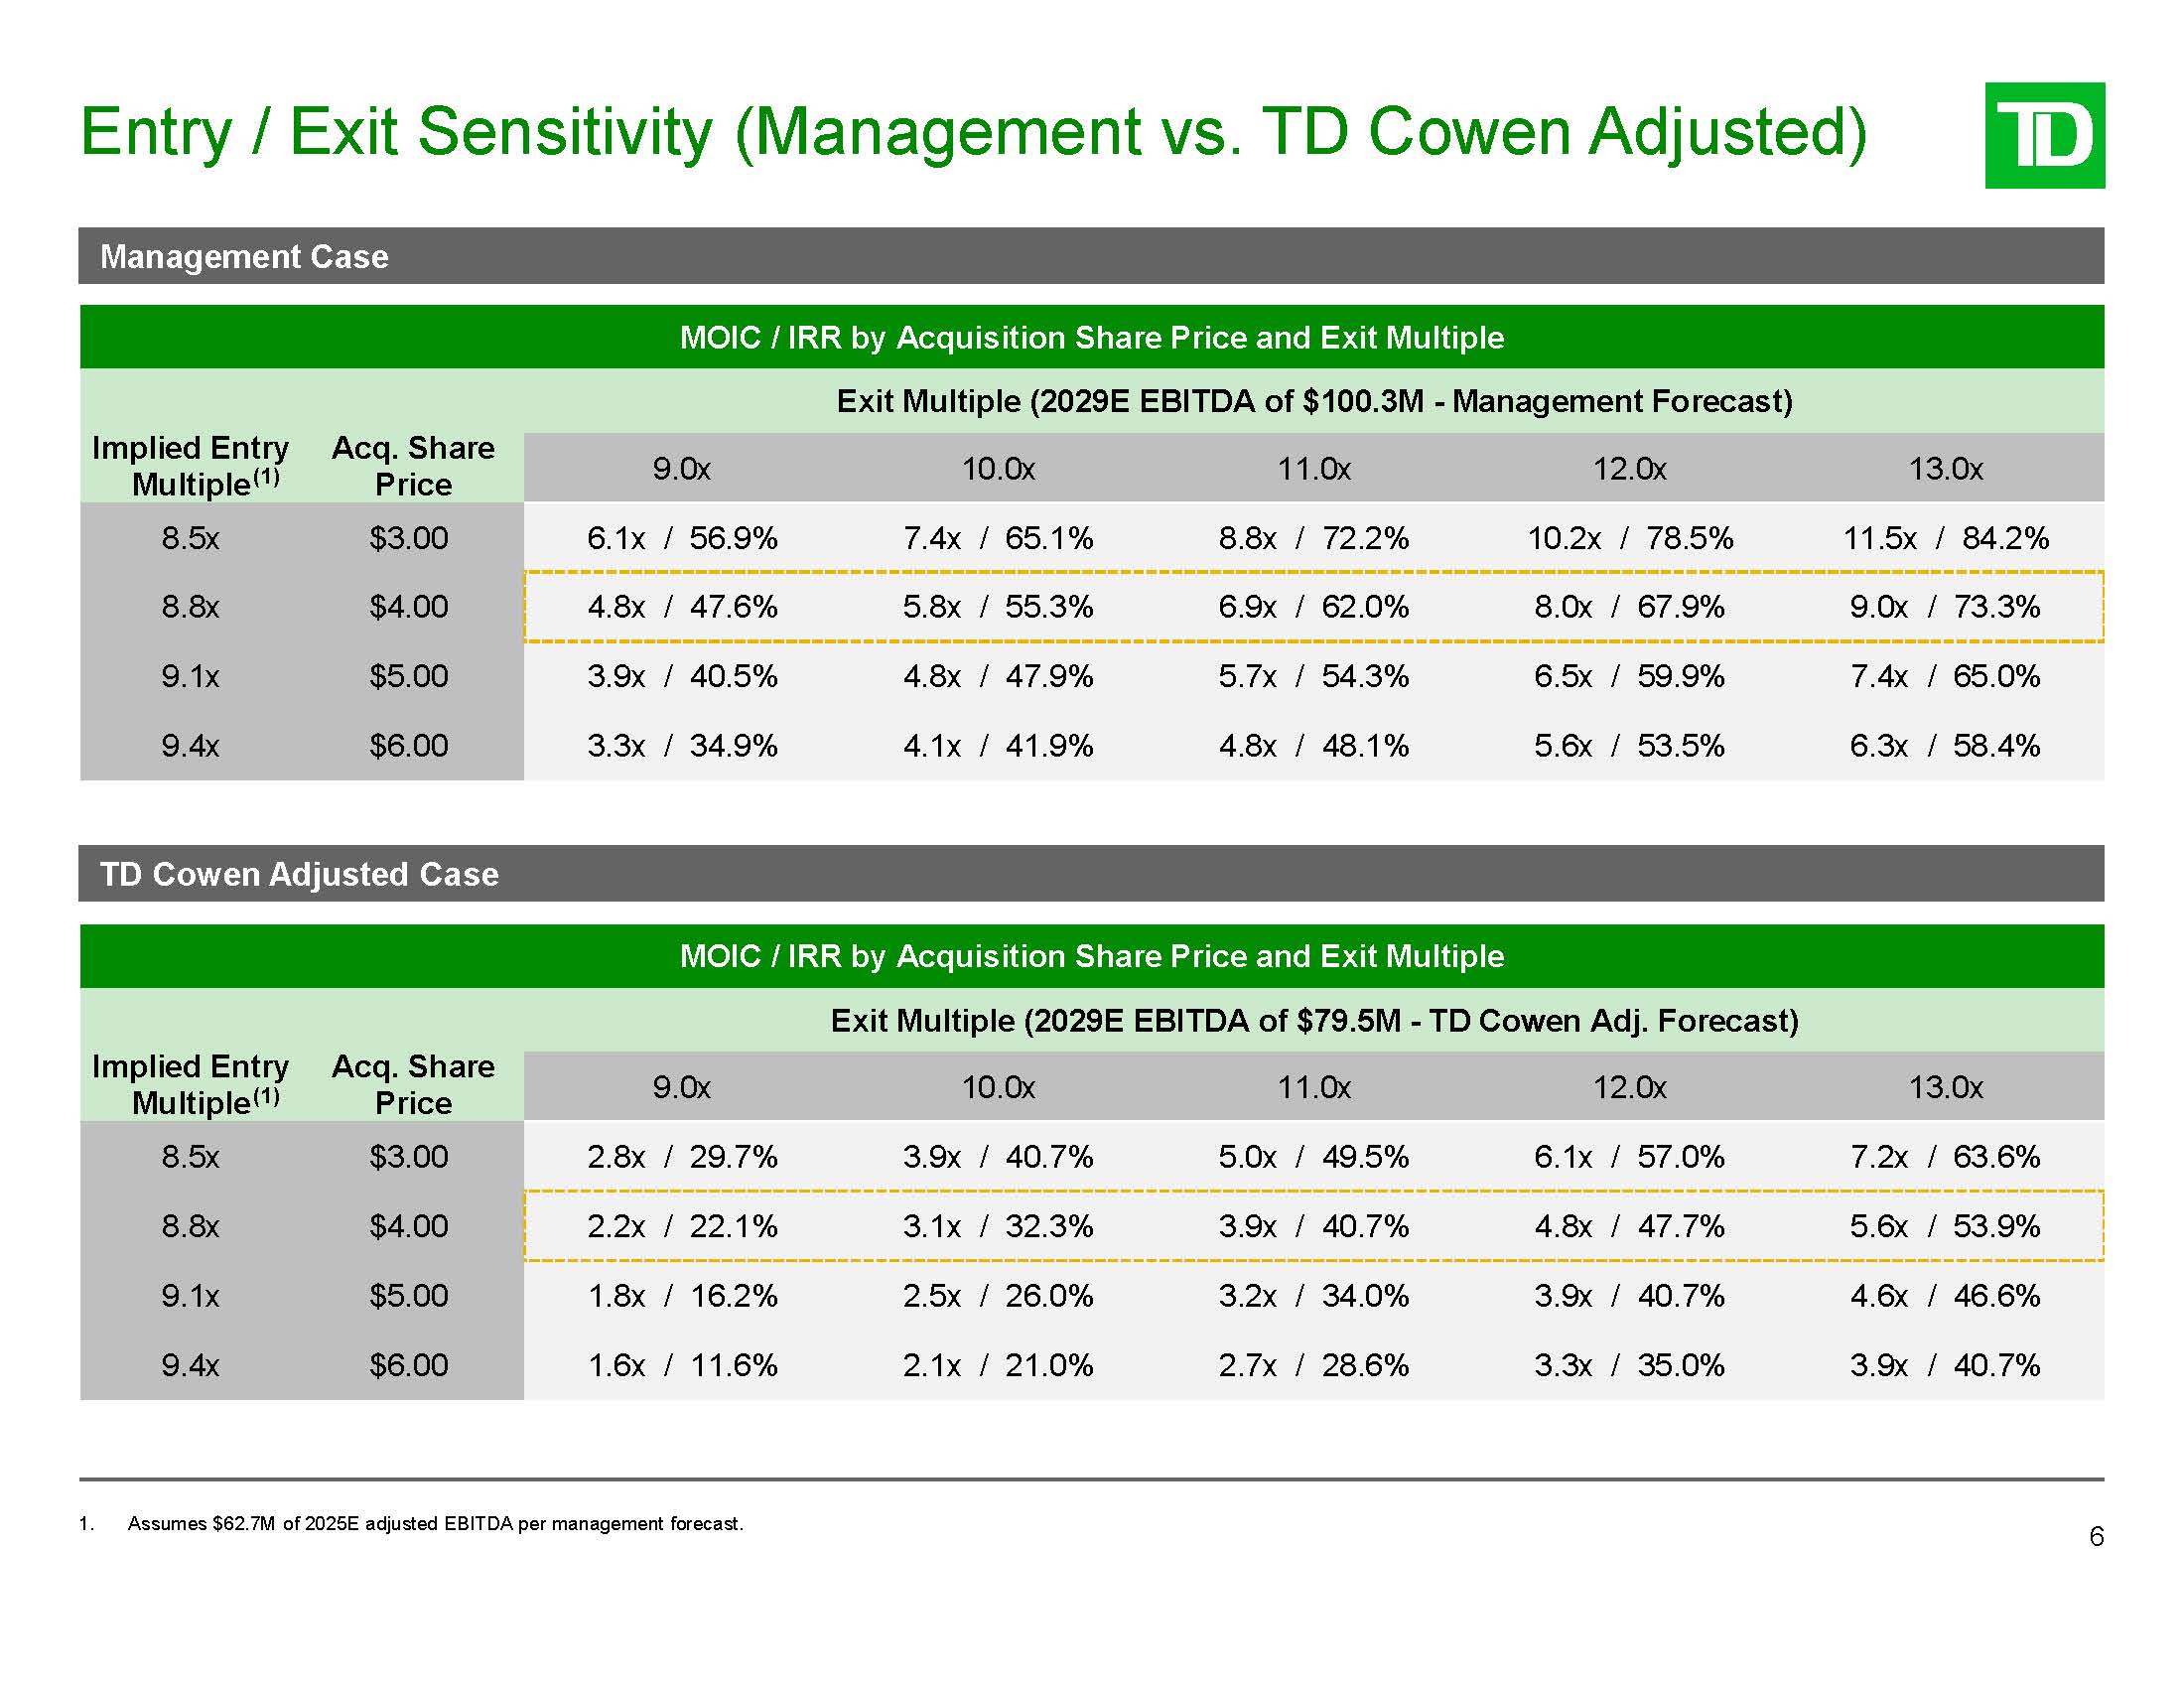
MOIC / IRR by Acquisition Share Price and Exit Multiple Exit Multiple (2029E
EBITDA of $79.5M - TD Cowen Adj. Forecast) Implied Entry Multiple (1) Acq. Share Price 9.0x 10.0x 11.0x 12.0x 13.0x 8.5x $3.00 2.8x / 29.7% 3.9x / 40.7% 5.0x / 49.5% 6.1x / 57.0% 7.2x / 63.6% 8.8x $4.00 2.2x /
22.1% 3.1x / 32.3% 3.9x / 40.7% 4.8x / 47.7% 5.6x / 53.9% 9.1x $5.00 1.8x / 16.2% 2.5x / 26.0% 3.2x / 34.0% 3.9x / 40.7% 4.6x / 46.6% 9.4x $6.00 1.6x / 11.6% 2.1x / 21.0% 2.7x / 28.6% 3.3x / 35.0% 3.9x /
40.7% MOIC / IRR by Acquisition Share Price and Exit Multiple Exit Multiple (2029E EBITDA of $100.3M - Management Forecast) Implied Entry Multiple (1) Acq. Share Price 9.0x 10.0x 11.0x 12.0x 13.0x 8.5x $3.00 6.1x / 56.9% 7.4x /
65.1% 8.8x / 72.2% 10.2x / 78.5% 11.5x / 84.2% 8.8x $4.00 4.8x / 47.6% 5.8x / 55.3% 6.9x / 62.0% 8.0x / 67.9% 9.0x / 73.3% 9.1x $5.00 3.9x / 40.5% 4.8x / 47.9% 5.7x / 54.3% 6.5x / 59.9% 7.4x / 65.0% 9.4x $6.00 3.3x /
34.9% 4.1x / 41.9% 4.8x / 48.1% 5.6x / 53.5% 6.3x / 58.4% Entry / Exit Sensitivity (Management vs. TD Cowen Adjusted) 6 Management Case TD Cowen Adjusted Case 1. Assumes $62.7M of 2025E adjusted EBITDA per management forecast.

Illustrative Analysis at Various Prices 7 Illustrative Analysis at Various
Multiples ($ in millions) Source: S&P Capital IQ as of September 8, 2025. Reflects management estimates. Note: Balance sheet cash, term loan, convertible notes, and preferred equity reflect 2025E year-end balances. 1. Total shares
includes 2.4M shares related to Searchlight warrants and excludes RSUs. Share Price Shares Outstanding (1) $3.00 19.9 $3.50 19.9 $4.00 19.9 $4.50 19.9 $5.00 19.9 Implied Equity Value $59.7 $69.6 $79.6 $89.5 $99.5 (-) Cash and
Cash Equivalents (29.6) (29.6) (29.6) (29.6) (29.6) (+) Debt and Preferred Equity 500.9 500.9 500.9 500.9 500.9 Enterprise Value $531.0 $541.0 $550.9 $560.9 $570.8 Premium to: Current Share
Price $2.32 29.3% 50.9% 72.4% 94.0% 115.5% Last 6-Months VWAP $2.41 24.4% 45.1% 65.9% 86.6% 107.3% LTM VWAP $2.26 32.8% 54.9% 77.1% 99.2% 121.4% 52-Week High (One Day -
12/31/24) $3.22 (6.8%) 8.7% 24.2% 39.8% 55.3% Implied Multiples: EV / 2025E Revenue ($290.0M) 1.8x 1.9x 1.9x 1.9x 2.0x EV / 2025E EBITDA ($62.7M) 8.5x 8.6x 8.8x 9.0x 9.1x EV / 2026E Revenue
($295.5M) 1.8x 1.8x 1.9x 1.9x 1.9x EV / 2026E EBITDA ($64.0M) 8.3x 8.5x 8.6x 8.8x 8.9x

Levered FCF Walk – Management Case 8 Note: Balance sheet cash, term loan,
convertible notes, and preferred equity reflect 2025E year-end balances. Current share price as of September 8, 2025. Reflects management forecast and guidance, subject to further diligence. Capex includes labor and PP&E expenditures. TD
Cowen estimate, subject to further diligence. Total shares includes 2.4M shares related to Searchlight warrants and excludes RSUs. Includes the $150M strategic investment from Searchlight from November 15, 2023, KORE’s $2.9M purchase of 5M
shares from Twilio from December 13, 2023, and the total amount of the accrued interest due to Searchlight as of December 31, 2025. Implied Metrics EV / 2025E Revenue EV / 2026E Revenue EV / 2025E Adj. EBITDA EV / 2026E Adj.
EBITDA $290.0 $295.5 $62.7 $64.0 1.9x 1.9x 8.8x 8.6x Sources & Uses Sources x EBITDA New Sponsor Equity $49.1 8% Rollover Equity 44.5 7% New Debt 300.0 4.8x 48% Rollover Preferred Equity 199.6 32% Cash on Balance
Sheet 29.6 5% Total $622.7 100% 181.3 120.0 199.6 12.6 29.6 29% 19% 32% 2% 5% Total $622.7 100% Offer Structure Purchase Price Offer Price $4.00 Current Share Price $2.32 Premium to Current Share Price 72% Total
Shares(3) 19.898 Implied Equity Value $79.6 Less: Cash ($29.6) Add: Debt $301.3 Uses Add: Preferred (4) $199.6 Purchase of Equity $35.1 6% Implied Enterprise Value $550.9 Rollover Equity 44.5 7% Repay Term Loan Repay
Convertible Notes Rollover Preferred Equity(4) Fees & Expenses Cash to Balance Sheet Projected Levered Free Cash Flows $ in millions Historical Management
Forecast 2024A 2025E 2026E 2027E 2028E 2029E Revenue $286.1 $290.0 $295.5 $318.1 $344.3 $373.2 Adj. EBITDA $53.1 $62.7 $64.0 $74.4 $86.9 $100.3 Add: Eliminated Public Company Costs (1) 2.6 2.6 2.6 2.6 Less:
Integration-related Costs (1) (2.0) (2.0) - - Less: Cash Interest Expense, Net (28.5) (26.6) (25.8) (24.6) Less: Levered Cash Taxes - - - - Less: Capex (1) (10.2) (9.4) (9.8) (10.2) Less: (Increase) / Decrease in NWC
(2) (5.0) (5.0) (5.0) (5.0) Available Cash Flow $20.8 $34.0 $48.9 $63.0 Less: Mandatory Amortization (3.0) (3.0) (3.0) (3.0) Available Cash Flow After Mandatory Amortization $17.8 $31.0 $45.9 $60.0 Less: Excess Cash Flow
Sweep - - - - Levered Free Cash Flow, Post FCF Sweep $17.8 $31.0 $45.9 $60.0 Total Debt Outstanding $297.0 $294.0 $291.0 $288.0 Cumulative Debt Paydown 1.0% 2.0% 3.0% 4.0% Net Debt / EBITDA 3.9x 2.9x 1.9x 1.0x
Implied Metrics EV / 2025E Revenue EV / 2026E Revenue EV / 2025E Adj. EBITDA EV
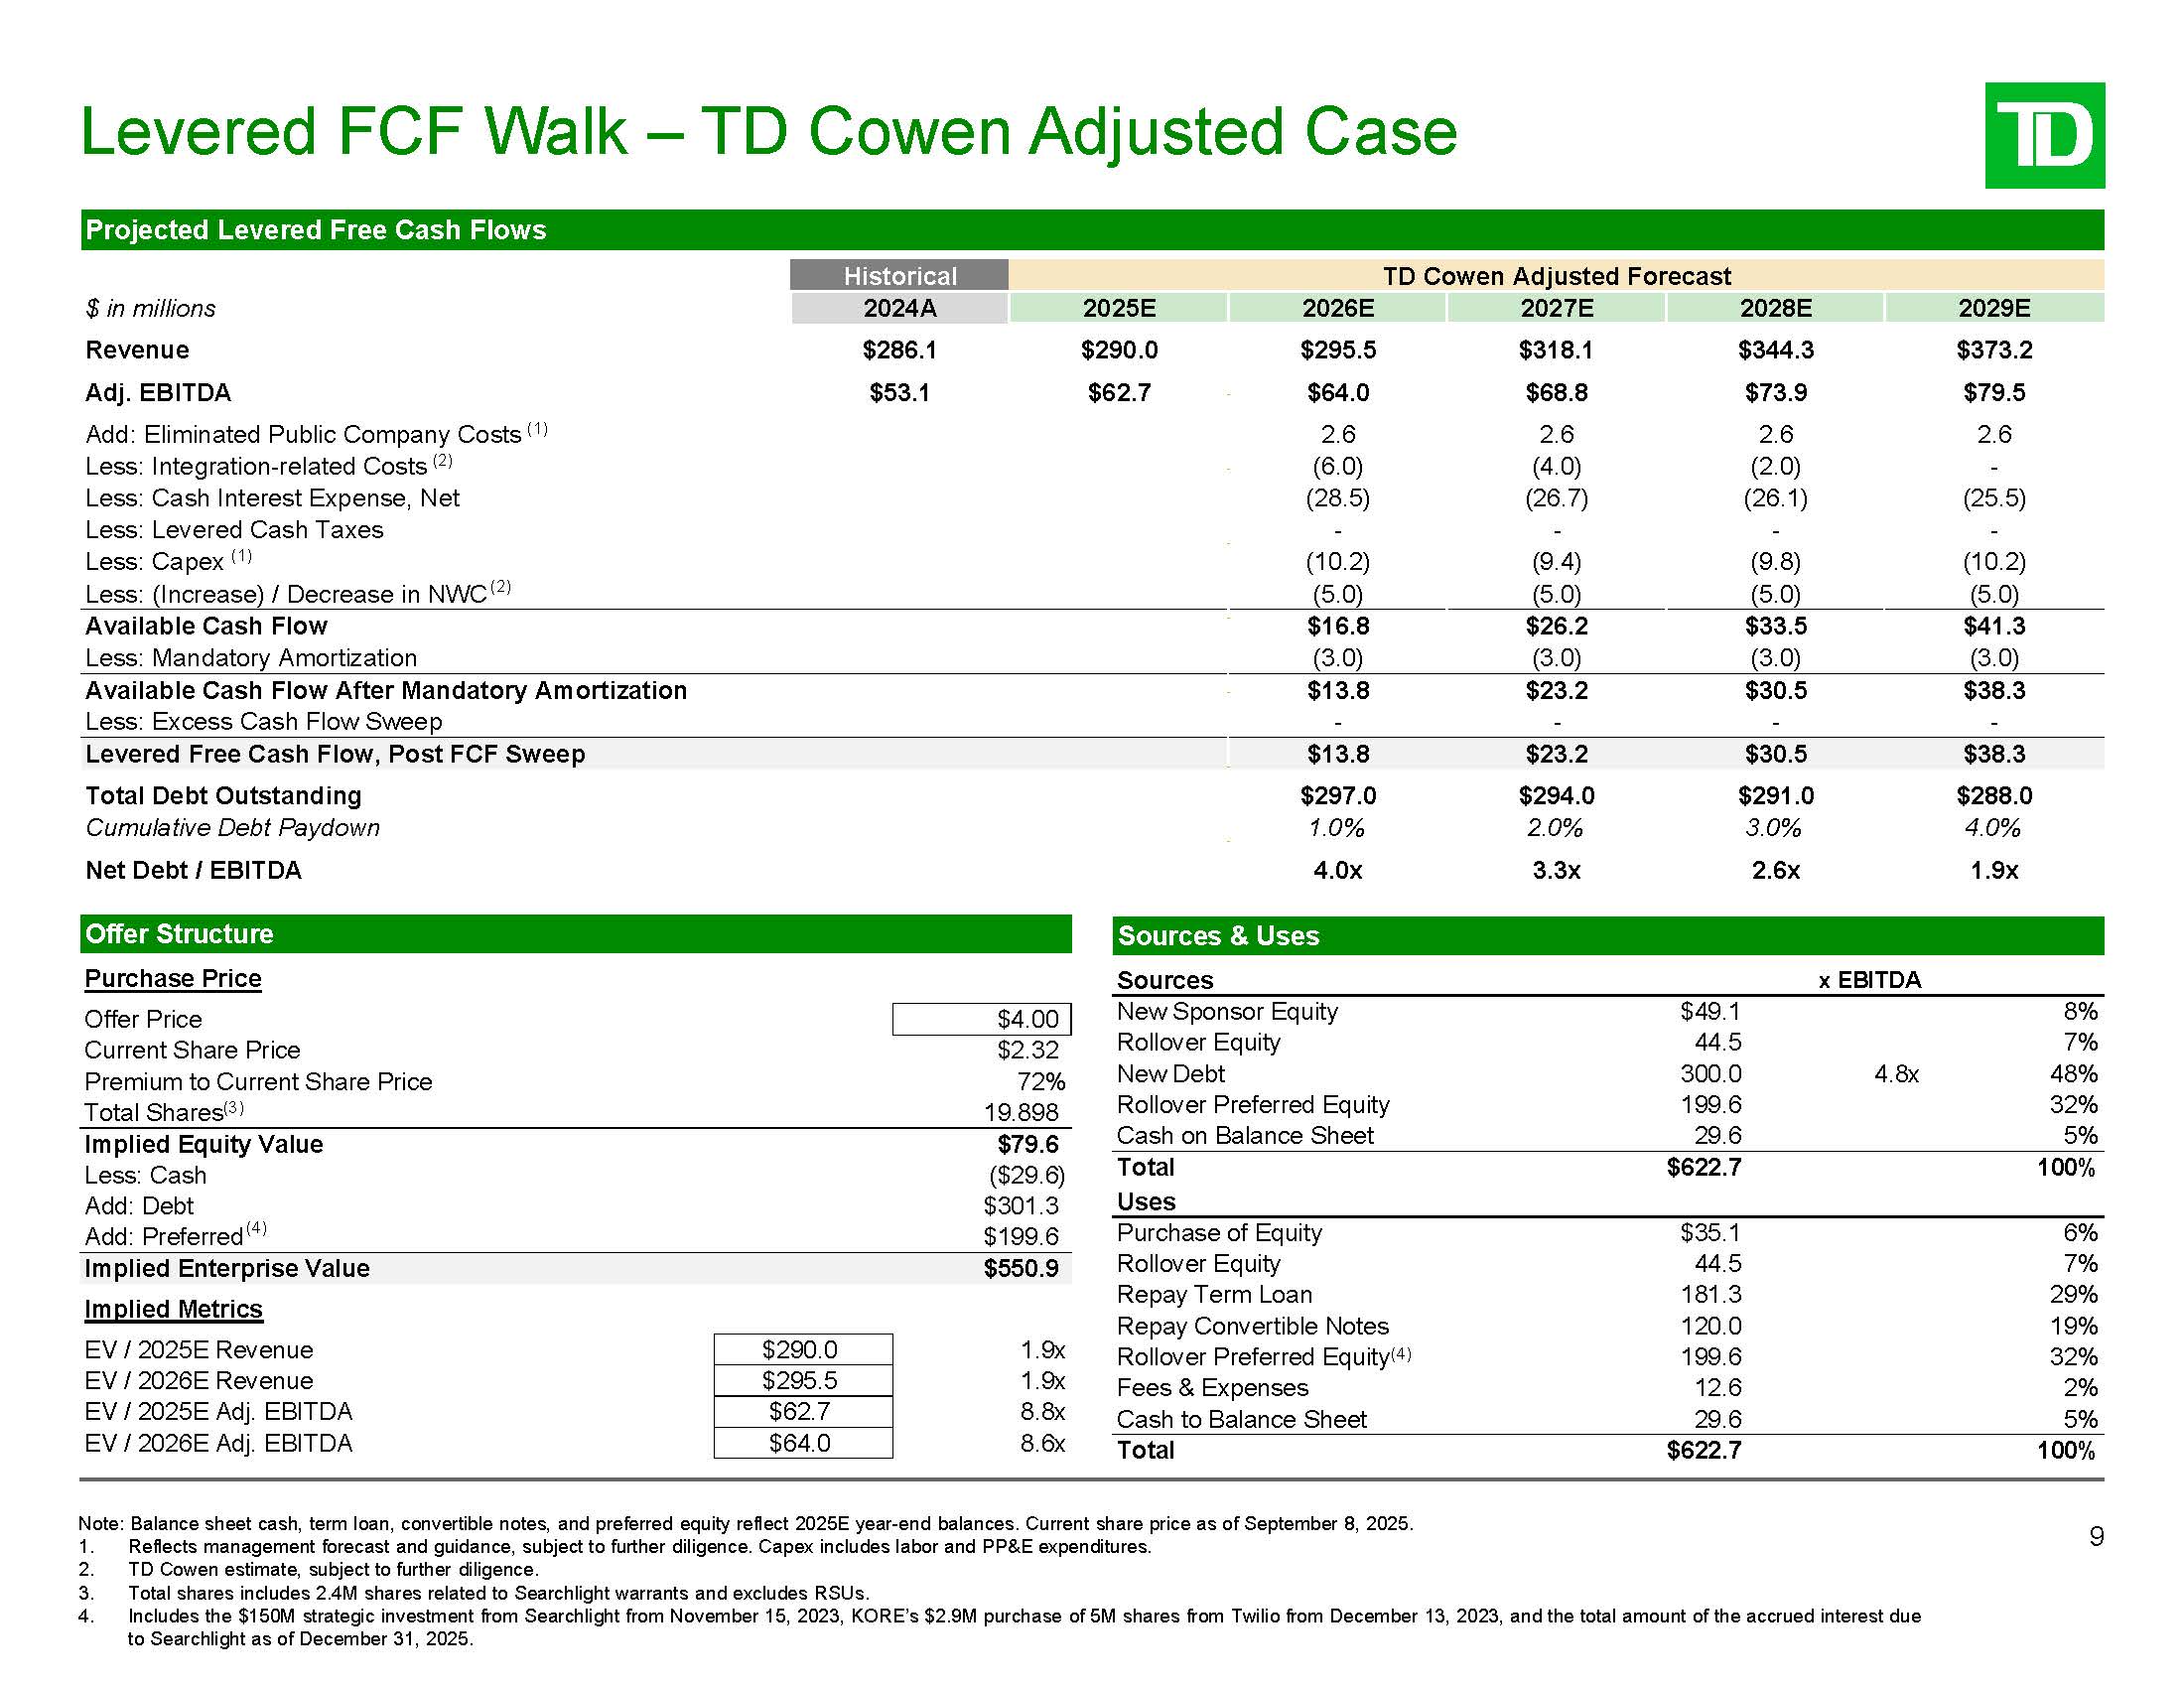
/ 2026E Adj. EBITDA $290.0 $295.5 $62.7 $64.0 1.9x 1.9x 8.8x 8.6x Levered FCF Walk – TD Cowen Adjusted Case 9 Note: Balance sheet cash, term loan, convertible notes, and preferred equity reflect 2025E year-end balances. Current share
price as of September 8, 2025. Reflects management forecast and guidance, subject to further diligence. Capex includes labor and PP&E expenditures. TD Cowen estimate, subject to further diligence. Total shares includes 2.4M shares
related to Searchlight warrants and excludes RSUs. Includes the $150M strategic investment from Searchlight from November 15, 2023, KORE’s $2.9M purchase of 5M shares from Twilio from December 13, 2023, and the total amount of the accrued
interest due to Searchlight as of December 31, 2025. Sources & Uses Sources x EBITDA New Sponsor Equity $49.1 8% Rollover Equity 44.5 7% New Debt 300.0 4.8x 48% Rollover Preferred Equity 199.6 32% Cash on Balance
Sheet 29.6 5% Total $622.7 100% 181.3 120.0 199.6 12.6 29.6 29% 19% 32% 2% 5% Total $622.7 100% Offer Structure Purchase Price Offer Price $4.00 Current Share Price $2.32 Premium to Current Share Price 72% Total
Shares(3) 19.898 Implied Equity Value $79.6 Less: Cash ($29.6) Add: Debt $301.3 Uses Add: Preferred (4) $199.6 Purchase of Equity $35.1 6% Implied Enterprise Value $550.9 Rollover Equity 44.5 7% Repay Term Loan Repay
Convertible Notes Rollover Preferred Equity(4) Fees & Expenses Cash to Balance Sheet Projected Levered Free Cash Flows $ in millions Historical TD Cowen Adjusted
Forecast 2024A 2025E 2026E 2027E 2028E 2029E Revenue $286.1 $290.0 $295.5 $318.1 $344.3 $373.2 Adj. EBITDA $53.1 $62.7 $64.0 $68.8 $73.9 $79.5 Add: Eliminated Public Company Costs (1) 2.6 2.6 2.6 2.6 Less:
Integration-related Costs (2) (6.0) (4.0) (2.0) - Less: Cash Interest Expense, Net (28.5) (26.7) (26.1) (25.5) Less: Levered Cash Taxes - - - - Less: Capex (1) (10.2) (9.4) (9.8) (10.2) Less: (Increase) / Decrease in NWC
(2) (5.0) (5.0) (5.0) (5.0) Available Cash Flow $16.8 $26.2 $33.5 $41.3 Less: Mandatory Amortization (3.0) (3.0) (3.0) (3.0) Available Cash Flow After Mandatory Amortization $13.8 $23.2 $30.5 $38.3 Less: Excess Cash Flow
Sweep - - - - Levered Free Cash Flow, Post FCF Sweep $13.8 $23.2 $30.5 $38.3 Total Debt Outstanding $297.0 $294.0 $291.0 $288.0 Cumulative Debt Paydown 1.0% 2.0% 3.0% 4.0% Net Debt / EBITDA 4.0x 3.3x 2.6x 1.9x
Appendix
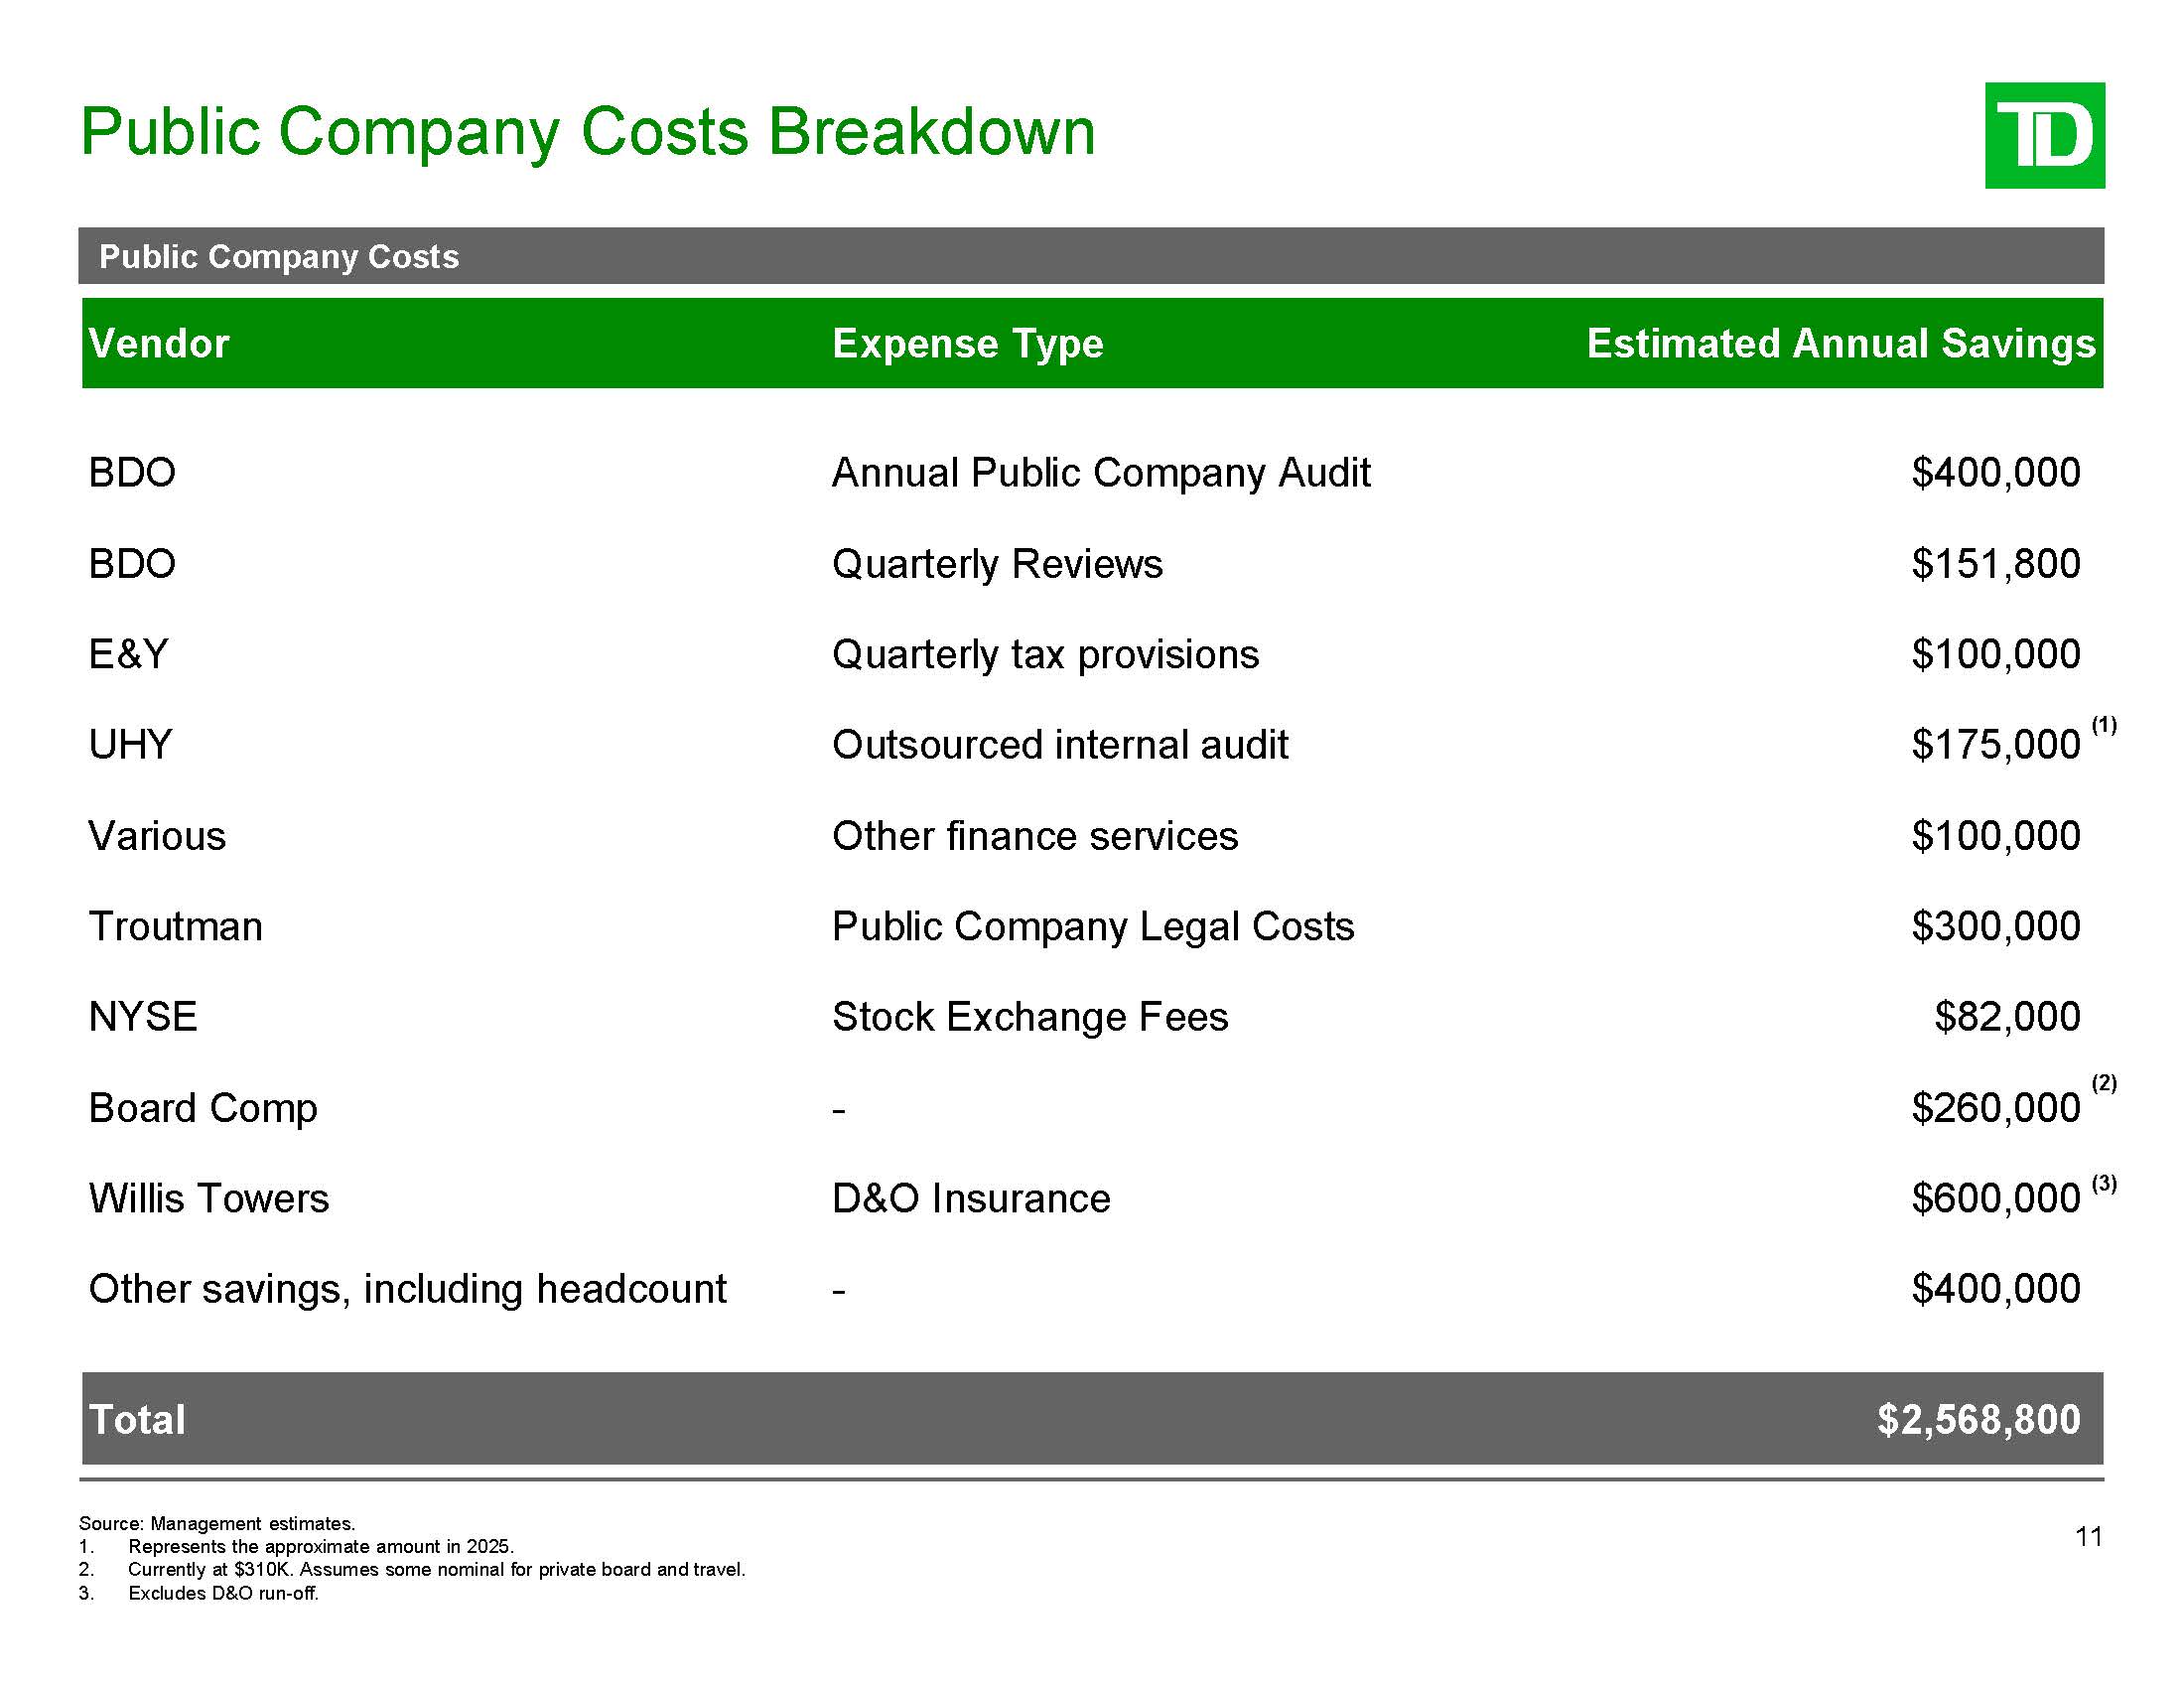
Public Company Costs Breakdown 11 Public Company Costs Vendor Expense
Type Estimated Annual Savings BDO Annual Public Company Audit $400,000 BDO Quarterly Reviews $151,800 E&Y Quarterly tax provisions $100,000 Source: Management estimates. Represents the approximate amount in 2025. Currently at
$310K. Assumes some nominal for private board and travel. Excludes D&O run-off. UHY Outsourced internal audit $175,000 Various Other finance services $100,000 Troutman Public Company Legal Costs $300,000 NYSE Stock Exchange
Fees $82,000 Board Comp - (2) $260,000 $600,000 (3) Willis Towers D&O Insurance Other savings, including headcount - $400,000 Total $2,568,800 (1)
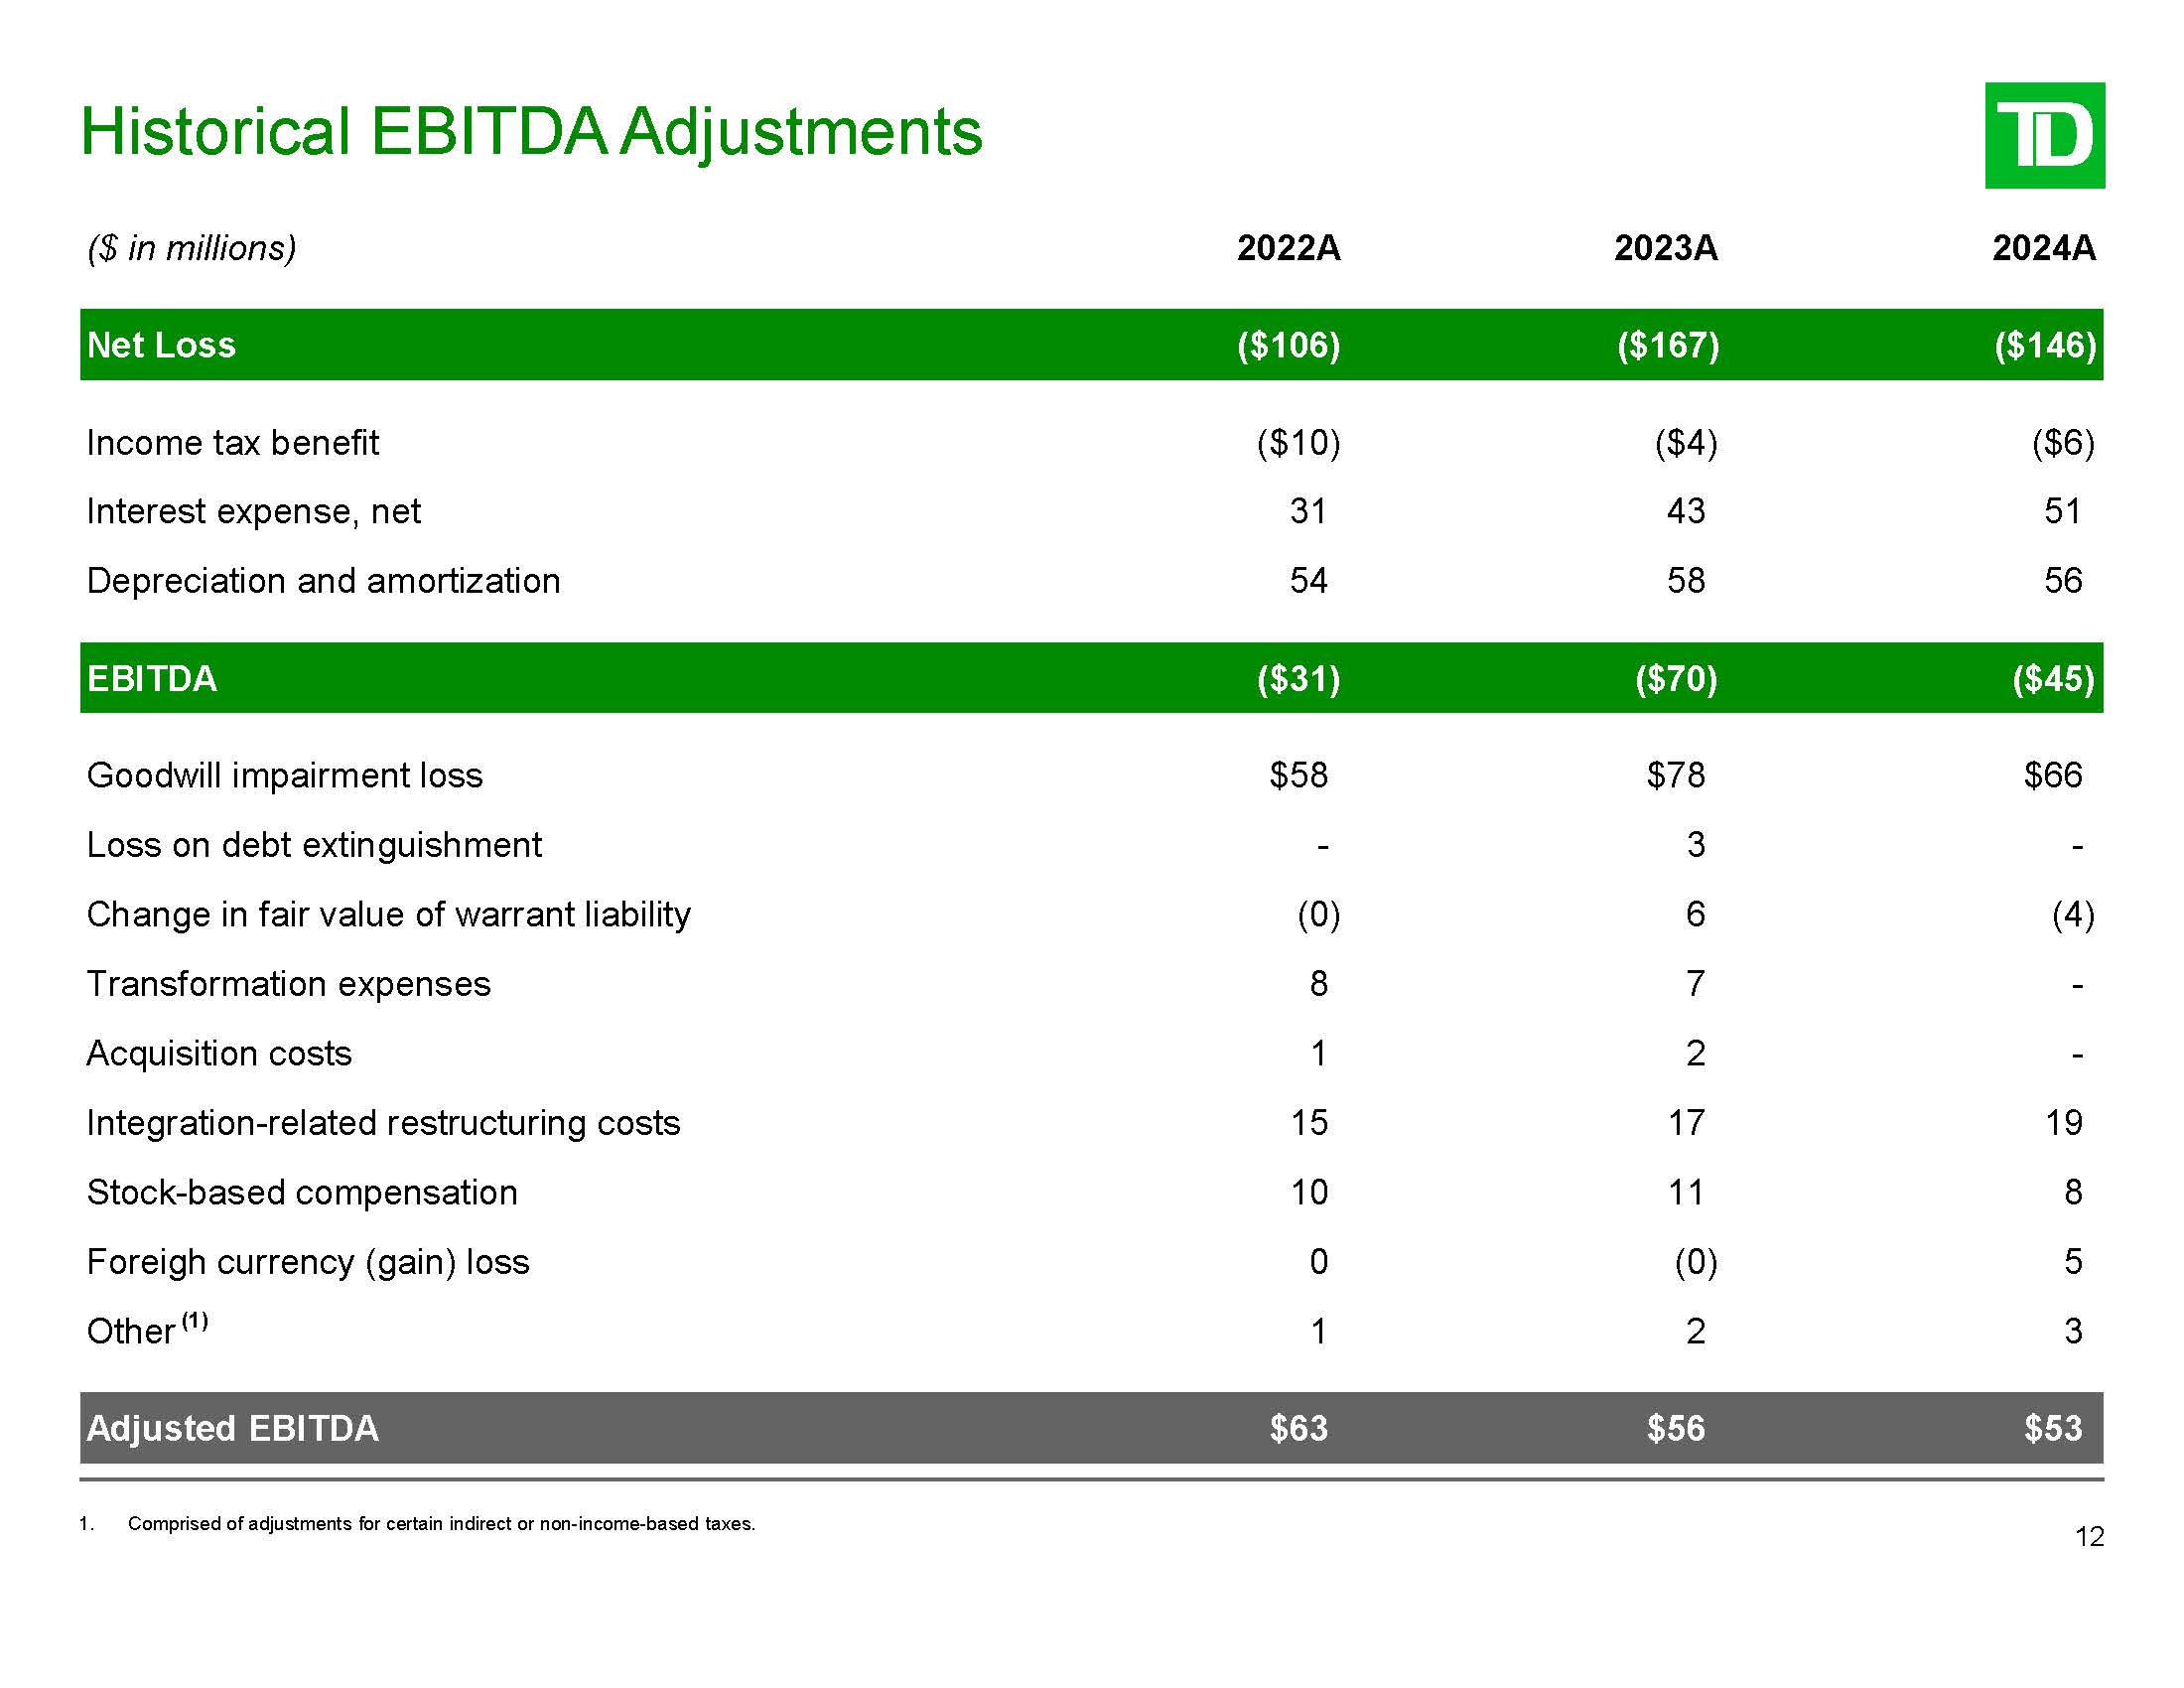
Historical EBITDA Adjustments ($ in millions) 2022A 2023A 2024A Net
Loss ($106) ($167) ($146) Income tax benefit ($10) ($4) ($6) Interest expense, net 31 43 51 Depreciation and amortization 54 58 56 EBITDA ($31) ($70) ($45) Goodwill impairment loss $58 $78 $66 Loss on debt
extinguishment - 3 - Change in fair value of warrant liability (0) 6 (4) Transformation expenses 8 7 - Acquisition costs 1 2 - Integration-related restructuring costs 15 17 19 Stock-based compensation 10 11 8 Foreigh
currency (gain) loss 0 (0) 5 Other (1) 1 2 3 Adjusted EBITDA $63 $56 $53 12 1. Comprised of adjustments for certain indirect or non-income-based taxes.
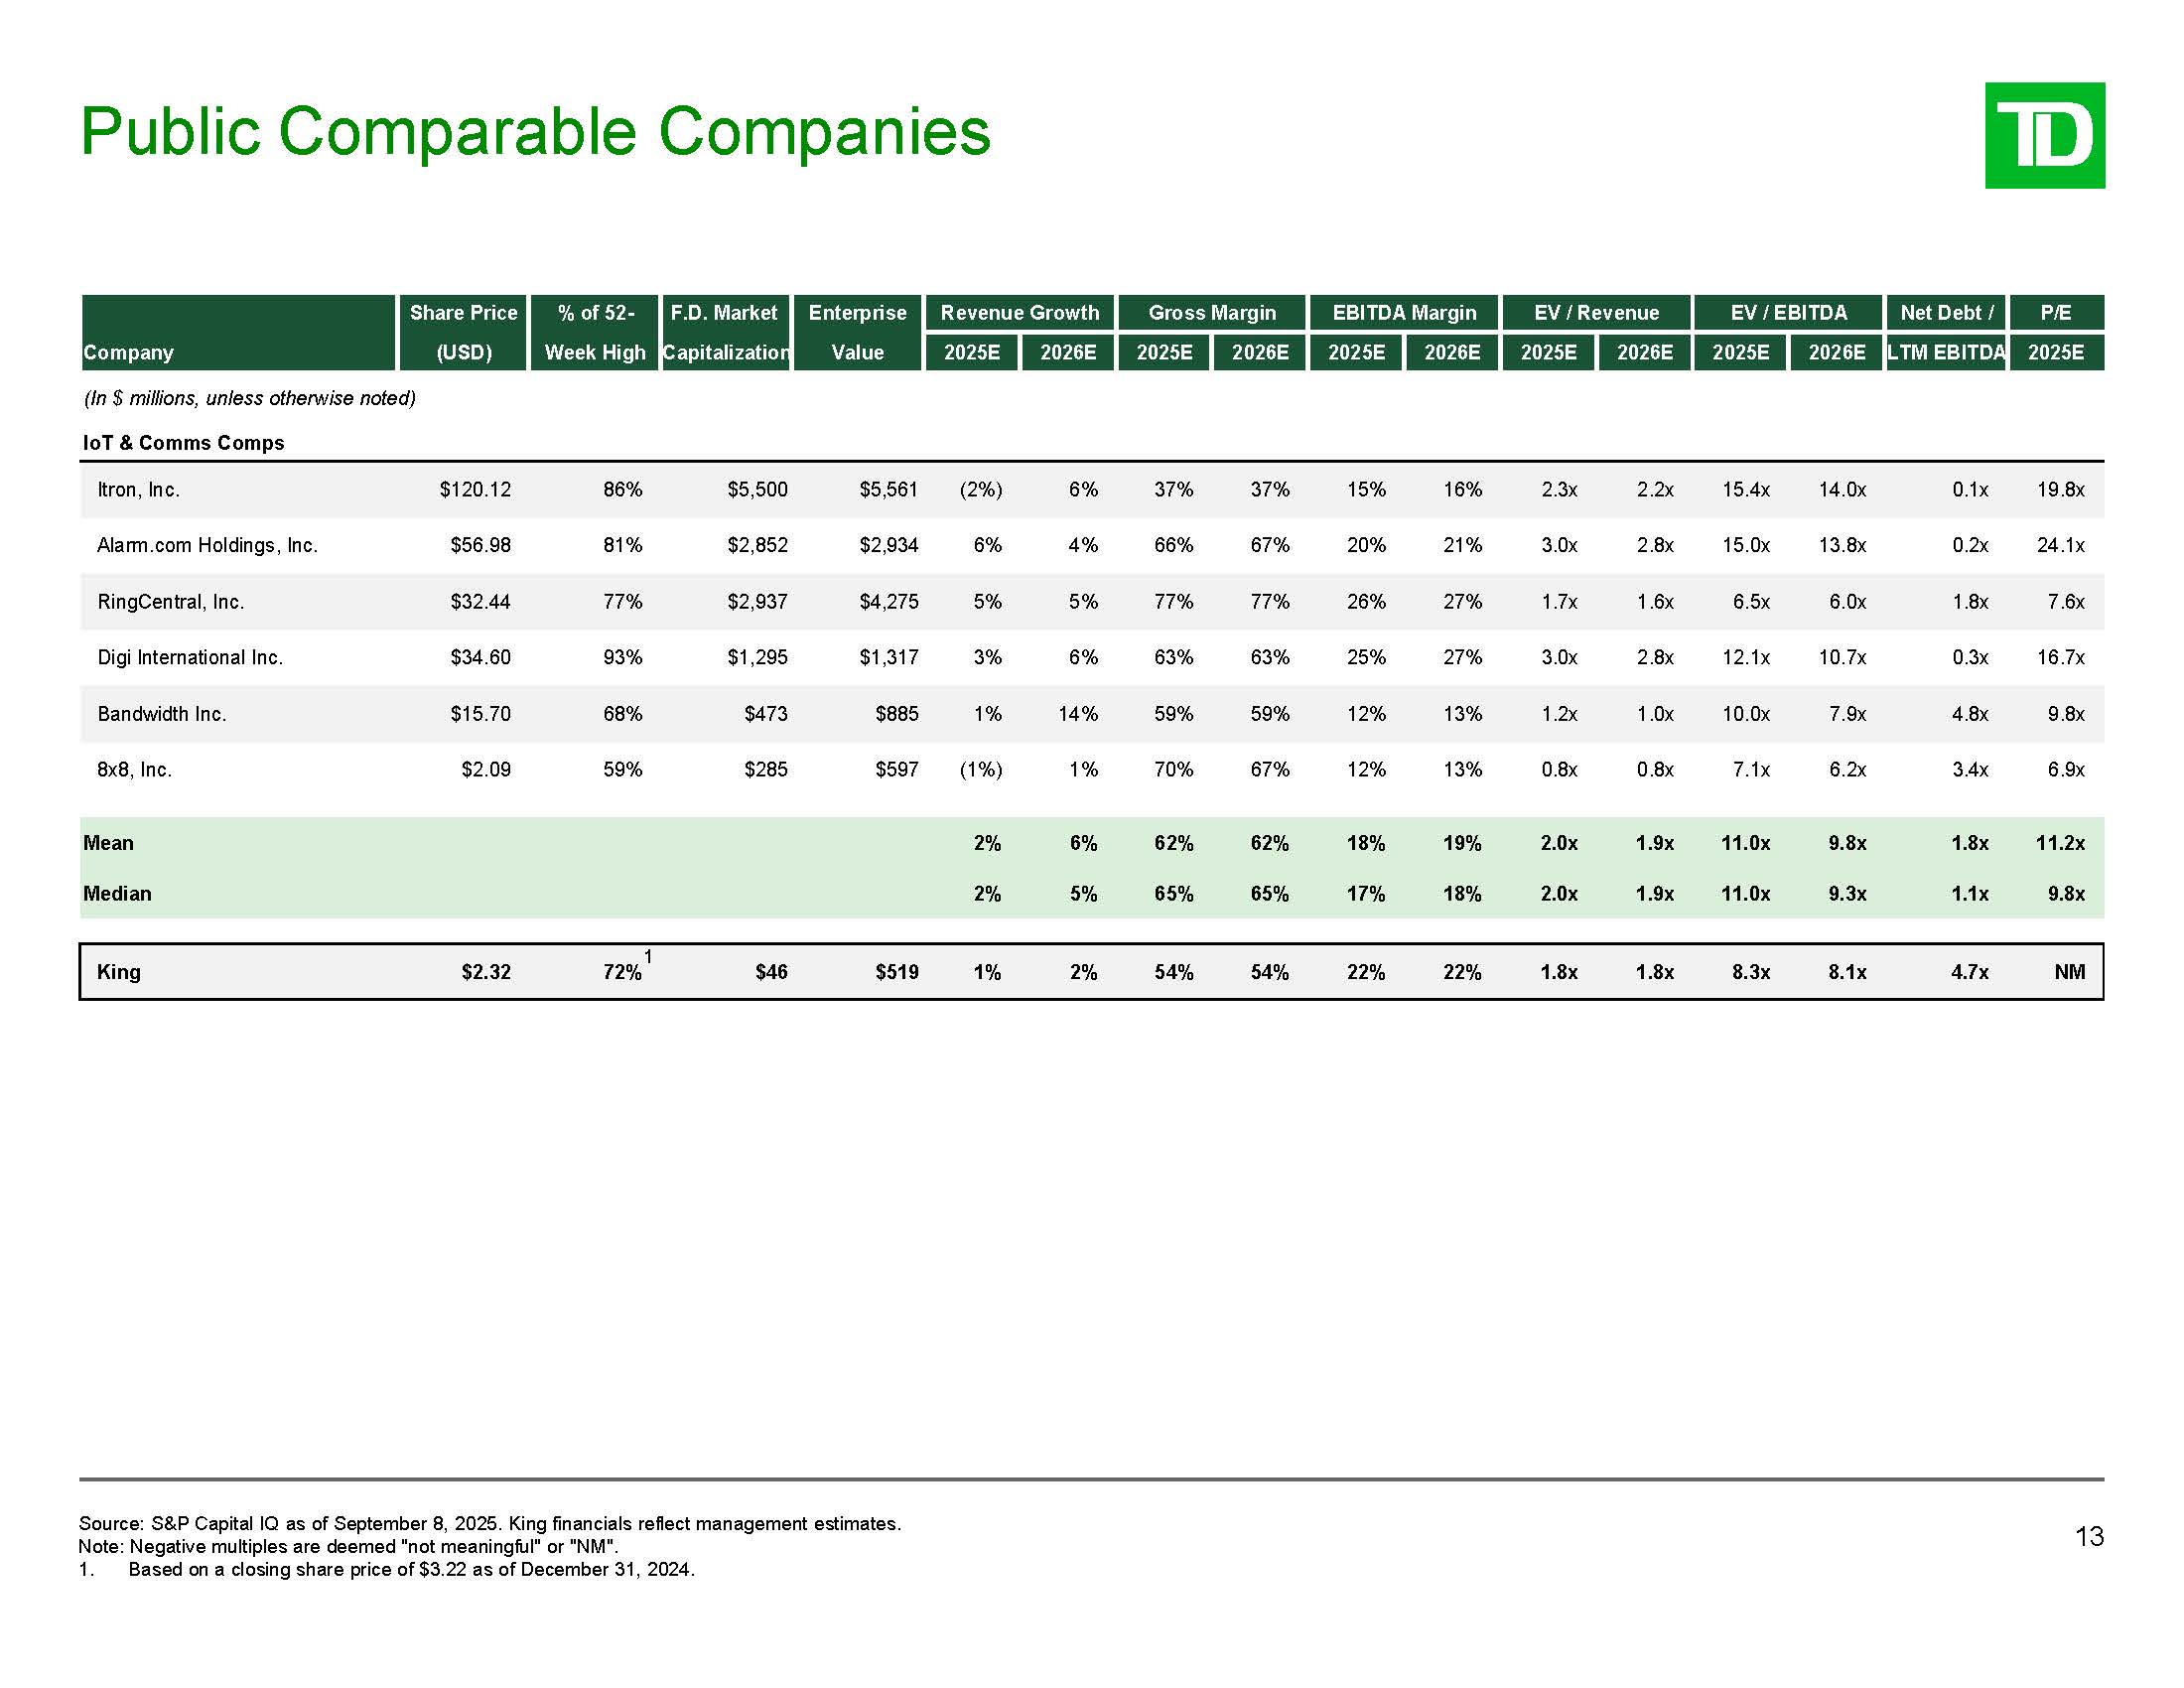
Company Share Price (USD) % of 52- Week High F.D.
Market Capitalization Enterprise Value Revenue Growth Gross Margin EBITDA Margin EV / Revenue EV / EBITDA Net Debt / P/E 2025E 2026E 2025E 2026E 2025E 2026E 2025E 2026E 2025E 2026E LTM EBITDA 2025E Itron,
Inc. $120.12 86% $5,500 $5,561 (2%) 6% 37% 37% 15% 16% 2.3x 2.2x 15.4x 14.0x 0.1x 19.8x Alarm.com Holdings, Inc. $56.98 81% $2,852 $2,934 6% 4% 66% 67% 20% 21% 3.0x 2.8x 15.0x 13.8x 0.2x 24.1x RingCentral,
Inc. $32.44 77% $2,937 $4,275 5% 5% 77% 77% 26% 27% 1.7x 1.6x 6.5x 6.0x 1.8x 7.6x Digi International Inc. $34.60 93% $1,295 $1,317 3% 6% 63% 63% 25% 27% 3.0x 2.8x 12.1x 10.7x 0.3x 16.7x Bandwidth
Inc. $15.70 68% $473 $885 1% 14% 59% 59% 12% 13% 1.2x 1.0x 10.0x 7.9x 4.8x 9.8x 8x8,
Inc. $2.09 59% $285 $597 (1%) 1% 70% 67% 12% 13% 0.8x 0.8x 7.1x 6.2x 3.4x 6.9x Mean 2% 6% 62% 62% 18% 19% 2.0x 1.9x 11.0x 9.8x 1.8x 11.2x Median 2% 5% 65% 65% 17% 18% 2.0x 1.9x 11.0x 9.3x 1.1x 9.8x King $2.32 $46 $519 1% 2% 54% 54% 22% 22% 1.8x 1.8x 8.3x 8.1x 4.7x NM (In
$ millions, unless otherwise noted) IoT & Comms Comps 1 72% Public Comparable Companies 13 Source: S&P Capital IQ as of September 8, 2025. King financials reflect management estimates. Note: Negative multiples are deemed "not
meaningful" or "NM". 1. Based on a closing share price of $3.22 as of December 31, 2024.
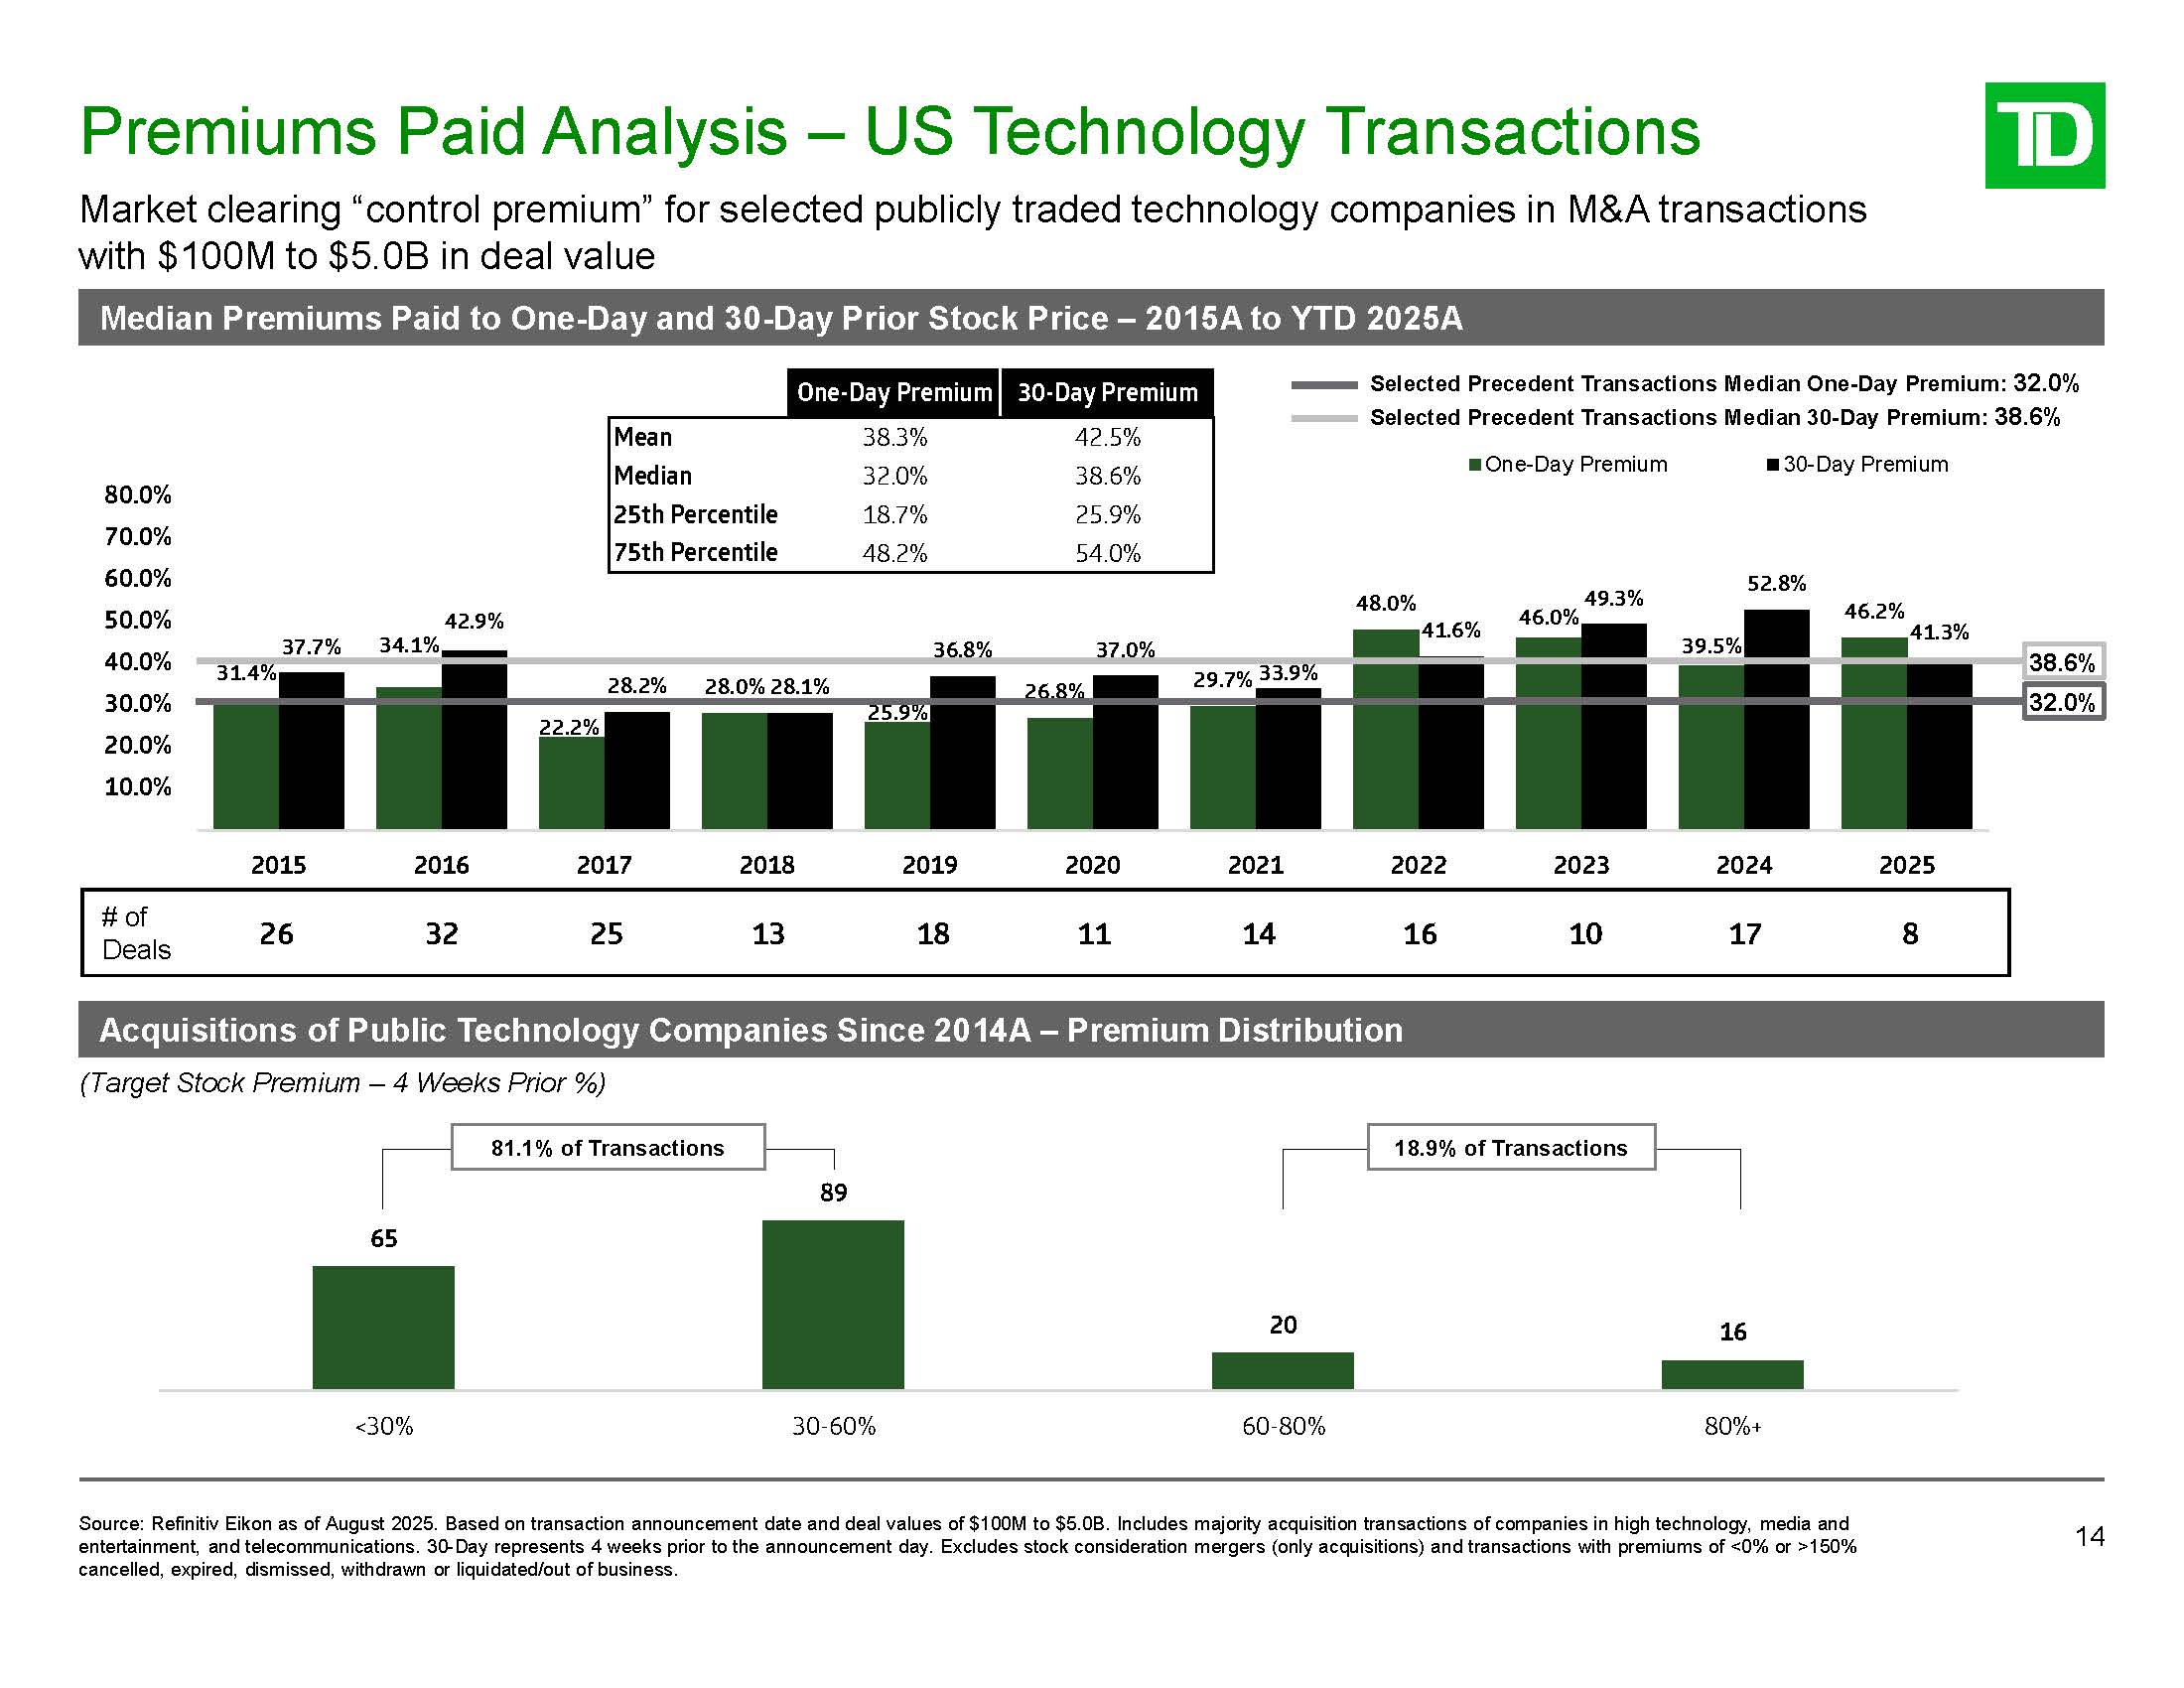
Premiums Paid Analysis – US Technology Transactions 14 Source: Refinitiv Eikon
as of August 2025. Based on transaction announcement date and deal values of $100M to $5.0B. Includes majority acquisition transactions of companies in high technology, media and entertainment, and telecommunications. 30-Day represents 4 weeks
prior to the announcement day. Excludes stock consideration mergers (only acquisitions) and transactions with premiums of <0% or >150% cancelled, expired, dismissed, withdrawn or liquidated/out of business. Median Premiums Paid to
One-Day and 30-Day Prior Stock Price – 2015A to YTD 2025A Market clearing “control premium” for selected publicly traded technology companies in M&A transactions with $100M to $5.0B in deal
value 34.1% 22.2% 25.9% 26.8% 29.7% 46.0% 39.5% 37.7% 31.4% 42.9% 28.2% 28.0% 28.1% 36.8% 37.0% 33.9% 41.6% 49.3% 46.2% 41.3% 52.8% 0.0% 80.0% 70.0% 60.0% 50.0% 40.0% 30.0% 20.0% 10.0% Chart Title Mean One-Day
Premium 30-Day Premium 38.3% 42.5% Median 32.0% 38.6% 25th Percentile 18.7% 25.9% 75th Percentile 48.2% 54.0% 48.0% 65 89 20 16 <30% 30-60% 60-80% 80%+ 81.1% of Transactions 18.9% of
Transactions Deals 2015 2016 2017 2018 2019 2020 2021 2022 2023 2024 2025 # of 26 32 25 13 18 11 14 16 10 17 8 32.0% 38.6% Selected Precedent Transactions Median One-Day Premium: 32.0% Selected Precedent Transactions
Median 30-Day Premium: 38.6% One-Day Premium 30-Day Premium Acquisitions of Public Technology Companies Since 2014A – Premium Distribution (Target Stock Premium – 4 Weeks Prior %)
Disclaimer These materials were prepared exclusively for the benefit and internal
use of the TD Securities client (the “Company” or “you”) to whom they are directly addressed and delivered in order to assist the Company in evaluating, on a preliminary basis, the feasibility of a possible transaction or transactions. These
materials were compiled or prepared on a confidential basis solely and exclusively for the use of the Company and not with a view to public disclosure or to conform to any disclosure standards under any securities laws or other laws, rules or
regulations. The information is for discussion purposes only, and must not be copied or reproduced, or disclosed, distributed or passed to others at any time without the prior written consent of TD Securities. These materials may not be used
for any purpose other than as may be specifically contemplated by a written agreement with TD Securities. These materials and the information contained herein do not purport to be all-inclusive or to contain all of the information, or to
identify or suggest all of the risks (direct or indirect), that may be associated with any possible transaction or transactions or that may be necessary to evaluate any possible transaction or transactions. The information in this presentation
reflects prevailing conditions and our views as of this date, all of which are accordingly subject to change. TD Securities’ opinions and estimates constitute TD Securities’ judgment and should be regarded as indicative, preliminary and for
illustrative purposes only. In preparing the materials, TD Securities has relied upon documents and information prepared for or supplied to TD Securities by the Company and other sources, without independent verification by TD Securities. Any
estimates and projections contained herein have been based upon estimates and projections contained in such documents and third-party sources, and there is no assurance that such estimates and projections will be realized. None of TD
Securities, its affiliates or its or their respective officers, directors, employees, advisors or representatives (“Representatives”) makes any representation or warranty (express or implied) as to the accuracy or completeness of any
information contained herein or any other written or oral communication transmitted or made available to you in connection with an evaluation of a possible transaction, and nothing contained herein or therein is, or shall be construed or relied
upon as, a representation or warranty, whether as to the past, present or future. TD Securities does not have any obligation to update or otherwise revise the materials and information contained herein (though all information contained herein
is subject to revision). TD Securities believes that these materials must be considered as a whole and that selecting portions of the analyses and the factors considered by TD Securities, without considering all of the factors and analyses
together, could create a misleading view of the presentation. The preparation of a presentation such as this is complex and is not necessarily susceptible of partial analysis or summary description. Any attempt to do so could lend to undue
emphasis on any particular factor or analysis. Any market valuations contained herein are indicative values as of the time and date indicated for illustrative purposes only. TD Securities does not warrant their completeness or accuracy. Any
price or valuation constitutes our judgment and is subject to change without notice. Investors should understand that statements regarding future prospects may not be realized. TD Securities cannot guarantee that different prices and/or
valuations would not be available elsewhere and suggests that valuations from other sources be obtained for comparison. Actual quotations could differ subject to market conditions. TD Securities’ policies prohibit employees from offering,
directly or indirectly, a favorable research rating or specific price target, or offering to change a rating or price target, to a subject company as consideration or inducement for the receipt of business or for compensation. TD Securities
also prohibits its research analysts from being compensated for involvement in investment banking transactions except to the extent that such participation is intended to benefit investors. Nothing herein should be construed as tax,
accounting, regulatory or legal advice. TD Securities is not acting in any fiduciary, advisory, agency or similar capacity to the Company. Prior to entering into any possible transaction, you should determine the financial suitability, risks
and merits of such transaction, including all economic, legal, tax, accounting or any other consequences associated therewith. Neither TD Securities nor any of its Representatives will be liable to the Company or any third party, whether for
negligence, breach of contract or otherwise, for any loss or damage of whatsoever nature suffered by the Company or a third party (including, without limitation, direct loss or damage, indirect or consequential loss or damage, loss of goodwill,
loss of business opportunity, loss of data or loss of profit) arising from TD Securities providing you with these materials or the information contained herein or any other written or oral communication transmitted or made available to you in
connection with an evaluation of a possible transaction. TD Securities and its affiliates expressly disclaim any and all liability relating to, resulting from or based, in whole or in part, on such information, errors therein or omissions
therefrom. These materials do not constitute a commitment, express or implied, by TD Securities or any of its affiliates to enter into any transaction, underwrite, subscribe for, purchase or place any securities or to extend or arrange credit
or to otherwise provide any financing or other services. Nothing in these materials (i) may be used in connection with, or should be construed as, an offer to sell, or a solicitation of an offer to buy or hold, an interest in any security or
investment product or (ii) shall constitute “directed selling efforts” in the United States under Regulation S promulgated under the Securities Act of 1933, as amended. Final terms and conditions, if any, and any obligation of TD Securities or
any of its affiliates with respect to any possible transaction discussed herein will be subject to (among other things): (i) satisfactory completion, in TD Securities’ sole discretion, of customary business, financial and legal due diligence
review and inquiry, (ii) execution of definitive documentation containing terms and conditions customary to TD Securities for similar transactions, (iii) market conditions, (iv) approval by the appropriate TD internal committee and (v) any
other conditions that TD Securities may deem appropriate. “TD Securities” is a trademark of The Toronto-Dominion Bank (“TD”) and represents certain investment banking, capital markets and wholesale banking activities conducted through certain
subsidiaries and branches of TD. “TD Cowen” is a division of TD Securities and represents a marketing name of certain businesses within TD Securities. TD Securities Inc. is regulated by the Canadian Investment Regulatory Organization of
Canada. TD Securities Inc. is a member of the Canadian Investor Protection Fund and a member of Canadian Marketplaces. The following affiliated entities are registered U.S. broker dealers with the U.S Securities and Exchange Commission and are
members of the Financial Industry Regulatory Authority and of the Securities Investor Protection Corporation: TD Securities (USA) LLC, TD Prime Services LLC, TD Securities Automated Trading LLC, TD Arranged Services LLC and Westminster Research
Associates LLC. TD is registered as a swap dealer with the U.S. Commodity Futures Trading Commission and is a member of the National Futures Association. TD is also registered as a security -based swap dealer with the U.S. Securities and
Exchange Commission. Cowen Financial Products LLC is registered as a security-based swap dealer with the U.S. Securities and Exchange Commission. TD, TD Bank Europe Limited and TD Execution Services Limited are regulated for investment
business conducted in the UK by the UK Financial Conduct Authority. TD Global Finance unlimited company is regulated for investment business conducted in Ireland by the Central Bank of Ireland. TD and Toronto Dominion (South East Asia) Limited
are regulated by the Monetary Authority of Singapore. All logos are property of their respective owners and are for identification purposes only. Use of these names, logos, and brands does not imply endorsement. Copyright © 2025 The
Toronto-Dominion Bank and/or its affiliates. All rights reserved. ® The TD logo and other TD trademarks are the property of The Toronto-Dominion Bank or its subsidiaries. 15